
Houses for sale & to rent in SP1 2SB, St John Street, Salisbury St Martins And Cathedral, Salisbury
House Prices in SP1 2SB, St John Street, Salisbury St Martins And Cathedral
Properties in SP1 2SB have no sales history available within the last 3 years. SP1 2SB is a postcode in St John Street located in Salisbury St Martins And Cathedral, an area in Salisbury, Wiltshire, with 4 households².
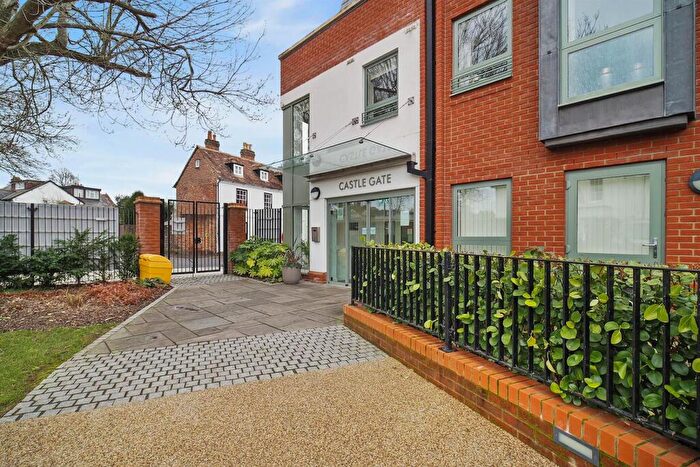
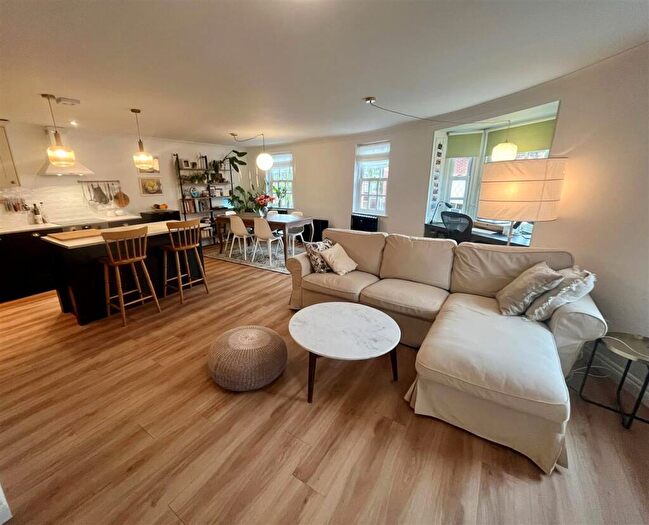
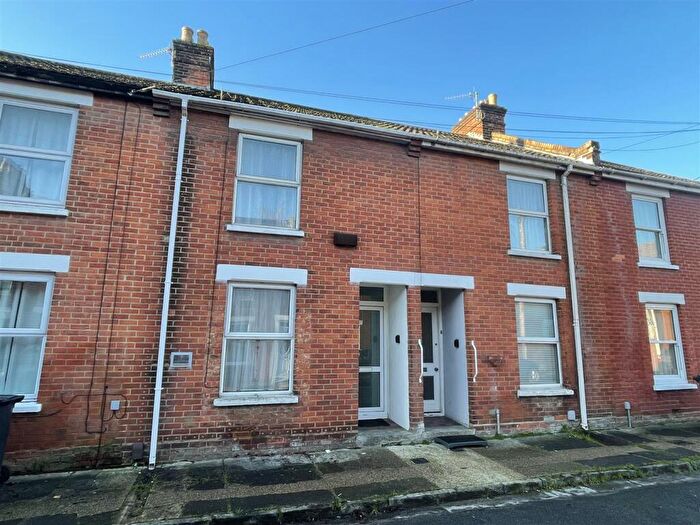
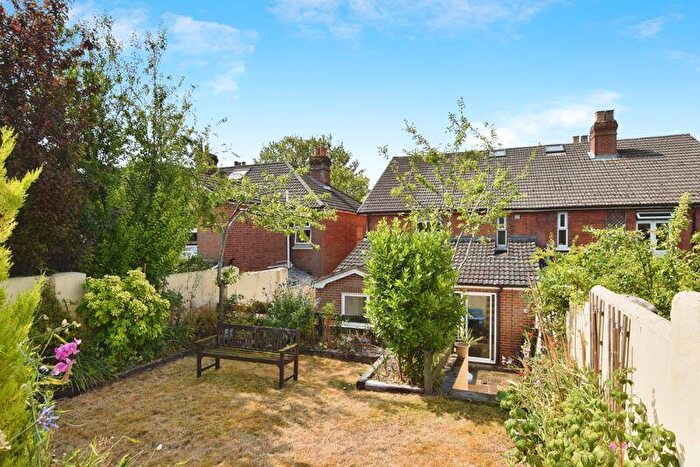
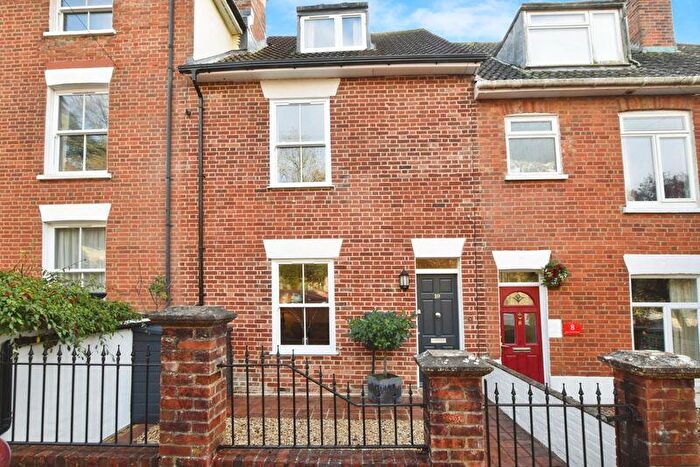
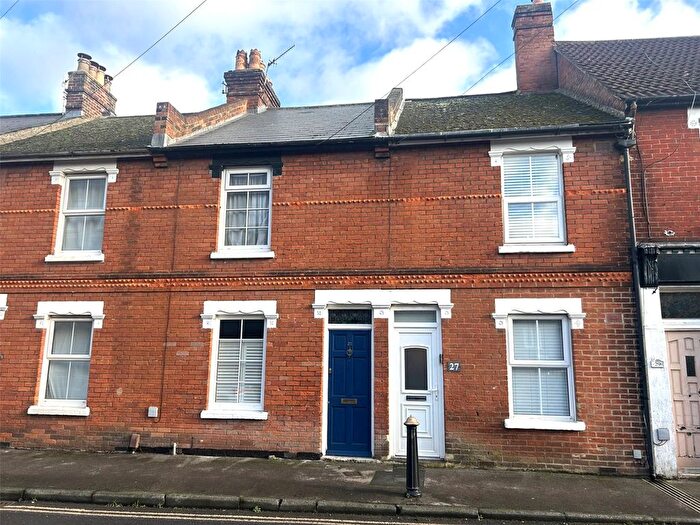
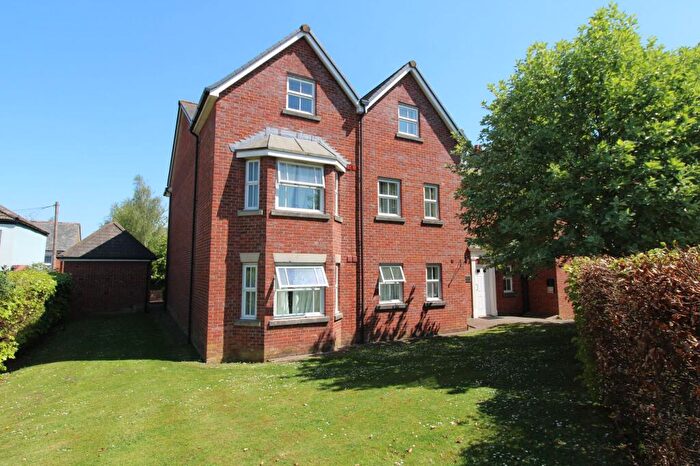
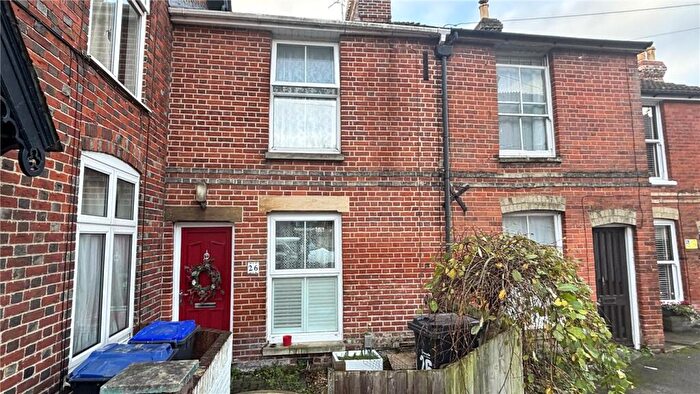
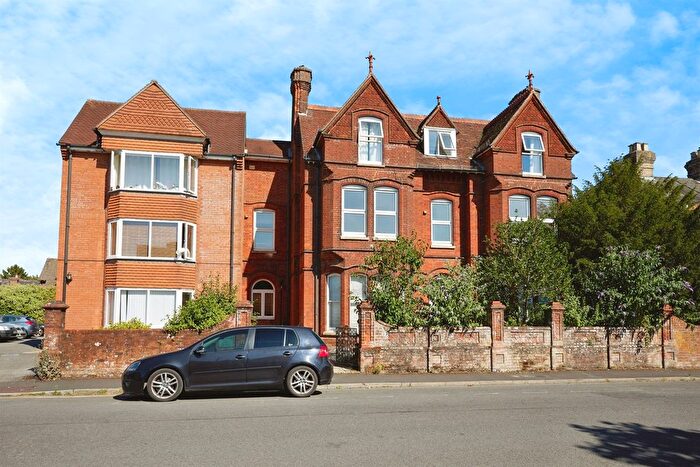
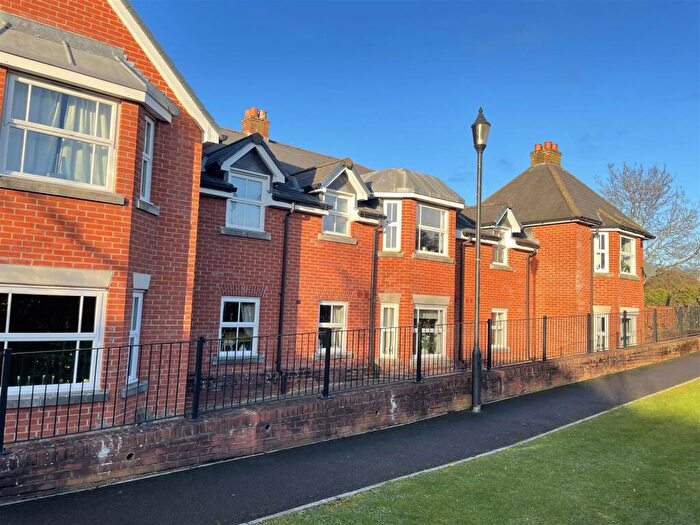
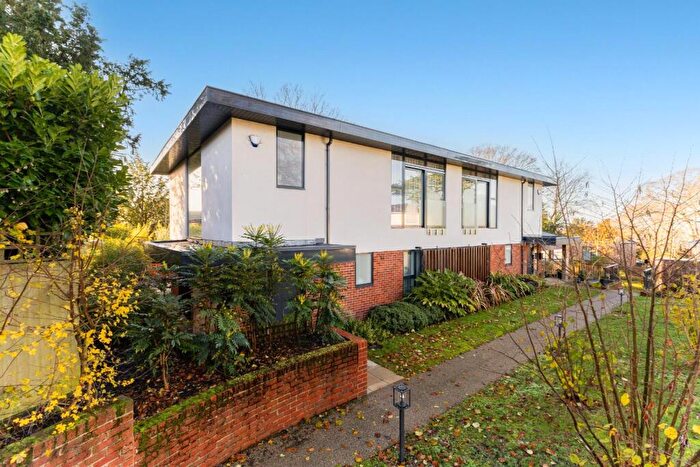
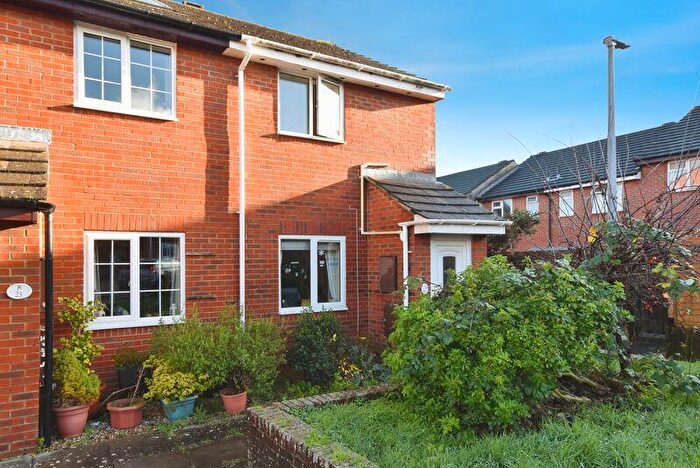
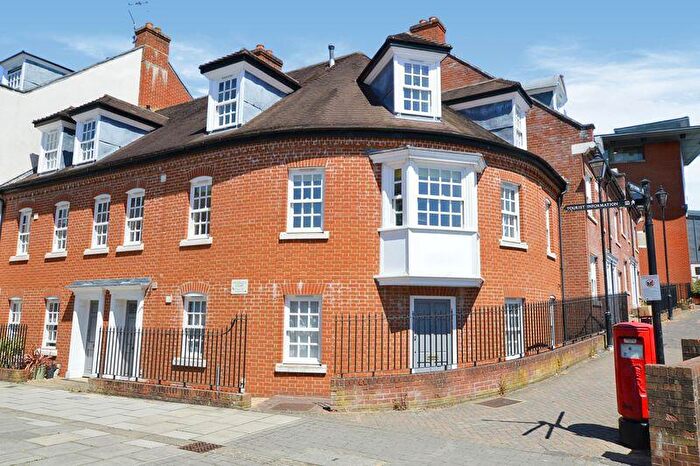
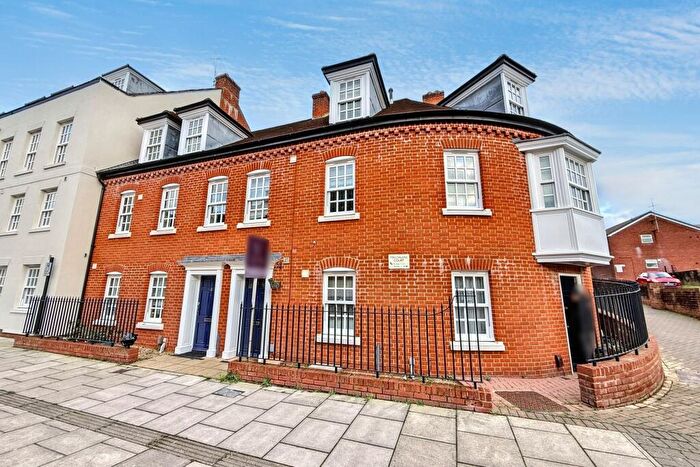
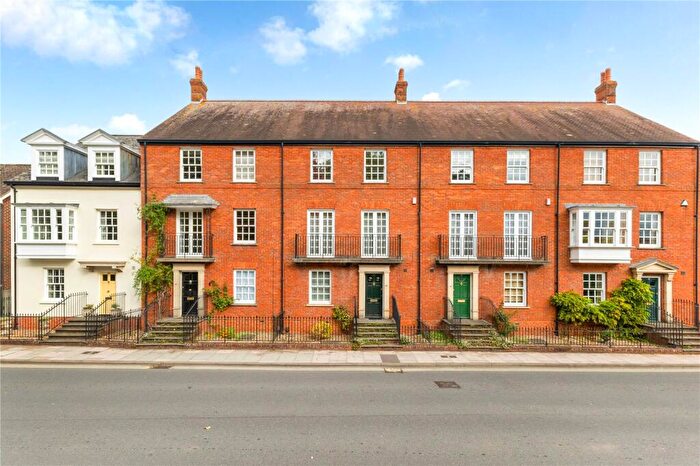
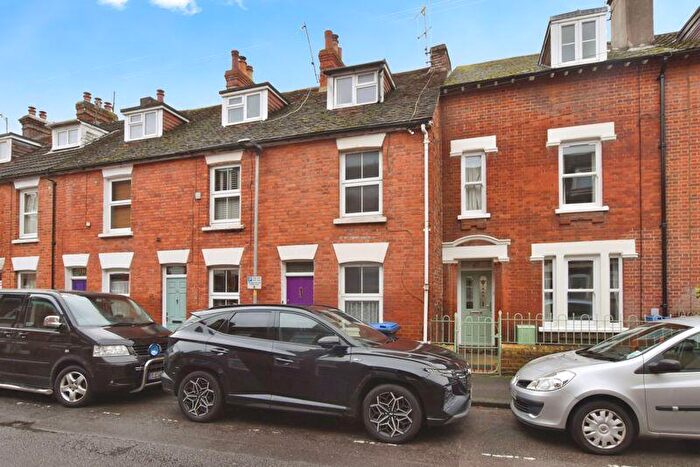
Properties for sale near SP1 2SB, St John Street
![]()
If you are looking to sell your house, let it out, or receive a property valuation, an expert can help you.
Click the button below to get started.


Price Paid in St John Street, SP1 2SB, Salisbury St Martins And Cathedral
3 St John Street, SP1 2SB, Salisbury St Martins And Cathedral Salisbury
Property 3 has been sold 3 times. The last time it was sold was in 30/09/2021 and the sold price was £550,000.00.
This is a Semi Detached House which was sold as a freehold in 30/09/2021
| Date | Price | Property Type | Tenure | Classification |
|---|---|---|---|---|
| 30/09/2021 | £550,000.00 | Semi Detached House | freehold | Established Building |
| 08/02/2019 | £420,000.00 | Semi Detached House | freehold | Established Building |
| 30/04/2004 | £315,000.00 | Semi Detached House | freehold | Established Building |
5 St John Street, SP1 2SB, Salisbury St Martins And Cathedral Salisbury
Property 5 has been sold 2 times. The last time it was sold was in 15/05/2003 and the sold price was £295,000.00.
This flat, sold as a freehold on 15/05/2003, is a 105 sqm mid-terrace house with an EPC rating of E.
| Date | Price | Property Type | Tenure | Classification |
|---|---|---|---|---|
| 15/05/2003 | £295,000.00 | Flat | freehold | Established Building |
| 30/06/2000 | £140,000.00 | Flat | freehold | Established Building |
Transport near SP1 2SB, St John Street
-
 Salisbury Station
 -
Dean Station
-
Grateley Station
-
Mottisfont and Dunbridge Station
-
Tisbury Station
-
Romsey Station
House price paid reports for SP1 2SB, St John Street
Click on the buttons below to see price paid reports by year or property price:
- Price Paid By Year
Property Price Paid in SP1 2SB, St John Street by Year
The average sold property price by year was:
| Year | Average Sold Price | Price Change |
Sold Properties
|
|---|---|---|---|
| 2021 | £550,000 | 24% |
1 Property |
| 2019 | £420,000 | 25% |
1 Property |
| 2004 | £315,000 | 6% |
1 Property |
| 2003 | £295,000 | 53% |
1 Property |
| 2000 | £140,000 | - |
1 Property |