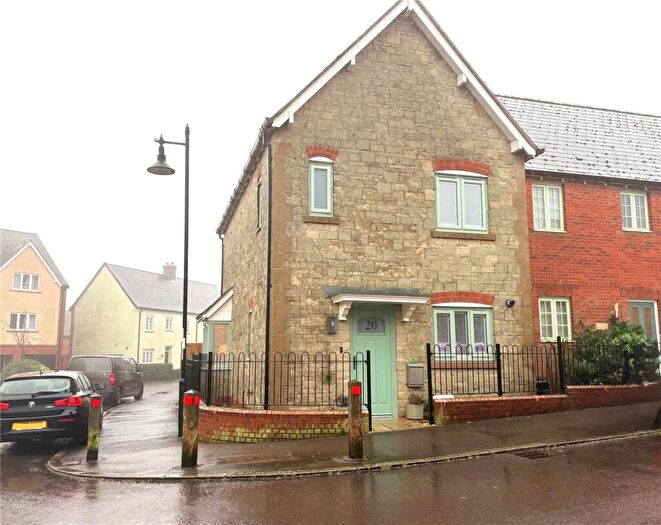
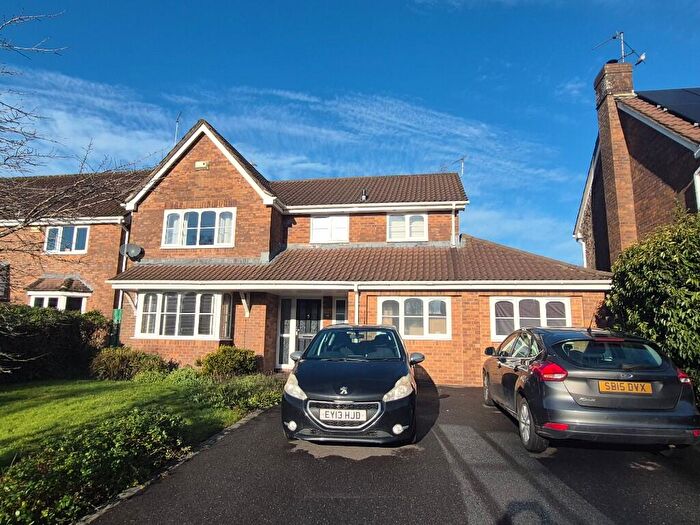
Houses for sale & to rent in Tisbury, Shaftesbury
House Prices in Tisbury
Properties in Tisbury have an average house price of £596,353.00 and had 48 Property Transactions within the last 3 years¹.
Tisbury is an area in Shaftesbury, Wiltshire with 635 households², where the most expensive property was sold for £2,350,000.00.
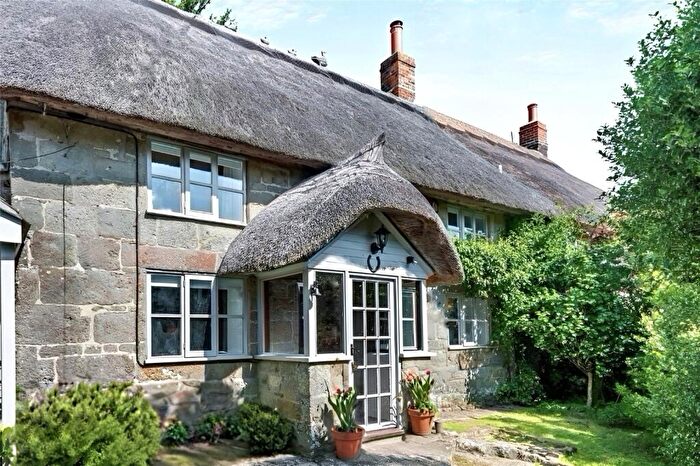
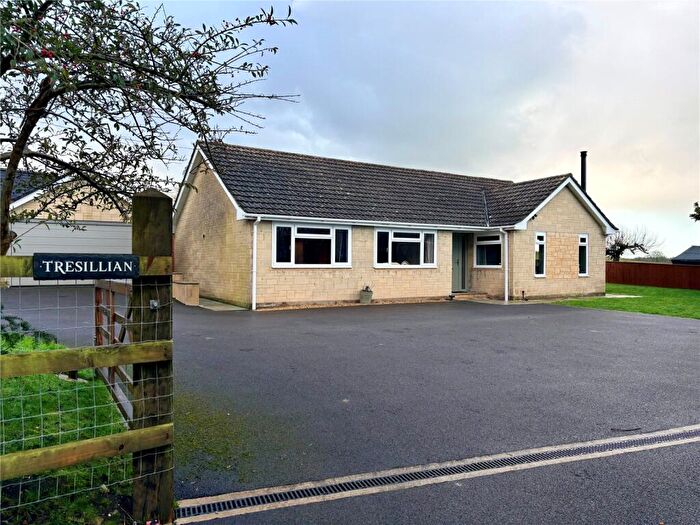
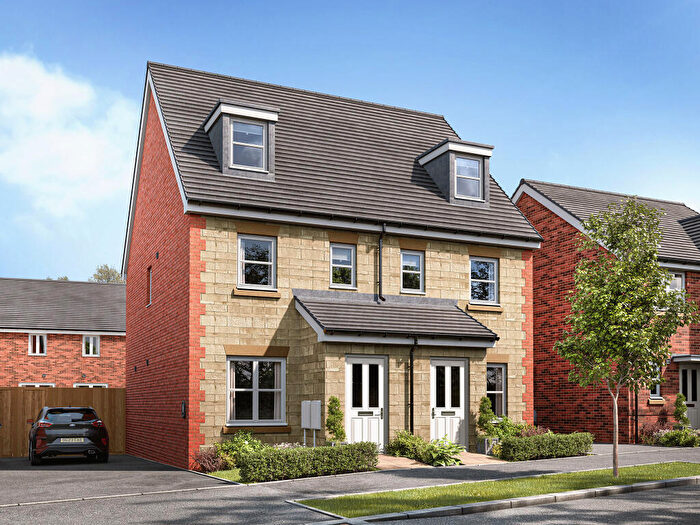
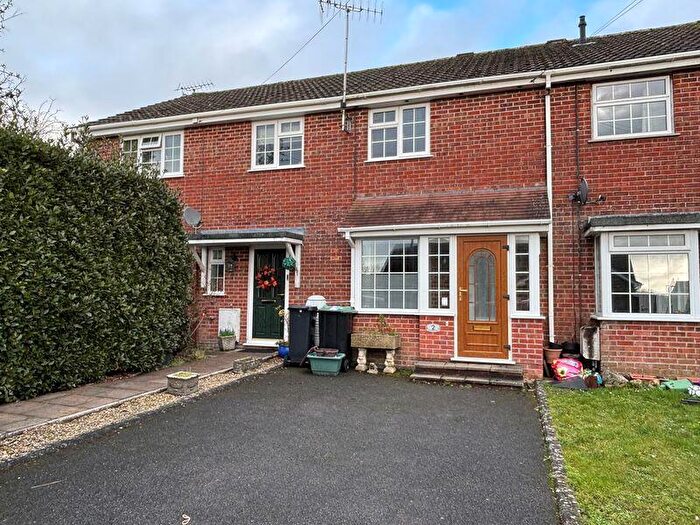
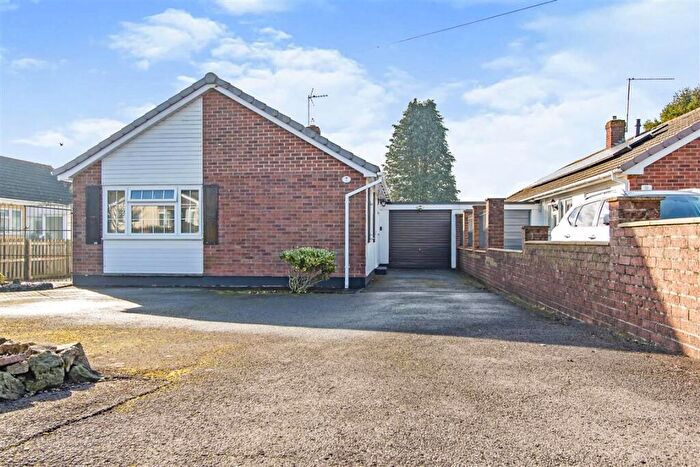
Properties for sale in Tisbury
Roads and Postcodes in Tisbury
Navigate through our locations to find the location of your next house in Tisbury, Shaftesbury for sale or to rent.
| Streets | Postcodes |
|---|---|
| Barkers Hill | SP7 9EB |
| Berrywood Lane | SP7 9DH |
| Birdbush | SP7 9HH SP7 9NH |
| Bluebell Cottages | SP7 9BB |
| Brookwater | SP7 9LG |
| Butlers Hill | SP7 9DA |
| Charlton Lane | SP7 0EL |
| Coronation Close | SP7 9NJ |
| Coronation Drive | SP7 9NA |
| Dennis Lane | SP7 0PP SP7 0PR |
| Deweys Place | SP7 9LW |
| Front Horsehill Lane | SP7 9BS |
| Gutch Common | SP7 9BD |
| Higher Berrycourt | SP7 0ER SP7 0ES |
| Higher Coombe | SP7 9LR SP7 9LS |
| Horsehill Lane | SP7 9LZ SP7 9DU |
| Horsehill Place | SP7 9EY |
| Jenkins Corner | SP7 9DD |
| Little Wincombe | SP7 9DE |
| Lower Berrycourt | SP7 9DT |
| Lower Coombe | SP7 9LY |
| Lower Street | SP7 9EE |
| Lower Wincombe Lane | SP7 9DB |
| Mampitts Lane | SP7 8QG |
| Middle Coombe | SP7 9LX |
| Milkwell | SP7 9LQ |
| Mill Cottages | SP7 9NF |
| Mill Lane | SP7 9EF |
| Mill Meadow | SP7 9EX |
| New Road | SP7 9EG |
| Old Mill View | SP7 9NL |
| Overway | SP7 9LH |
| Pains Hill | SP7 9EA |
| Parhams Hill | SP7 9NQ |
| Peckons Hill | SP7 0PN |
| Pigstrough Lane | SP7 9ED SP7 9ES |
| Rowberry Cottages | SP7 0ET |
| Salisbury Road | SP7 8BU SP7 8BX SP7 9LT |
| Sans Lane | SP7 9EJ |
| Scotts Hill | SP7 9EP |
| St Johns Close | SP7 9NB |
| Sunnybank Cottages | SP7 9DL |
| The Street | SP7 9EZ |
| Wardour Lane | SP7 9EQ |
| Watery Lane | SP7 9DF SP7 9DP |
| West End | SP7 9DY |
| Whitsans Cross | SP7 9LJ SP7 9LL |
| Wincombe Lane | SP7 8QF |
| Wincombe Park | SP7 9AB |
| SP7 0EN SP7 0EW SP7 0PL SP7 0PW SP7 9BP SP7 9BZ SP7 9DG SP7 9DJ SP7 9DN SP7 9DQ SP7 9DS SP7 9DX SP7 9DZ SP7 9EH SP7 9ER SP7 9ND SP7 9NE SP7 0EP SP7 9BW SP7 9BY SP7 9DR SP7 9DW SP7 9EL SP7 9EN SP7 9ET SP7 9EW SP7 9LP |
Transport near Tisbury
-
Tisbury Station
-
Gillingham (Dorset) Station
-
Templecombe Station
-
Warminster Station
-
Salisbury Station
- FAQ
- Price Paid By Year
- Property Type Price
Frequently asked questions about Tisbury
What is the average price for a property for sale in Tisbury?
The average price for a property for sale in Tisbury is £596,353. This amount is 1% higher than the average price in Shaftesbury. There are 1,076 property listings for sale in Tisbury.
What streets have the most expensive properties for sale in Tisbury?
The streets with the most expensive properties for sale in Tisbury are Middle Coombe at an average of £1,622,500, Scotts Hill at an average of £1,150,000 and Higher Coombe at an average of £1,000,000.
What streets have the most affordable properties for sale in Tisbury?
The streets with the most affordable properties for sale in Tisbury are Coronation Drive at an average of £205,000, Horsehill Place at an average of £270,000 and Mill Cottages at an average of £375,000.
Which train stations are available in or near Tisbury?
Some of the train stations available in or near Tisbury are Tisbury, Gillingham (Dorset) and Templecombe.
Property Price Paid in Tisbury by Year
The average sold property price by year was:
| Year | Average Sold Price | Price Change |
Sold Properties
|
|---|---|---|---|
| 2025 | £595,625 | -1% |
12 Properties |
| 2024 | £600,959 | 2% |
21 Properties |
| 2023 | £590,486 | -30% |
15 Properties |
| 2022 | £765,904 | 22% |
23 Properties |
| 2021 | £593,793 | 5% |
29 Properties |
| 2020 | £562,309 | -0,1% |
21 Properties |
| 2019 | £562,725 | 34% |
20 Properties |
| 2018 | £372,384 | -49% |
26 Properties |
| 2017 | £556,585 | 13% |
17 Properties |
| 2016 | £483,062 | 15% |
24 Properties |
| 2015 | £411,074 | -1% |
27 Properties |
| 2014 | £415,943 | -21% |
29 Properties |
| 2013 | £502,526 | 25% |
17 Properties |
| 2012 | £375,745 | 6% |
10 Properties |
| 2011 | £352,240 | -32% |
11 Properties |
| 2010 | £466,437 | 9% |
16 Properties |
| 2009 | £422,581 | 35% |
24 Properties |
| 2008 | £273,125 | -60% |
12 Properties |
| 2007 | £436,915 | 10% |
28 Properties |
| 2006 | £395,115 | -10% |
26 Properties |
| 2005 | £433,258 | 20% |
25 Properties |
| 2004 | £348,602 | 1% |
17 Properties |
| 2003 | £346,717 | 45% |
23 Properties |
| 2002 | £189,739 | -27% |
24 Properties |
| 2001 | £240,668 | 2% |
25 Properties |
| 2000 | £235,477 | 34% |
29 Properties |
| 1999 | £155,893 | -30% |
29 Properties |
| 1998 | £203,074 | 34% |
21 Properties |
| 1997 | £134,313 | 13% |
36 Properties |
| 1996 | £117,368 | 14% |
31 Properties |
| 1995 | £100,562 | - |
24 Properties |
Property Price per Property Type in Tisbury
Here you can find historic sold price data in order to help with your property search.
The average Property Paid Price for specific property types in the last three years are:
| Property Type | Average Sold Price | Sold Properties |
|---|---|---|
| Semi Detached House | £378,125.00 | 8 Semi Detached Houses |
| Detached House | £665,850.00 | 37 Detached Houses |
| Flat | £438,500.00 | 1 Flat |
| Terraced House | £262,500.00 | 2 Terraced Houses |

