Houses for sale & to rent in Shaftesbury Underhill, Shaftesbury
House Prices in Shaftesbury Underhill
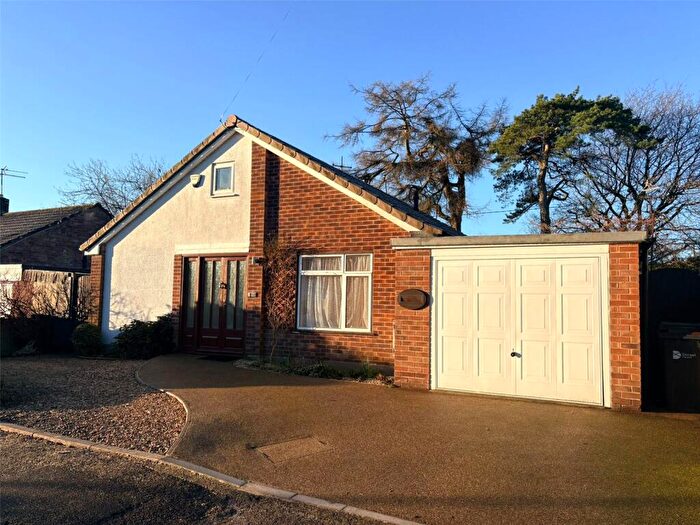
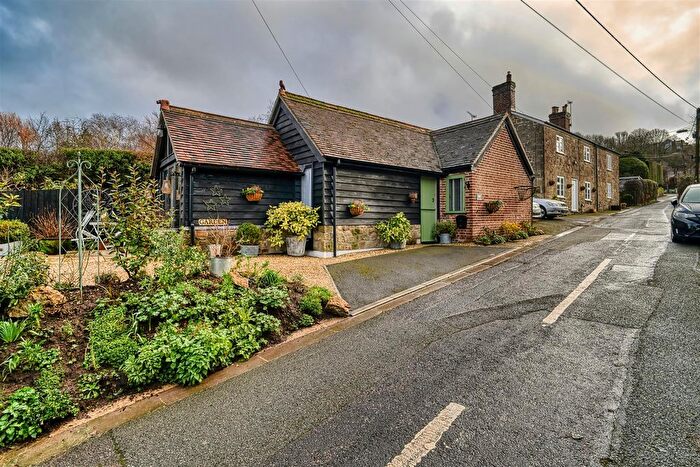
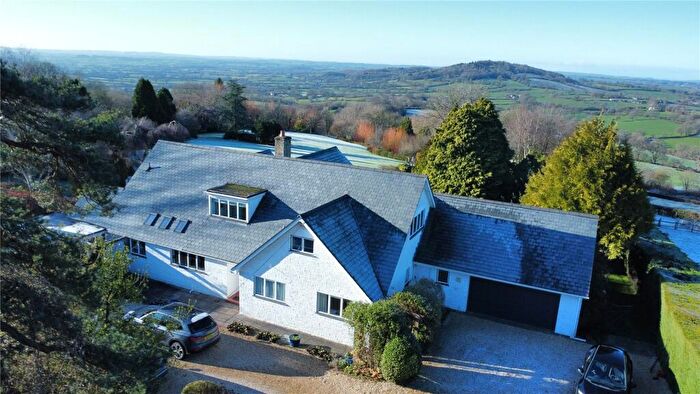
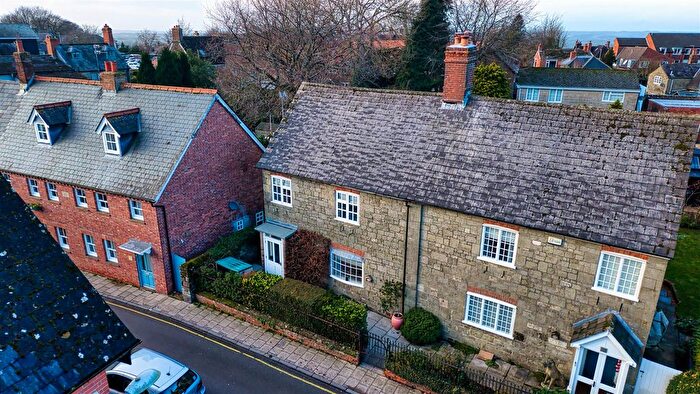
Properties in Shaftesbury Underhill have an average house price of £414,422.00 and had 77 Property Transactions within the last 3 years¹.
Shaftesbury Underhill is an area in Shaftesbury, Dorset with 693 households², where the most expensive property was sold for £1,200,000.00.
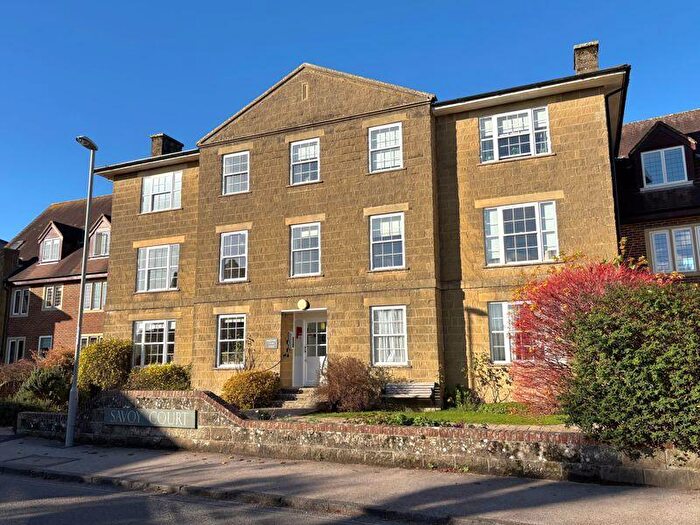
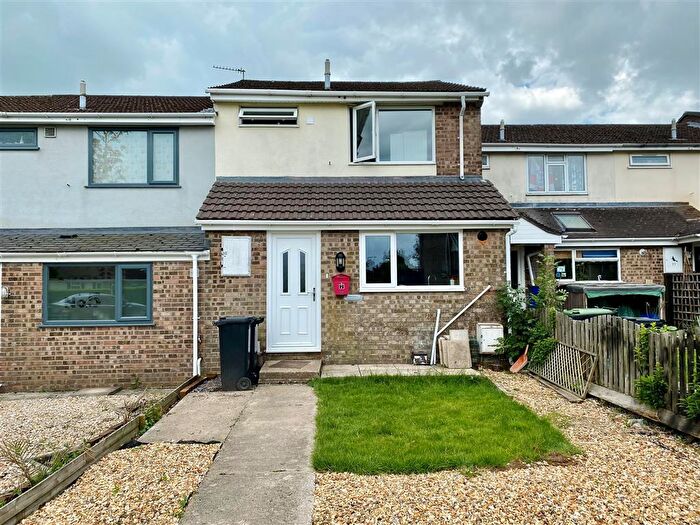
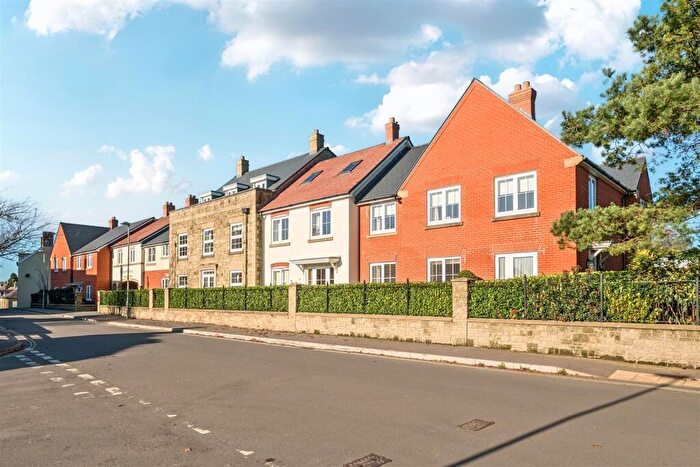
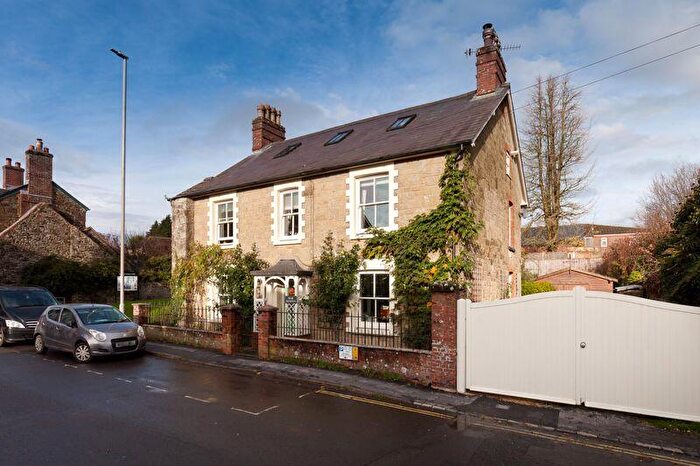
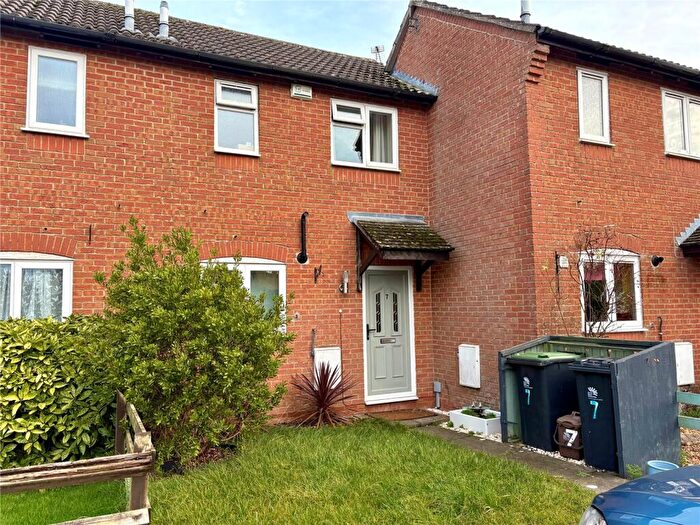
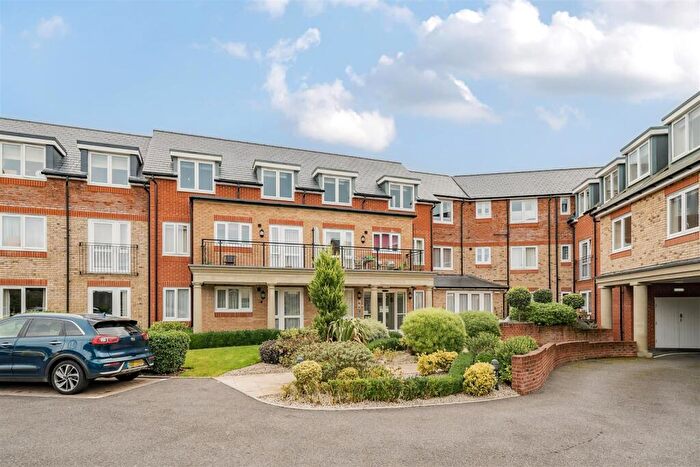
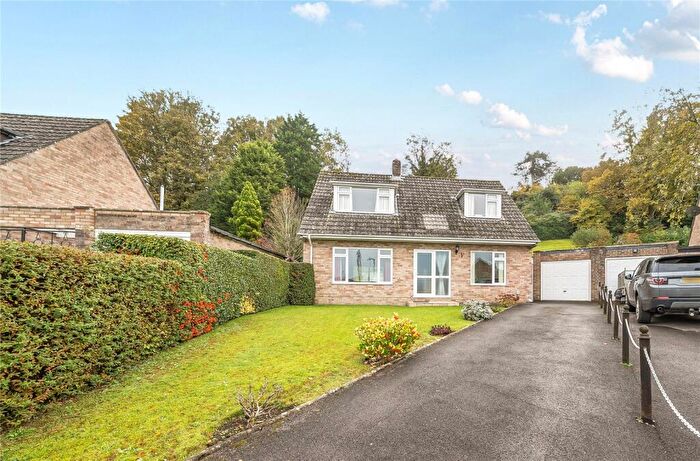
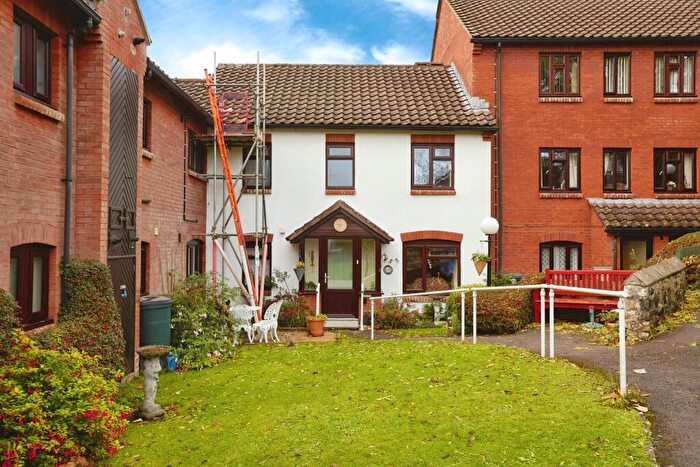
Properties for sale in Shaftesbury Underhill
Roads and Postcodes in Shaftesbury Underhill
Navigate through our locations to find the location of your next house in Shaftesbury Underhill, Shaftesbury for sale or to rent.
| Streets | Postcodes |
|---|---|
| Boyne Mead | SP7 8HT SP7 8NX |
| Breach Lane | SP7 8LD SP7 8LE SP7 8LF |
| Brinscombe Lane | SP7 8QU |
| Butts Knapp | SP7 8NW |
| Butts Mead | SP7 8NS |
| Byzant Court | SP7 8FH |
| Castle Gardens | SP7 8GG |
| Castle Hill Close | SP7 8LQ |
| Church Hill | SP7 8LL SP7 8QR |
| Fountain Court | SP7 8NB |
| French Mill Lane | SP7 0LT SP7 8EU |
| French Mill Rise | SP7 8HS |
| Gold Hill | SP7 8HB SP7 8JW |
| Great Lane | SP7 8ET |
| Hawkesdene | SP7 8NT |
| Hawkesdene Lane | SP7 8EX SP7 8NU |
| Horseponds | SP7 8LJ |
| Kings Hill | SP7 8PA |
| Kingsman Lane | SP7 8HD |
| Laundry Lane | SP7 8HP |
| Layton Lane | SP7 8EY |
| Long Cross | SP7 8QP |
| Lower Blandford Road | SP7 8NR |
| Motcombe Road | SP7 8QJ |
| Nettlebed Nursery | SP7 8QS |
| New Road | SP7 8QH SP7 8QL SP7 8QW |
| Old Lower Blandford Road | SP7 8GA |
| Raspberry Lane | SP7 8HN |
| Ratcliffs Garden | SP7 8HJ |
| Salisbury Street | SP7 8EL |
| Sally Kings Lane | SP7 8LS |
| Shooters Lane | SP7 8EZ |
| Shooters Paddock | SP7 8AB |
| St James Street | SP7 8HA SP7 8HE SP7 8HF SP7 8HL SP7 8HQ |
| St Johns Hill | SP7 8HG SP7 8LA |
| Tanyard Lane | SP7 8HW |
| The Bartons | SP7 8LN |
| The Knapp | SP7 8LH SP7 8LT |
| The Tynings | SP7 8QX |
| Tout Hill | SP7 8LX |
| Umbers Hill | SP7 8LB |
| Well Lane | SP7 8LP SP7 8LW |
| White Hart Lane | SP7 8HH |
| Yeatmans Close | SP7 8LU |
| Yeatmans Lane | SP7 8LR |
| SP7 0NA |
Transport near Shaftesbury Underhill
- FAQ
- Price Paid By Year
- Property Type Price
Frequently asked questions about Shaftesbury Underhill
What is the average price for a property for sale in Shaftesbury Underhill?
The average price for a property for sale in Shaftesbury Underhill is £414,422. This amount is 21% higher than the average price in Shaftesbury. There are 630 property listings for sale in Shaftesbury Underhill.
What streets have the most expensive properties for sale in Shaftesbury Underhill?
The streets with the most expensive properties for sale in Shaftesbury Underhill are Raspberry Lane at an average of £990,000, Breach Lane at an average of £825,000 and Brinscombe Lane at an average of £800,000.
What streets have the most affordable properties for sale in Shaftesbury Underhill?
The streets with the most affordable properties for sale in Shaftesbury Underhill are The Bartons at an average of £175,500, Butts Knapp at an average of £227,666 and Old Lower Blandford Road at an average of £233,500.
Which train stations are available in or near Shaftesbury Underhill?
Some of the train stations available in or near Shaftesbury Underhill are Gillingham (Dorset), Tisbury and Templecombe.
Property Price Paid in Shaftesbury Underhill by Year
The average sold property price by year was:
| Year | Average Sold Price | Price Change |
Sold Properties
|
|---|---|---|---|
| 2025 | £419,357 | 3% |
19 Properties |
| 2024 | £407,382 | -3% |
29 Properties |
| 2023 | £418,227 | -8% |
29 Properties |
| 2022 | £449,743 | 8% |
37 Properties |
| 2021 | £414,565 | -11% |
38 Properties |
| 2020 | £460,574 | 34% |
32 Properties |
| 2019 | £306,000 | -22% |
21 Properties |
| 2018 | £372,114 | -8% |
39 Properties |
| 2017 | £400,614 | 24% |
35 Properties |
| 2016 | £303,874 | -8% |
37 Properties |
| 2015 | £327,950 | 15% |
40 Properties |
| 2014 | £278,239 | -19% |
54 Properties |
| 2013 | £330,291 | -30% |
36 Properties |
| 2012 | £427,761 | 30% |
21 Properties |
| 2011 | £297,860 | 21% |
25 Properties |
| 2010 | £236,580 | -21% |
25 Properties |
| 2009 | £285,566 | 2% |
30 Properties |
| 2008 | £280,483 | -22% |
30 Properties |
| 2007 | £342,513 | 31% |
36 Properties |
| 2006 | £237,576 | -9% |
48 Properties |
| 2005 | £260,033 | 2% |
34 Properties |
| 2004 | £254,350 | 24% |
36 Properties |
| 2003 | £194,173 | -3% |
53 Properties |
| 2002 | £199,293 | 4% |
49 Properties |
| 2001 | £191,130 | 29% |
49 Properties |
| 2000 | £135,968 | 7% |
38 Properties |
| 1999 | £127,066 | 10% |
43 Properties |
| 1998 | £114,877 | 11% |
28 Properties |
| 1997 | £102,767 | 20% |
29 Properties |
| 1996 | £81,967 | 15% |
44 Properties |
| 1995 | £69,977 | - |
29 Properties |
Property Price per Property Type in Shaftesbury Underhill
Here you can find historic sold price data in order to help with your property search.
The average Property Paid Price for specific property types in the last three years are:
| Property Type | Average Sold Price | Sold Properties |
|---|---|---|
| Semi Detached House | £391,806.00 | 15 Semi Detached Houses |
| Detached House | £540,415.00 | 32 Detached Houses |
| Terraced House | £292,820.00 | 25 Terraced Houses |
| Flat | £283,920.00 | 5 Flats |

