
Houses for sale & to rent in Westbury, Wiltshire
House Prices in Westbury
Properties in Westbury have an average house price of £288k and had 1,045 Property Transactions within the last 3 years.¹
Westbury is an area in Wiltshire with 8,477 households², where the most expensive property was sold for £1.45M.
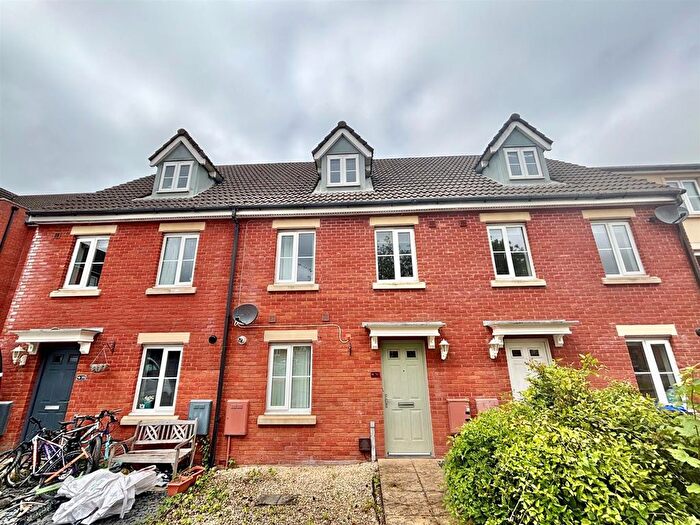
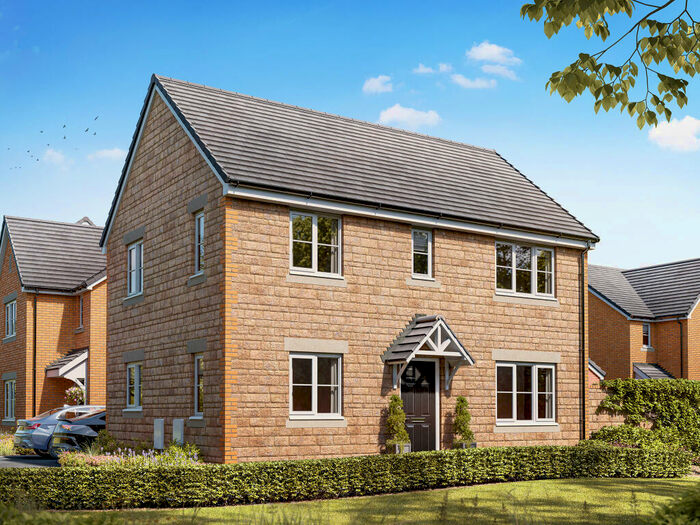
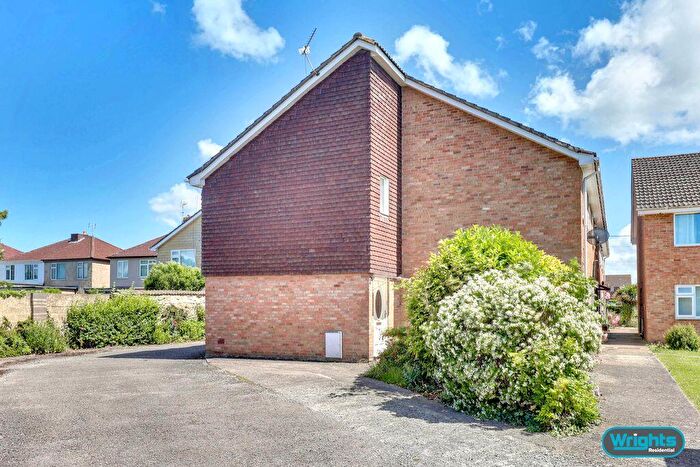
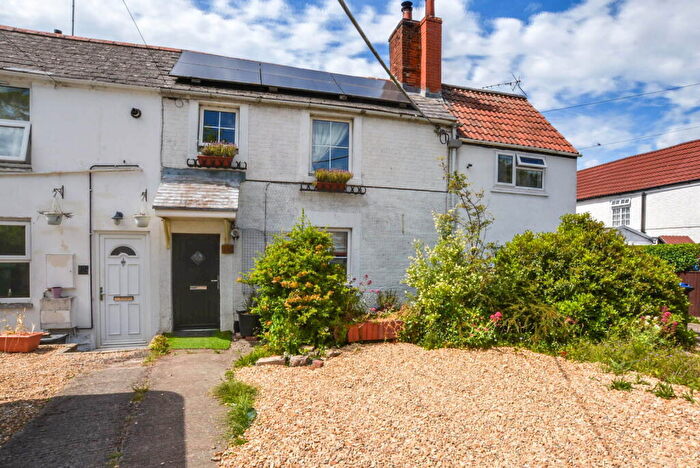
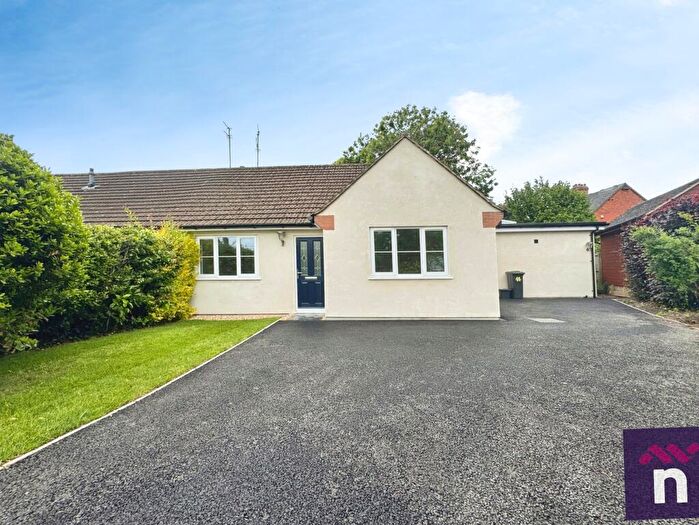
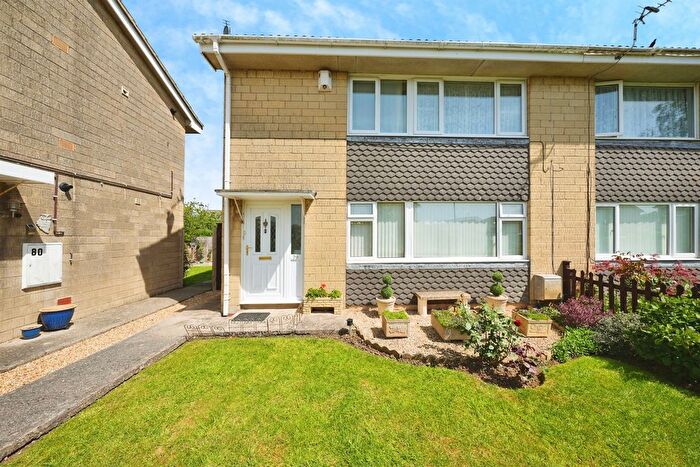
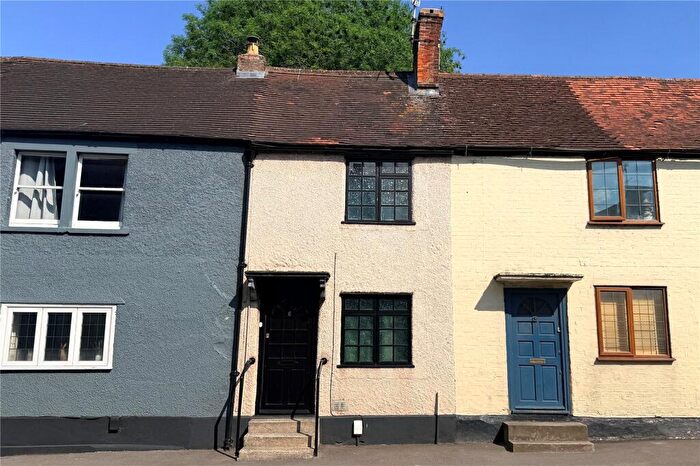
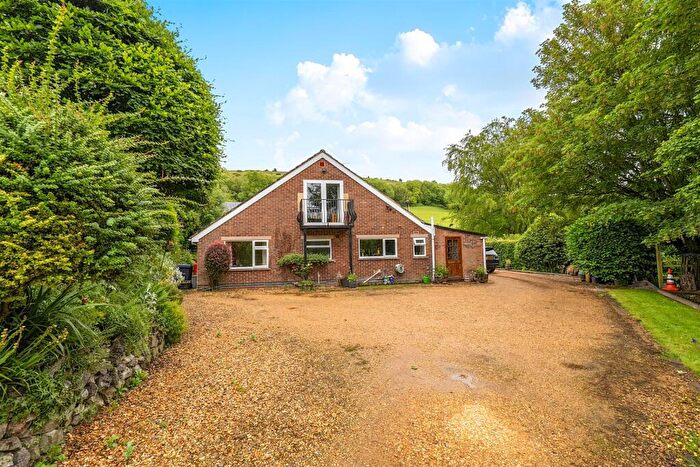
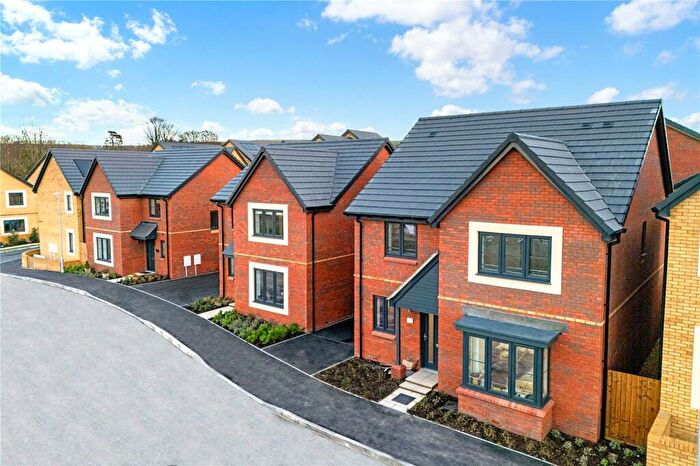
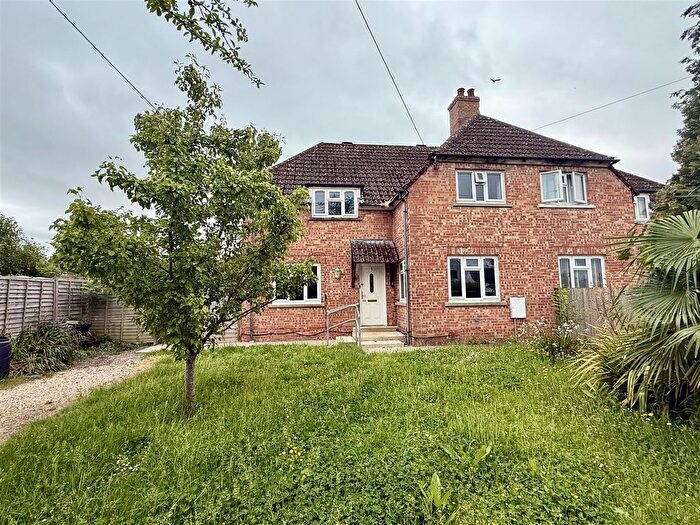
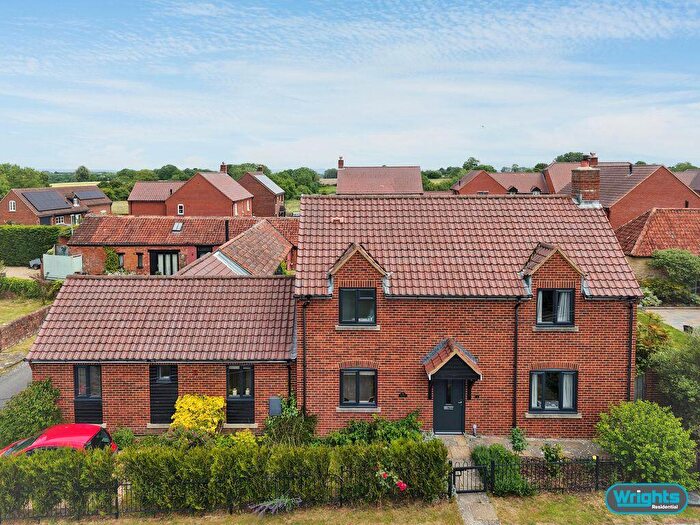
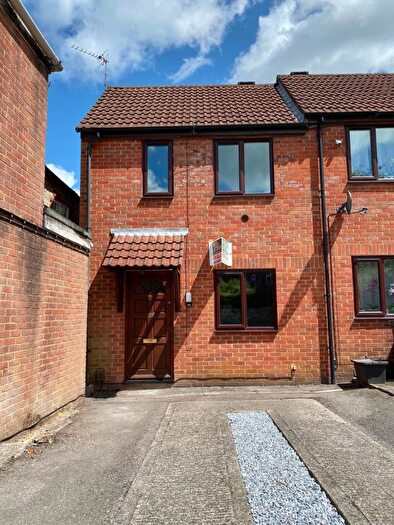
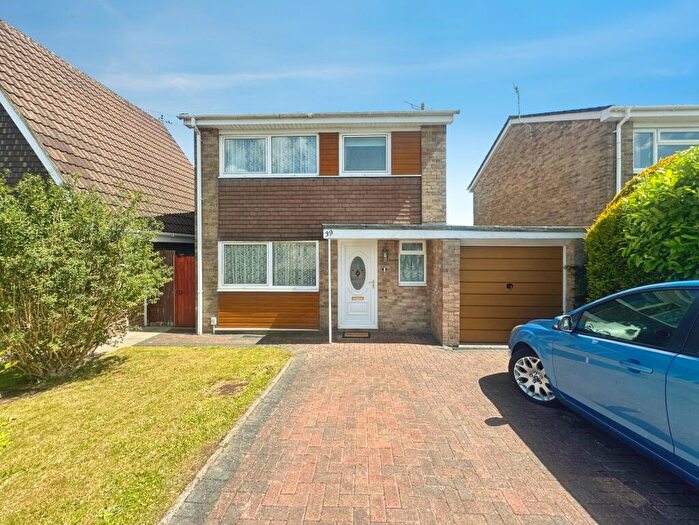
Properties for sale in Westbury
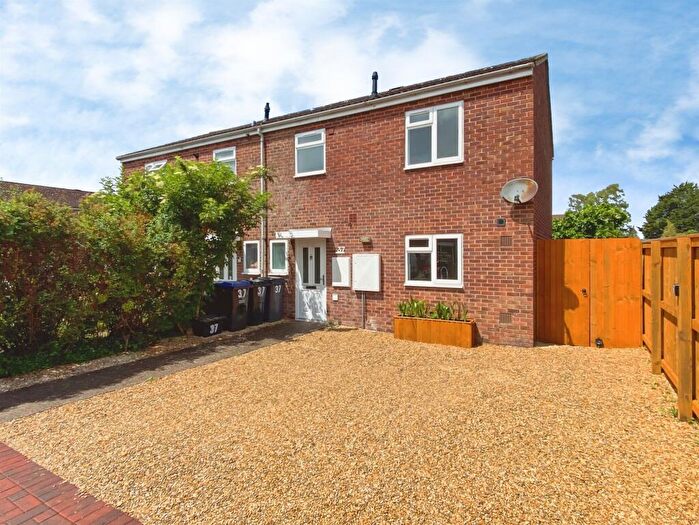
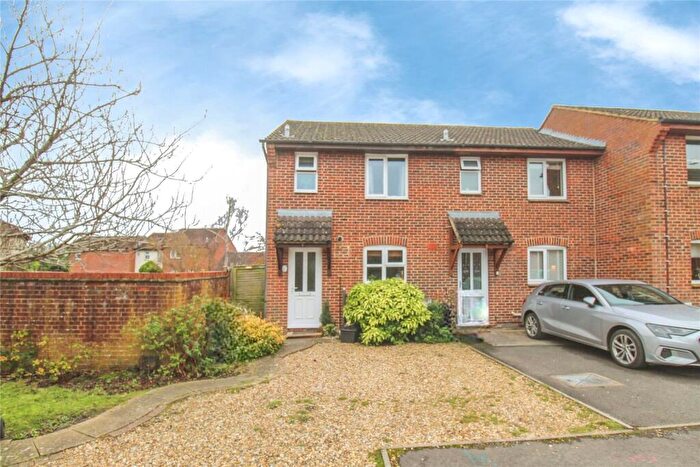
![]()
If you are looking to sell your house, let it out, or receive a property valuation, an expert can help you.
Click the button below to get started.
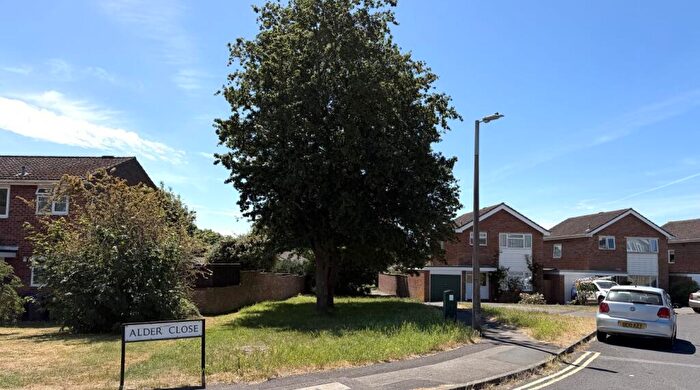
Neighbourhoods in Westbury
Navigate through our locations to find the location of your next house in Westbury, Wiltshire for sale or to rent.
Transport in Westbury
Please see below transportation links in this area:

- FAQ
- Price Paid By Year
- Property Type Price
Frequently asked questions about Westbury
What is the average price for a property for sale in Westbury?
The average price for a property for sale in Westbury is £288,369. This amount is 21% lower than the average price in Wiltshire. There are 7,751 property listings for sale in Westbury.
What locations have the most expensive properties for sale in Westbury?
The locations with the most expensive properties for sale in Westbury are Southwick at an average of £521,666, Warminster Without at an average of £460,532 and Ethandune at an average of £396,706.
What locations have the most affordable properties for sale in Westbury?
The locations with the most affordable properties for sale in Westbury are Westbury North at an average of £257,127, Westbury East at an average of £262,886 and Westbury West at an average of £272,355.
Which train stations are available in or near Westbury?
Some of the train stations available in or near Westbury are Westbury, Dilton Marsh and Warminster.
Property Price Paid in Westbury by Year
The average sold property price by year was:
| Year | Average Sold Price | Price Change |
Sold Properties
|
|---|---|---|---|
| 2026 | £263,250 | -10% |
34 Properties |
| 2025 | £289,298 | 4% |
314 Properties |
| 2024 | £276,978 | -10% |
383 Properties |
| 2023 | £304,054 | 1% |
314 Properties |
| 2022 | £301,408 | 3% |
412 Properties |
| 2021 | £293,588 | 8% |
588 Properties |
| 2020 | £270,628 | 5% |
363 Properties |
| 2019 | £255,846 | 2% |
468 Properties |
| 2018 | £250,002 | 5% |
445 Properties |
| 2017 | £237,420 | 2% |
453 Properties |
| 2016 | £233,539 | 9% |
478 Properties |
| 2015 | £211,773 | 8% |
512 Properties |
| 2014 | £195,599 | 7% |
421 Properties |
| 2013 | £182,113 | -1% |
344 Properties |
| 2012 | £183,477 | -1% |
290 Properties |
| 2011 | £185,837 | -4% |
298 Properties |
| 2010 | £193,643 | 10% |
304 Properties |
| 2009 | £174,706 | -9% |
333 Properties |
| 2008 | £189,694 | 6% |
364 Properties |
| 2007 | £178,528 | 2% |
629 Properties |
| 2006 | £175,587 | 3% |
684 Properties |
| 2005 | £170,042 | -1% |
559 Properties |
| 2004 | £171,292 | 13% |
648 Properties |
| 2003 | £149,527 | 19% |
776 Properties |
| 2002 | £120,936 | 17% |
792 Properties |
| 2001 | £100,625 | 7% |
642 Properties |
| 2000 | £93,822 | 19% |
615 Properties |
| 1999 | £76,353 | 9% |
623 Properties |
| 1998 | £69,222 | 8% |
505 Properties |
| 1997 | £63,770 | 7% |
490 Properties |
| 1996 | £59,485 | 0,3% |
429 Properties |
| 1995 | £59,293 | - |
333 Properties |
Property Price per Property Type in Westbury
Here you can find historic sold price data in order to help with your property search.
The average Property Paid Price for specific property types in the last three years are:
| Property Type | Average Sold Price | Sold Properties |
|---|---|---|
| Semi Detached House | £269,169.00 | 307 Semi Detached Houses |
| Detached House | £407,143.00 | 329 Detached Houses |
| Terraced House | £233,654.00 | 300 Terraced Houses |
| Flat | £134,535.00 | 109 Flats |