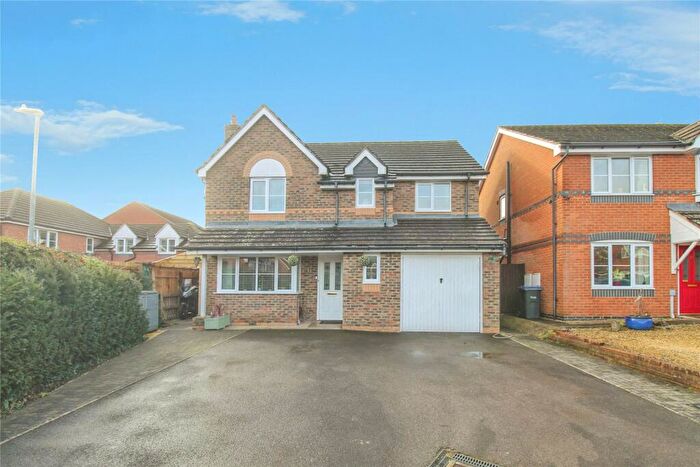
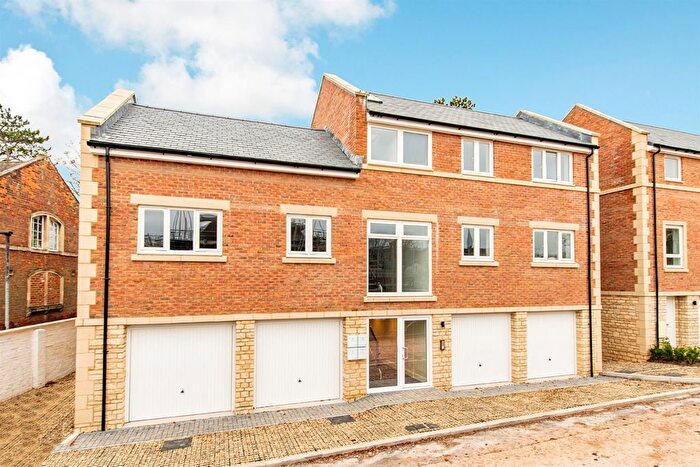
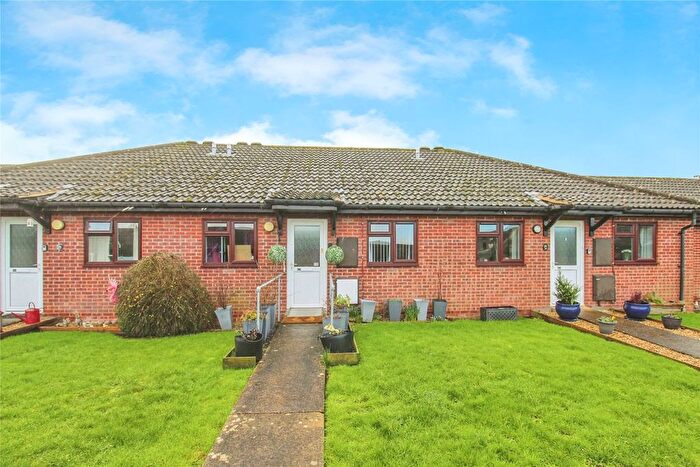
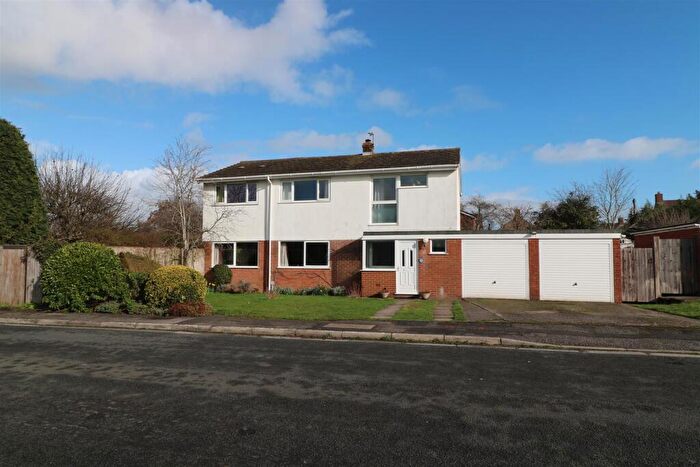
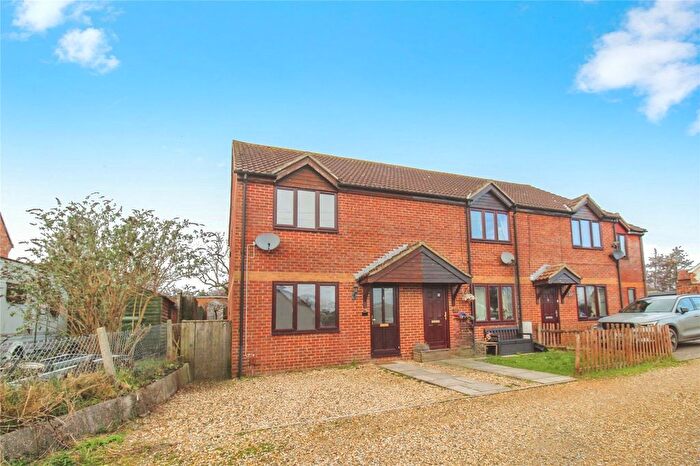
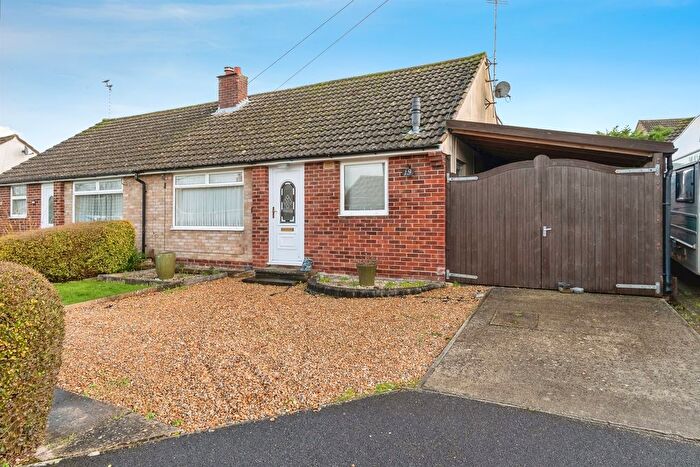
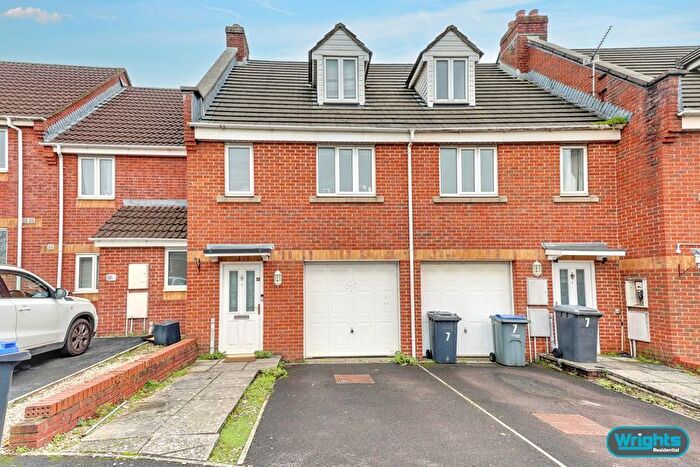
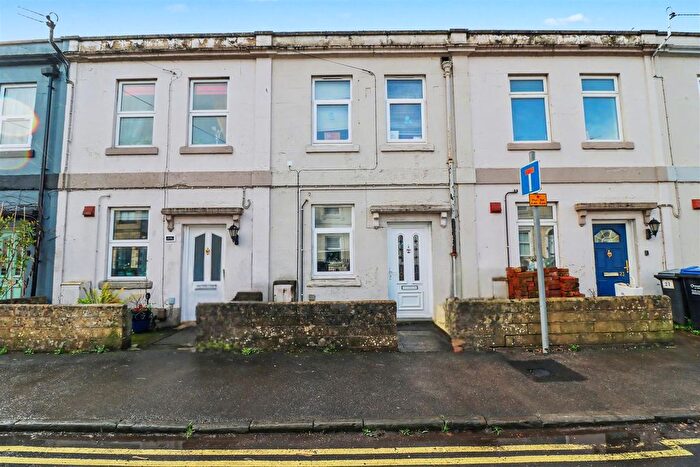
Houses for sale & to rent in Trowbridge, Wiltshire
House Prices in Trowbridge
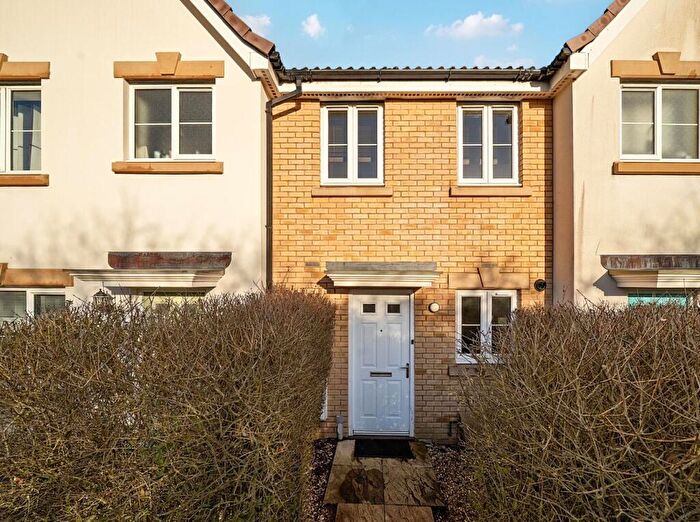
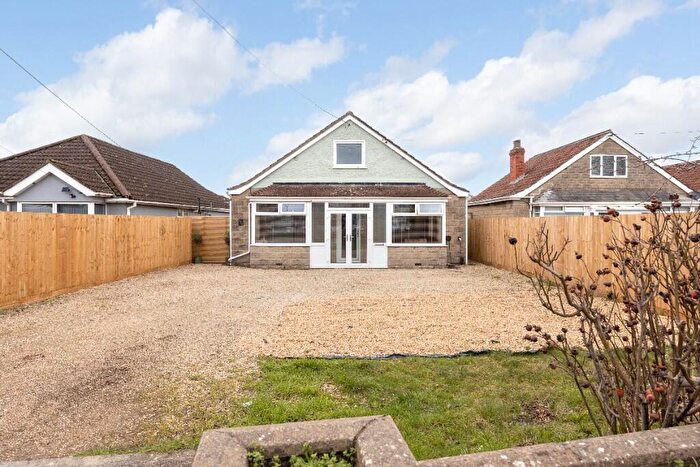
Properties in Trowbridge have an average house price of £296,844.00 and had 2,173 Property Transactions within the last 3 years.¹
Trowbridge is an area in Wiltshire with 20,027 households², where the most expensive property was sold for £1,500,000.00.
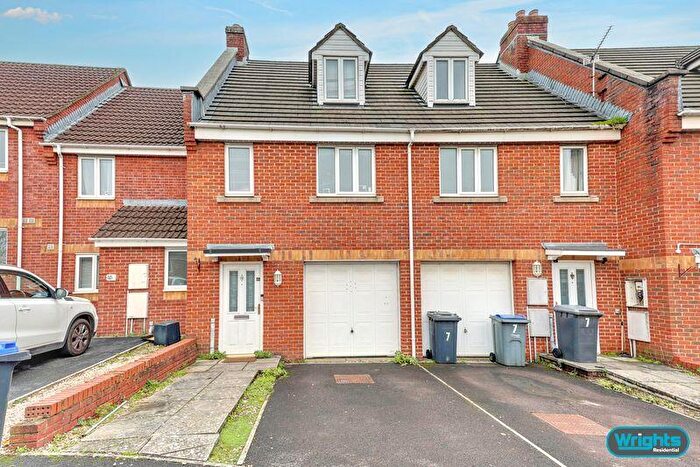
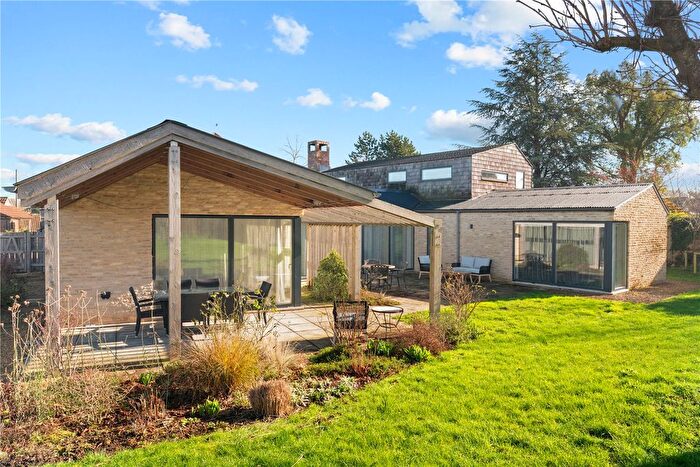
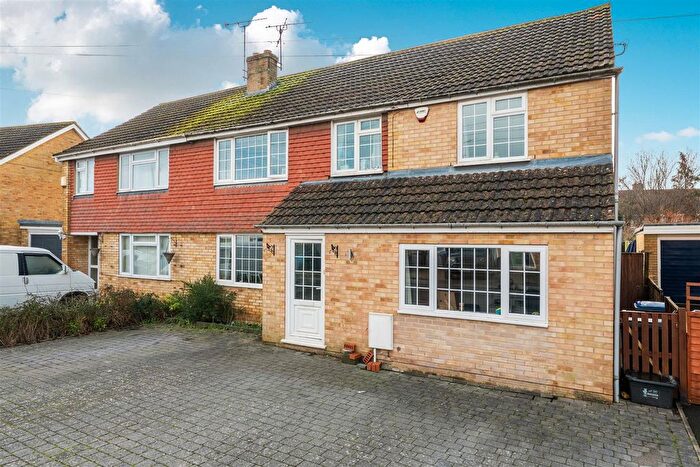
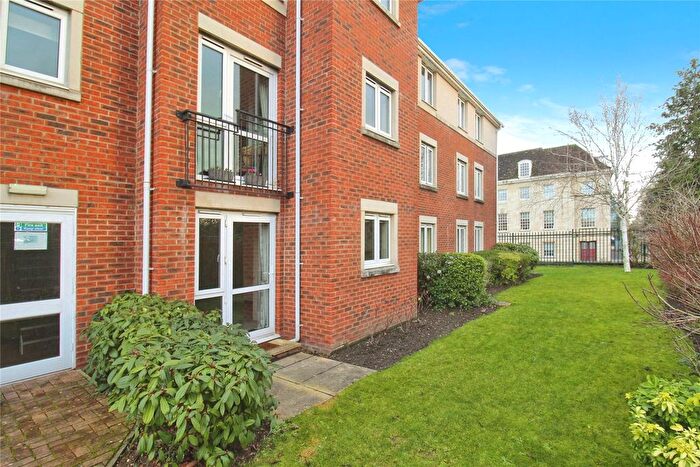
Properties for sale in Trowbridge
Neighbourhoods in Trowbridge
Navigate through our locations to find the location of your next house in Trowbridge, Wiltshire for sale or to rent.
Transport in Trowbridge
Please see below transportation links in this area:
-
Trowbridge Station
-
Bradford-On-Avon Station
-
Westbury Station
-
Avoncliff Station
-
Freshford Station
-
Dilton Marsh Station
-
Melksham Station
- FAQ
- Price Paid By Year
- Property Type Price
Frequently asked questions about Trowbridge
What is the average price for a property for sale in Trowbridge?
The average price for a property for sale in Trowbridge is £296,844. This amount is 19% lower than the average price in Wiltshire. There are more than 10,000 property listings for sale in Trowbridge.
What locations have the most expensive properties for sale in Trowbridge?
The locations with the most expensive properties for sale in Trowbridge are Winsley And Westwood at an average of £694,500, Ethandune at an average of £545,000 and Summerham And Seend at an average of £467,649.
What locations have the most affordable properties for sale in Trowbridge?
The locations with the most affordable properties for sale in Trowbridge are Trowbridge Central at an average of £204,903, Trowbridge Adcroft at an average of £245,430 and Trowbridge Park at an average of £260,481.
Which train stations are available in or near Trowbridge?
Some of the train stations available in or near Trowbridge are Trowbridge, Bradford-On-Avon and Westbury.
Property Price Paid in Trowbridge by Year
The average sold property price by year was:
| Year | Average Sold Price | Price Change |
Sold Properties
|
|---|---|---|---|
| 2025 | £302,983 | 4% |
712 Properties |
| 2024 | £292,091 | -1% |
754 Properties |
| 2023 | £295,730 | -6% |
707 Properties |
| 2022 | £313,547 | 8% |
815 Properties |
| 2021 | £287,533 | 10% |
1,086 Properties |
| 2020 | £260,201 | 3% |
751 Properties |
| 2019 | £252,373 | -0,2% |
877 Properties |
| 2018 | £252,781 | 4% |
1,001 Properties |
| 2017 | £243,346 | 4% |
977 Properties |
| 2016 | £232,540 | 9% |
1,159 Properties |
| 2015 | £211,237 | 7% |
1,167 Properties |
| 2014 | £195,935 | 5% |
1,120 Properties |
| 2013 | £185,923 | 1% |
944 Properties |
| 2012 | £183,937 | 1% |
706 Properties |
| 2011 | £181,748 | -7% |
650 Properties |
| 2010 | £194,821 | 7% |
689 Properties |
| 2009 | £181,157 | -5% |
733 Properties |
| 2008 | £189,538 | 0,2% |
729 Properties |
| 2007 | £189,084 | 4% |
1,302 Properties |
| 2006 | £182,316 | 8% |
1,403 Properties |
| 2005 | £167,893 | 1% |
1,132 Properties |
| 2004 | £165,909 | 13% |
1,317 Properties |
| 2003 | £145,121 | 7% |
1,189 Properties |
| 2002 | £135,600 | 16% |
1,352 Properties |
| 2001 | £114,127 | 10% |
1,522 Properties |
| 2000 | £102,531 | 16% |
1,421 Properties |
| 1999 | £86,495 | 16% |
1,437 Properties |
| 1998 | £72,258 | 6% |
1,031 Properties |
| 1997 | £68,017 | 3% |
1,063 Properties |
| 1996 | £65,805 | 9% |
882 Properties |
| 1995 | £60,008 | - |
764 Properties |
Property Price per Property Type in Trowbridge
Here you can find historic sold price data in order to help with your property search.
The average Property Paid Price for specific property types in the last three years are:
| Property Type | Average Sold Price | Sold Properties |
|---|---|---|
| Semi Detached House | £293,249.00 | 621 Semi Detached Houses |
| Terraced House | £238,610.00 | 626 Terraced Houses |
| Detached House | £420,040.00 | 655 Detached Houses |
| Flat | £141,838.00 | 271 Flats |

