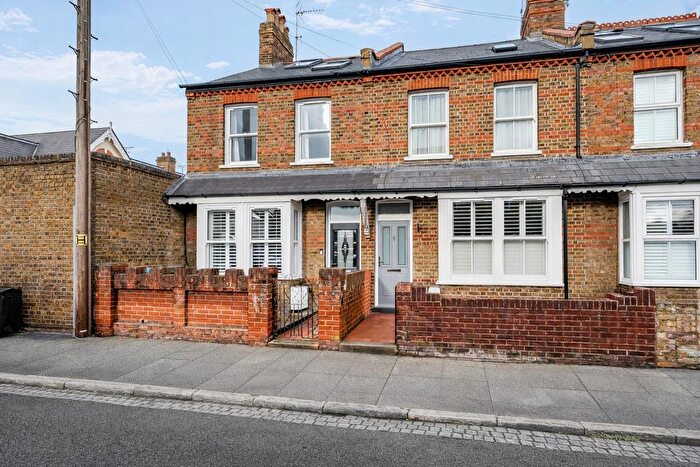
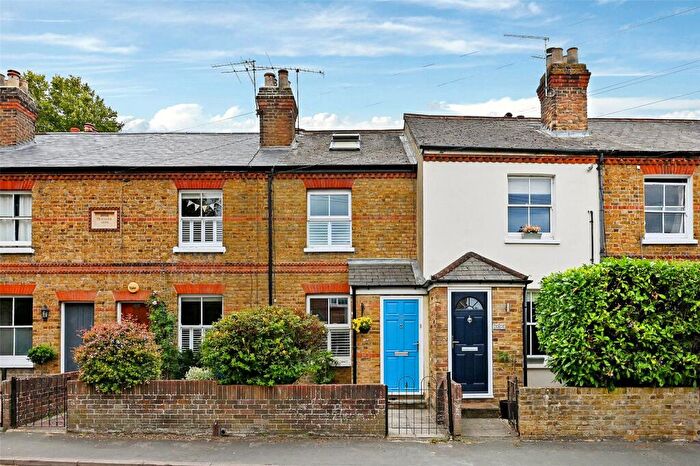
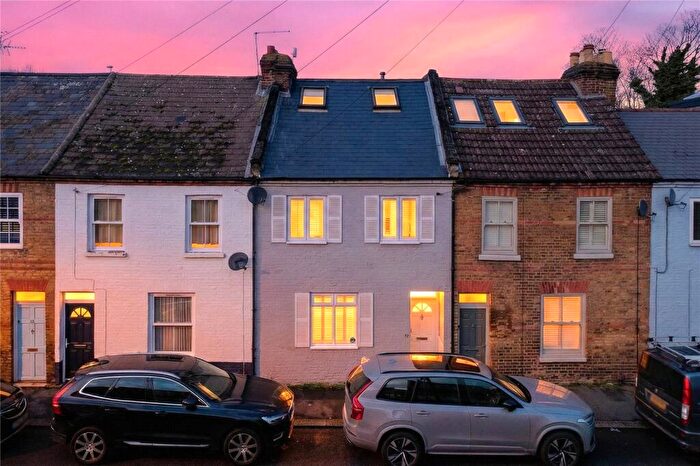
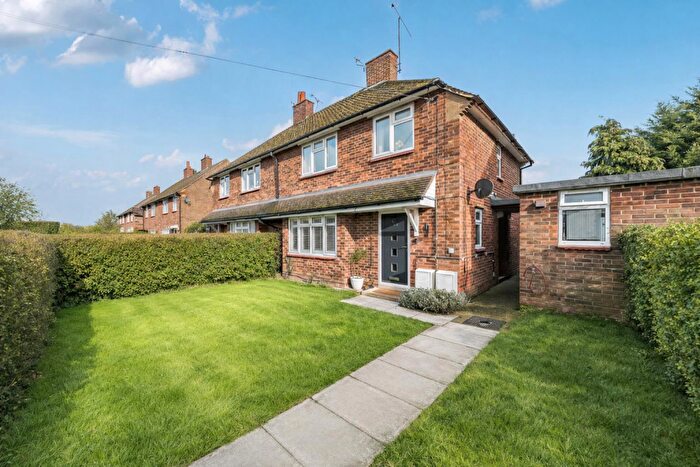
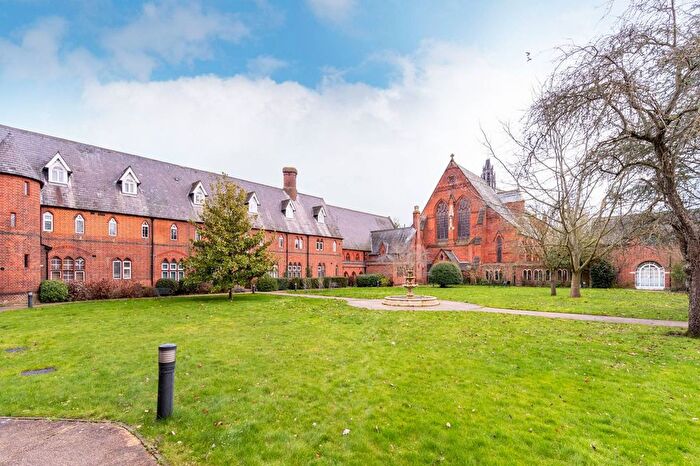
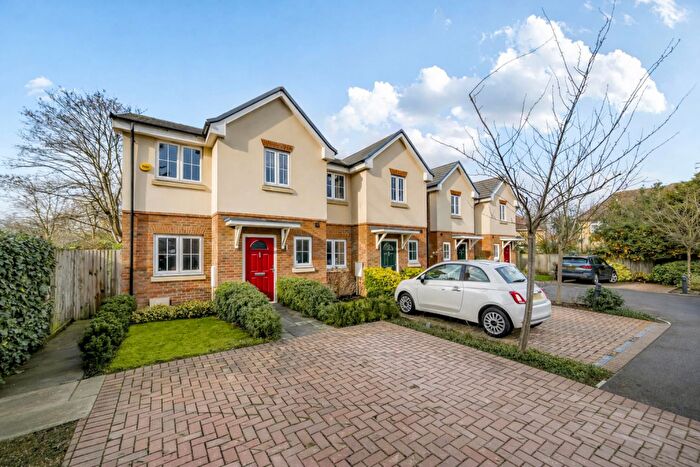
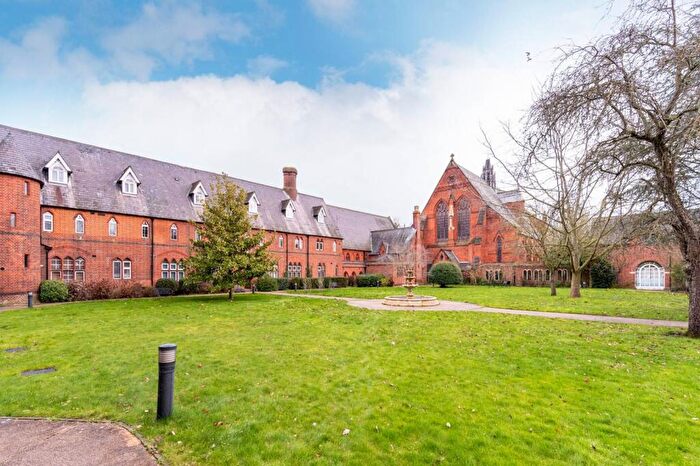
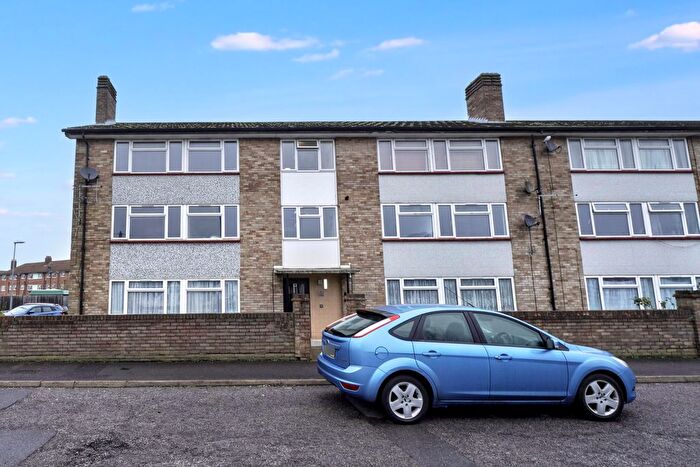
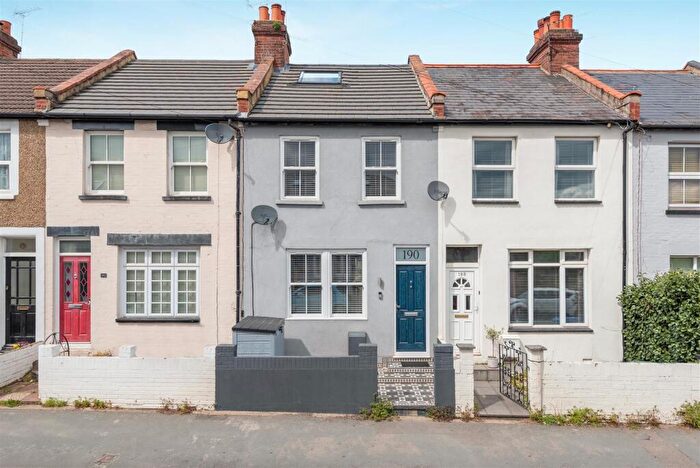
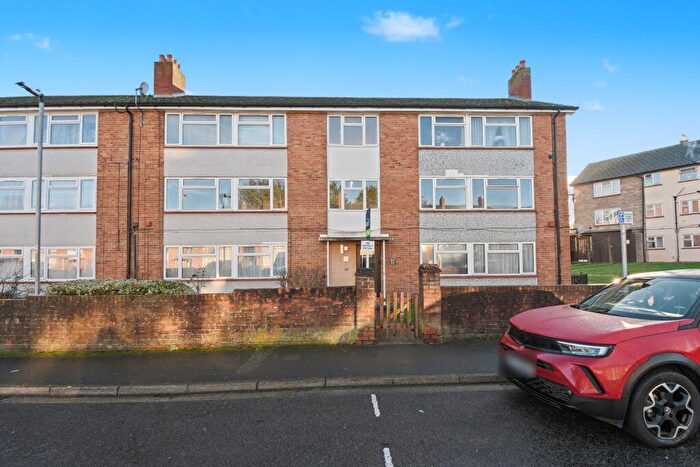
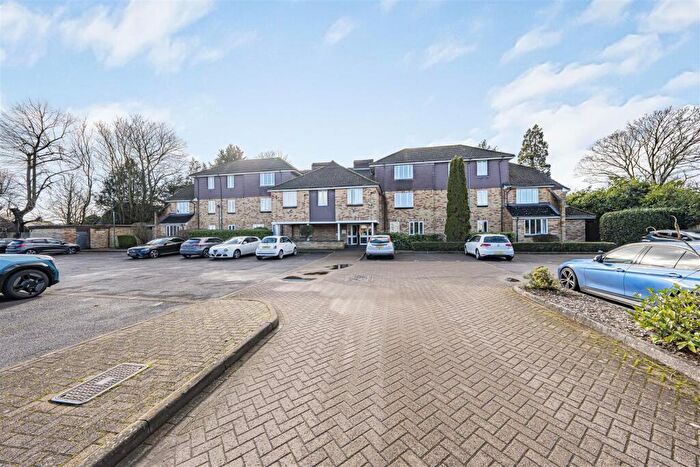
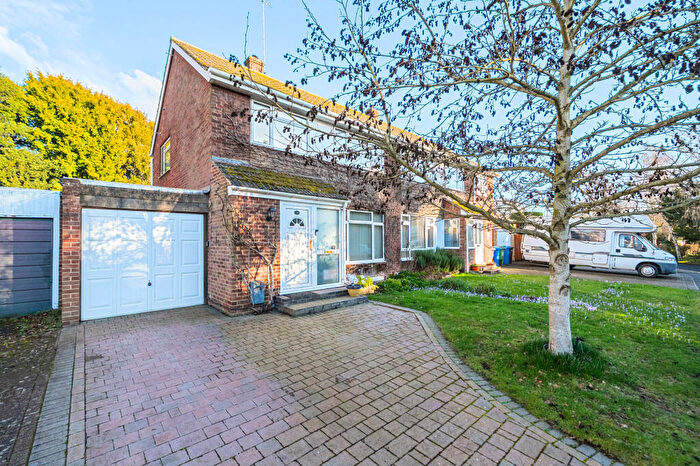
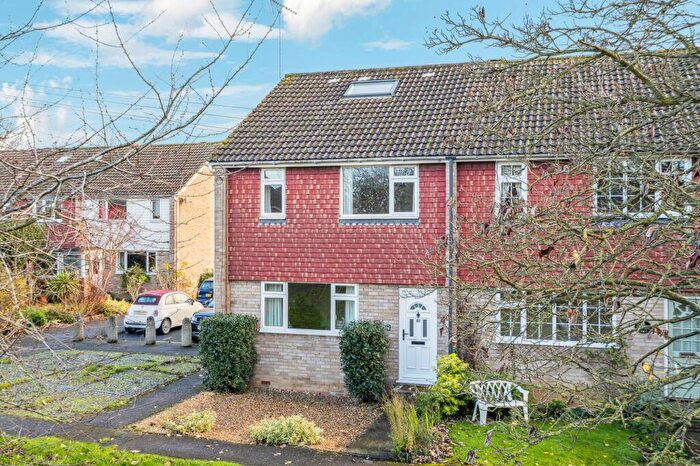
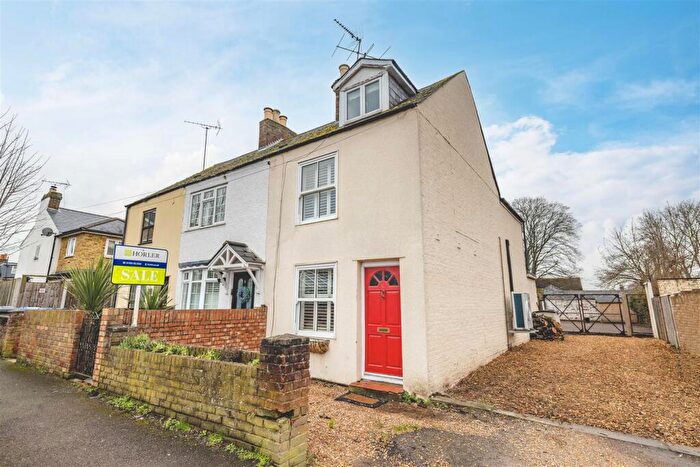
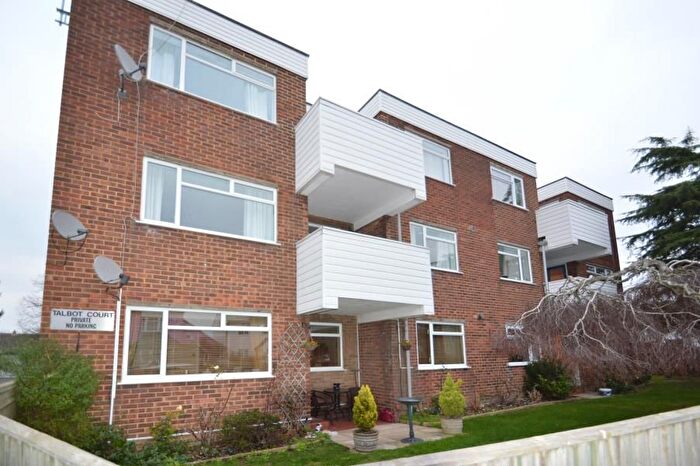
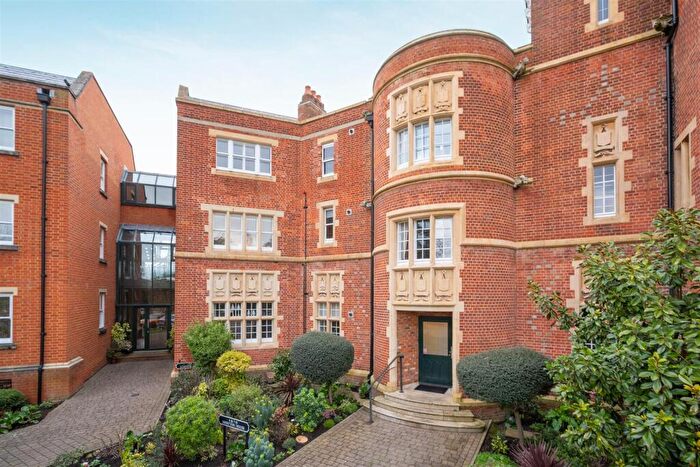
Houses for sale & to rent in Clewer East, Windsor
House Prices in Clewer East
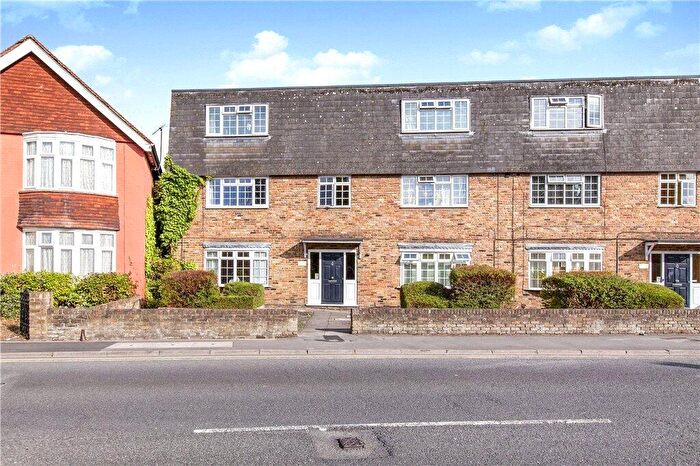
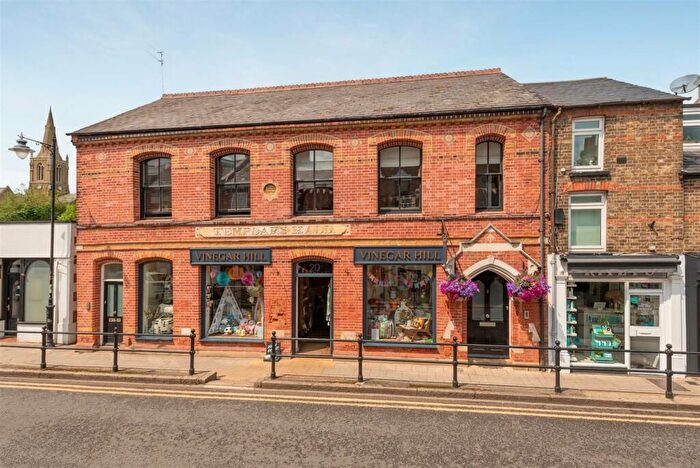
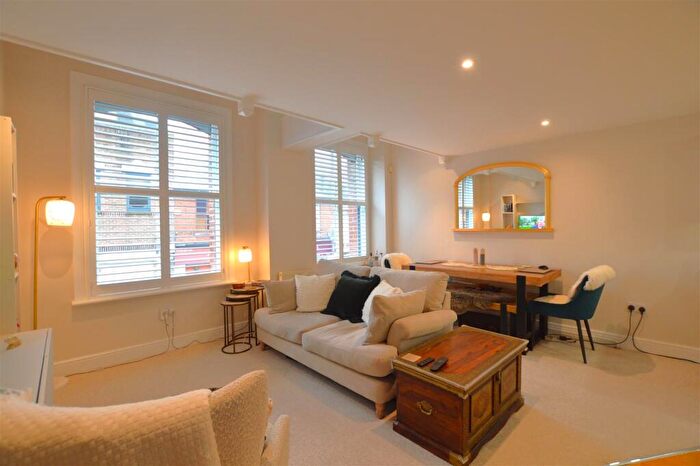
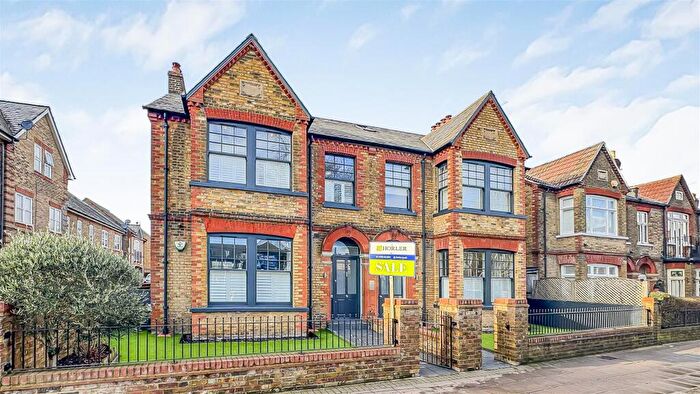
Properties in Clewer East have an average house price of £530,682.00 and had 262 Property Transactions within the last 3 years¹.
Clewer East is an area in Windsor, Windsor and Maidenhead with 2,227 households², where the most expensive property was sold for £1,675,000.00.
Properties for sale in Clewer East
Roads and Postcodes in Clewer East
Navigate through our locations to find the location of your next house in Clewer East, Windsor for sale or to rent.
| Streets | Postcodes |
|---|---|
| Addington Close | SL4 4BP |
| Albion Place | SL4 3QW |
| Alma Road | SL4 3EU SL4 3EX SL4 3EY |
| Almond Close | SL4 3WN SL4 3YL |
| Bailey Close | SL4 3RD |
| Birchington Road | SL4 3QA |
| Bridgeman Drive | SL4 3QP SL4 3SB SL4 3SW SL4 3TD SL4 3SD |
| Bulkeley Avenue | SL4 3LP SL4 3LR SL4 3LT SL4 3LY SL4 3NA SL4 3NE SL4 3NF SL4 3NG |
| Canterbury Mews | SL4 3SF |
| Carey Close | SL4 3LS |
| Carter Close | SL4 3QX |
| Cavalry Crescent | SL4 3LN SL4 3LW |
| Clarence Road | SL4 5BQ |
| Cleves Court | SL4 4EF |
| Clewer Avenue | SL4 3QB |
| Clewer Hill Road | SL4 4BS SL4 4BT SL4 4BW SL4 4DA SL4 4DB SL4 4DQ |
| Clewer New Town | SL4 3QE SL4 3QF |
| College Crescent | SL4 3PF SL4 3PG |
| Combermere Close | SL4 3PY |
| Concorde Court | SL4 3SH |
| Convent Road | SL4 3RB |
| Copper Horse Court | SL4 3FF |
| Dawson Close | SL4 3QZ |
| Dedworth Road | SL4 5AZ |
| Dyson Close | SL4 3LZ |
| Elm Road | SL4 3NB SL4 3ND |
| Firs Avenue | SL4 4BL |
| Gatehouse Close | SL4 3DB |
| Gordon Road | SL4 3RG SL4 3RH |
| Green Lane | SL4 3QD SL4 3RZ SL4 3SA SL4 3TP |
| Hatch Lane | SL4 3QR SL4 3QS SL4 3QT SL4 3QU SL4 3QY SL4 3RJ SL4 3RL SL4 3RW |
| Helston Lane | SL4 5FG SL4 5GG |
| Imperial Road | SL4 3RE SL4 3RU SL4 3RX SL4 3RY SL4 3FL SL4 3RR SL4 3RT |
| Little Buntings | SL4 4DD |
| Little Woodlands | SL4 3RF |
| Longbourn | SL4 3TN SL4 3TQ SL4 3TR SL4 3TS SL4 3TT SL4 3TW |
| Maidenhead Road | SL4 5EJ SL4 5EL SL4 5EX |
| Manor View | SL4 3RN |
| Mayfield Drive | SL4 4RB |
| Nelson Road | SL4 3RQ |
| Peel Close | SL4 3NP SL4 3NW |
| Pinewood Place | SL4 3SN SL4 3TE |
| Princess Avenue | SL4 3LU SL4 3LX |
| Renton Place | SL4 3PN |
| Royal Windsor Way | SL4 5FW |
| Springfield Close | SL4 3PT |
| Springfield Road | SL4 3PH SL4 3PJ SL4 3PL SL4 3PP SL4 3PQ SL4 3PR SL4 3PS SL4 3PU SL4 3PW SL4 3PX SL4 3PZ SL4 3QQ |
| St Johns Drive | SL4 3RA |
| St Johns Road | SL4 3QN |
| St Leonards Road | SL4 3DJ SL4 3DL SL4 3DX SL4 3DY SL4 3DZ SL4 3EB SL4 3DN SL4 3DU |
| The Cloisters | SL4 3ST |
| The Riverbank | SL4 5HU |
| Trevelyan Court | SL4 3SE |
| Tyrell Gardens | SL4 4DH |
| Upcroft | SL4 3NH SL4 3NJ SL4 3NQ |
| Westmead | SL4 3NL SL4 3NN |
| Whistler Mews | SL4 3FQ |
| Windmill Close | SL4 3NZ |
| York Avenue | SL4 3PB SL4 3PD SL4 3PE |
| York Road | SL4 3NU SL4 3NX SL4 3NY SL4 3PA SL4 3NT |
| SL4 5AL SL4 5FN SL4 5FQ |
Transport near Clewer East
-
Windsor and Eton Central Station
-
Windsor and Eton Riverside Station
-
Datchet Station
-
Sunnymeads Station
-
Slough Station
- FAQ
- Price Paid By Year
- Property Type Price
Frequently asked questions about Clewer East
What is the average price for a property for sale in Clewer East?
The average price for a property for sale in Clewer East is £530,682. This amount is 6% lower than the average price in Windsor. There are 1,944 property listings for sale in Clewer East.
What streets have the most expensive properties for sale in Clewer East?
The streets with the most expensive properties for sale in Clewer East are York Road at an average of £1,181,000, The Cloisters at an average of £1,065,000 and College Crescent at an average of £937,500.
What streets have the most affordable properties for sale in Clewer East?
The streets with the most affordable properties for sale in Clewer East are Concorde Court at an average of £217,000, Cleves Court at an average of £267,416 and Clarence Road at an average of £285,500.
Which train stations are available in or near Clewer East?
Some of the train stations available in or near Clewer East are Windsor and Eton Central, Windsor and Eton Riverside and Datchet.
Property Price Paid in Clewer East by Year
The average sold property price by year was:
| Year | Average Sold Price | Price Change |
Sold Properties
|
|---|---|---|---|
| 2025 | £516,135 | 1% |
79 Properties |
| 2024 | £509,522 | -12% |
101 Properties |
| 2023 | £570,761 | 12% |
82 Properties |
| 2022 | £505,058 | -0,1% |
137 Properties |
| 2021 | £505,798 | 1% |
95 Properties |
| 2020 | £502,969 | 3% |
66 Properties |
| 2019 | £488,525 | -13% |
86 Properties |
| 2018 | £550,849 | 15% |
83 Properties |
| 2017 | £468,951 | -5% |
78 Properties |
| 2016 | £490,554 | 13% |
86 Properties |
| 2015 | £428,588 | 7% |
91 Properties |
| 2014 | £396,666 | 6% |
118 Properties |
| 2013 | £372,766 | -0,3% |
103 Properties |
| 2012 | £373,935 | 0,4% |
90 Properties |
| 2011 | £372,493 | 8% |
79 Properties |
| 2010 | £343,395 | 1% |
84 Properties |
| 2009 | £338,745 | -5% |
83 Properties |
| 2008 | £356,175 | 4% |
86 Properties |
| 2007 | £340,612 | 7% |
140 Properties |
| 2006 | £318,390 | -3% |
164 Properties |
| 2005 | £327,199 | 8% |
170 Properties |
| 2004 | £300,912 | 4% |
165 Properties |
| 2003 | £288,966 | 9% |
116 Properties |
| 2002 | £262,413 | 16% |
139 Properties |
| 2001 | £220,460 | 16% |
113 Properties |
| 2000 | £184,839 | 20% |
76 Properties |
| 1999 | £148,765 | 7% |
123 Properties |
| 1998 | £137,689 | 15% |
100 Properties |
| 1997 | £117,546 | 21% |
122 Properties |
| 1996 | £93,444 | -18% |
116 Properties |
| 1995 | £110,004 | - |
78 Properties |
Property Price per Property Type in Clewer East
Here you can find historic sold price data in order to help with your property search.
The average Property Paid Price for specific property types in the last three years are:
| Property Type | Average Sold Price | Sold Properties |
|---|---|---|
| Semi Detached House | £582,174.00 | 62 Semi Detached Houses |
| Detached House | £886,282.00 | 37 Detached Houses |
| Terraced House | £507,212.00 | 82 Terraced Houses |
| Flat | £352,595.00 | 81 Flats |

