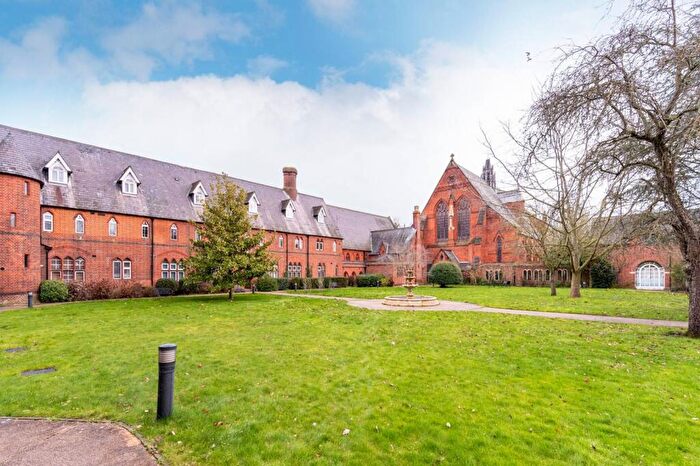
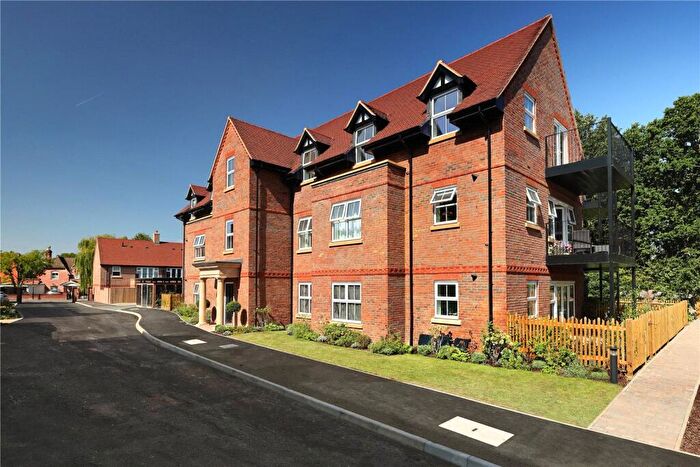
Houses for sale & to rent in Park, Windsor
House Prices in Park
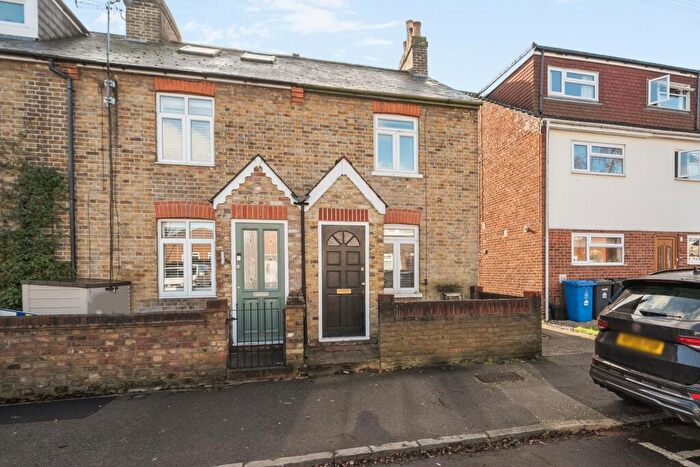
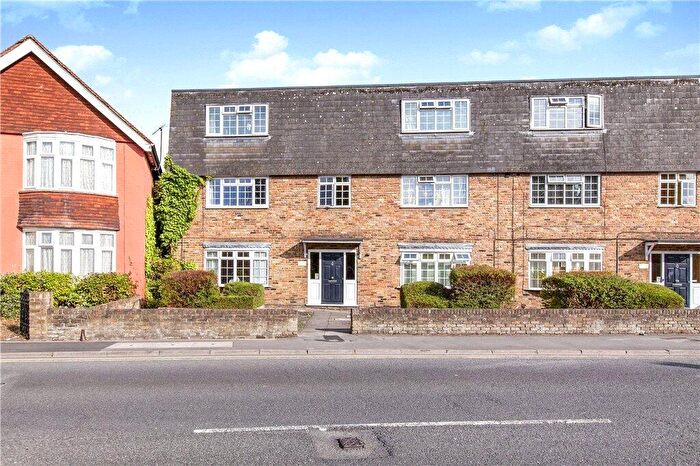
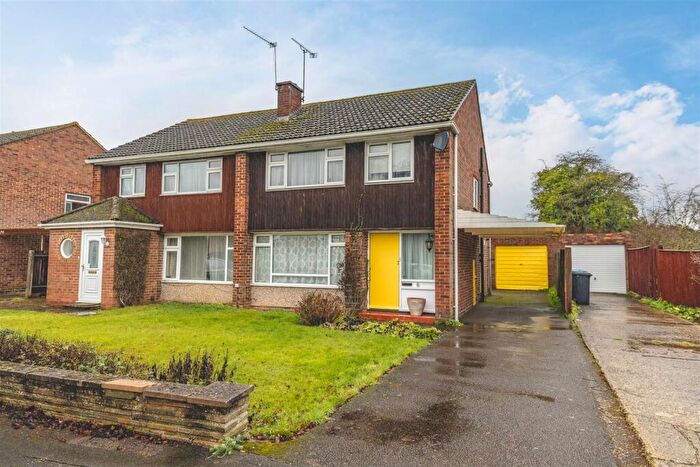
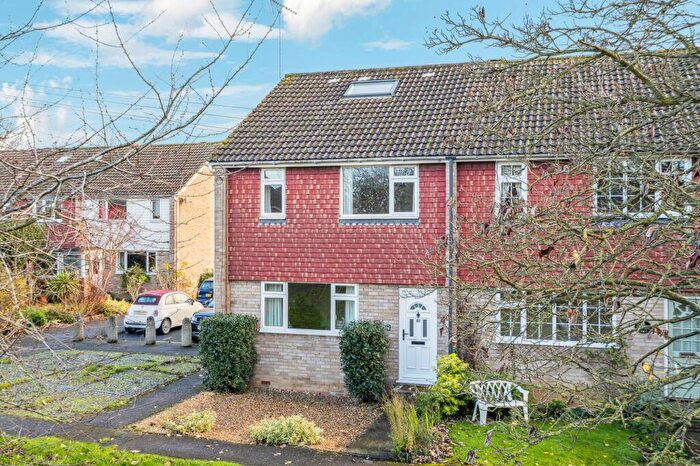
Properties in Park have an average house price of £707,934.00 and had 169 Property Transactions within the last 3 years¹.
Park is an area in Windsor, Windsor and Maidenhead with 1,937 households², where the most expensive property was sold for £3,837,500.00.
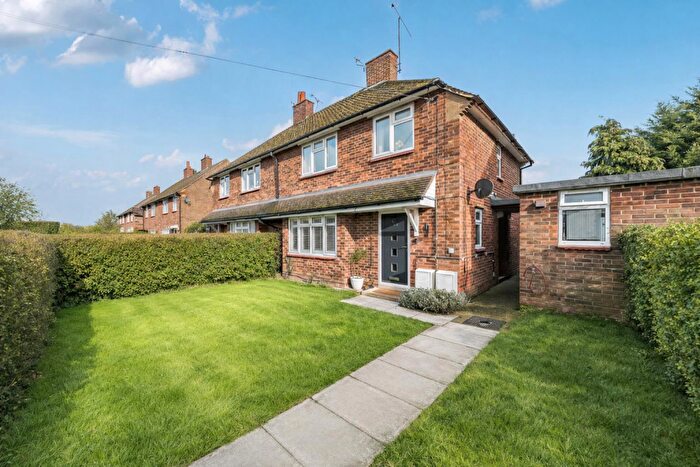
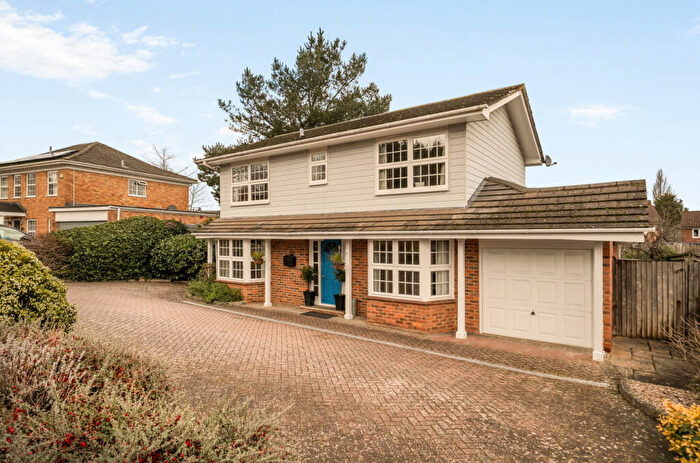
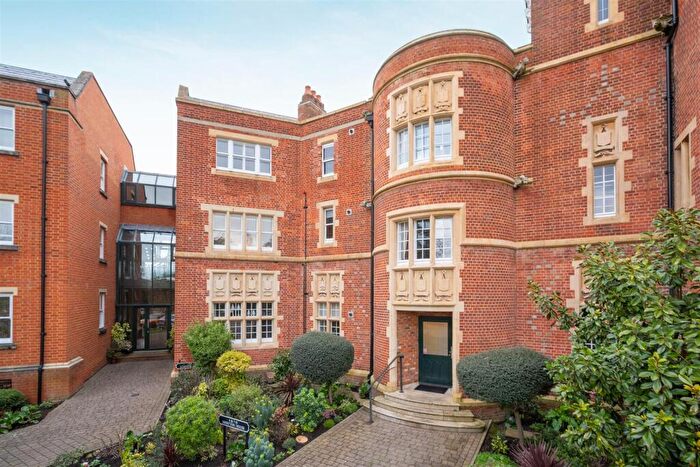
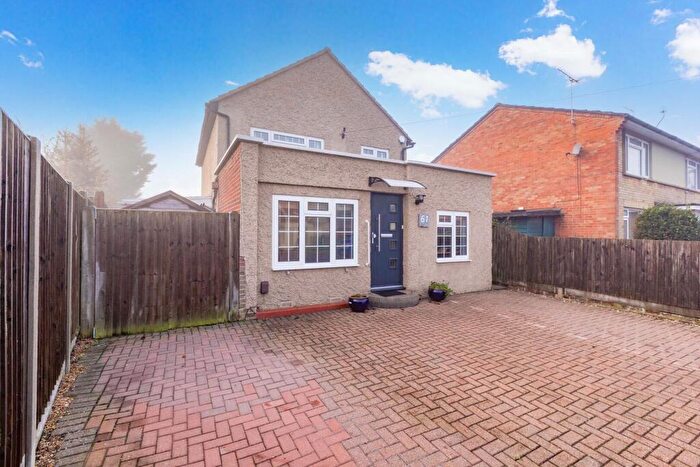
Properties for sale in Park
Roads and Postcodes in Park
Navigate through our locations to find the location of your next house in Park, Windsor for sale or to rent.
| Streets | Postcodes |
|---|---|
| Balmoral Gardens | SL4 3SG |
| Bolton Avenue | SL4 3JB SL4 3JD SL4 3JE SL4 3JF |
| Bolton Crescent | SL4 3JH SL4 3JQ |
| Bolton Road | SL4 3JG SL4 3JJ SL4 3JL SL4 3JN SL4 3JW SL4 3JX |
| Bourne Avenue | SL4 3JP SL4 3JR |
| Brudenell | SL4 4UR |
| Bryer Place | SL4 4YL |
| Byron Court | SL4 4PU |
| Chestnut Drive | SL4 4UT |
| Clewer Hill Road | SL4 4BU SL4 4BY SL4 4DE |
| Coombe Hill Court | SL4 4UL |
| Dower Park | SL4 4BQ |
| Duncannon Crescent | SL4 4YP |
| Duncroft | SL4 4HH |
| Ellison Close | SL4 4BZ |
| Fairlawn Park | SL4 4HL |
| Fountain Gardens | SL4 3SU SL4 3SX SL4 3SY SL4 3SZ |
| Frances Road | SL4 3FE |
| Franklyn Crescent | SL4 4YT |
| Gilman Crescent | SL4 4YN |
| Harrington Close | SL4 4AD |
| Hemwood Road | SL4 4YU SL4 4YX |
| Hermitage Lane | SL4 4AZ |
| Illingworth | SL4 4UP |
| Ivy Cottages | SL4 4AW |
| Jubilee Place | SL4 3FG |
| Kensington Mews | SL4 3FA |
| Kimber Close | SL4 4BJ |
| Kings Road | SL4 2AY |
| Montague Park | SL4 4BD |
| Nightingale Walk | SL4 3HS |
| Orwell Close | SL4 3LD |
| Osborne Road | SL4 3EG SL4 3EQ SL4 3SQ SL4 3SS |
| Perrycroft | SL4 4HA SL4 4HB SL4 4HD SL4 4HE SL4 4HJ |
| Prospect Place | SL4 3JA |
| Queen Annes Road | SL4 2BJ SL4 2EJ |
| Queens Acre | SL4 2BE |
| Rowland Close | SL4 4YW |
| Rycroft | SL4 4HG |
| Rydings | SL4 4HF |
| Sherbourne Drive | SL4 4AE |
| Snowden Close | SL4 4BH |
| St Leonards Hill | SL4 4AH SL4 4AJ SL4 4AL SL4 4AT |
| St Leonards Road | SL4 3DR SL4 3DS SL4 3DT SL4 3DW SL4 3EA SL4 3EE SL4 3TH |
| Stroud Close | SL4 4YR |
| The Redwoods | SL4 3TA |
| Turnoak Park | SL4 4UN |
| Victor Road | SL4 3JS SL4 3JU |
| Washington Drive | SL4 4NR SL4 4NS |
| Wilton Crescent | SL4 4YJ |
| Winkfield Road | SL4 4AF SL4 4AQ SL4 4BA SL4 4BG |
| Wolf Lane | SL4 4YY SL4 4YZ |
| Wood Close | SL4 3JZ SL4 3LA SL4 3LB |
| Woodland Avenue | SL4 4AG |
Transport near Park
-
Windsor and Eton Central Station
-
Windsor and Eton Riverside Station
-
Datchet Station
-
Sunnymeads Station
- FAQ
- Price Paid By Year
- Property Type Price
Frequently asked questions about Park
What is the average price for a property for sale in Park?
The average price for a property for sale in Park is £707,934. This amount is 26% higher than the average price in Windsor. There are 1,452 property listings for sale in Park.
What streets have the most expensive properties for sale in Park?
The streets with the most expensive properties for sale in Park are St Leonards Hill at an average of £2,204,583, Bolton Crescent at an average of £1,723,333 and The Redwoods at an average of £1,610,000.
What streets have the most affordable properties for sale in Park?
The streets with the most affordable properties for sale in Park are Byron Court at an average of £312,500, Fountain Gardens at an average of £341,888 and Osborne Road at an average of £345,800.
Which train stations are available in or near Park?
Some of the train stations available in or near Park are Windsor and Eton Central, Windsor and Eton Riverside and Datchet.
Property Price Paid in Park by Year
The average sold property price by year was:
| Year | Average Sold Price | Price Change |
Sold Properties
|
|---|---|---|---|
| 2025 | £697,004 | -3% |
53 Properties |
| 2024 | £717,671 | 1% |
64 Properties |
| 2023 | £707,090 | -2% |
52 Properties |
| 2022 | £722,504 | 3% |
85 Properties |
| 2021 | £698,357 | -6% |
103 Properties |
| 2020 | £743,330 | 15% |
63 Properties |
| 2019 | £629,515 | 0,2% |
63 Properties |
| 2018 | £628,335 | -2% |
55 Properties |
| 2017 | £640,952 | -19% |
73 Properties |
| 2016 | £760,779 | 18% |
101 Properties |
| 2015 | £625,969 | 18% |
94 Properties |
| 2014 | £510,766 | -7% |
95 Properties |
| 2013 | £547,814 | 16% |
104 Properties |
| 2012 | £462,113 | -15% |
86 Properties |
| 2011 | £533,201 | 5% |
73 Properties |
| 2010 | £506,217 | 19% |
62 Properties |
| 2009 | £410,752 | -13% |
66 Properties |
| 2008 | £462,831 | -9% |
52 Properties |
| 2007 | £504,217 | 15% |
137 Properties |
| 2006 | £427,825 | 19% |
140 Properties |
| 2005 | £345,752 | -7% |
115 Properties |
| 2004 | £369,243 | 2% |
114 Properties |
| 2003 | £361,772 | 12% |
115 Properties |
| 2002 | £316,790 | 2% |
124 Properties |
| 2001 | £311,924 | 11% |
136 Properties |
| 2000 | £276,060 | 14% |
152 Properties |
| 1999 | £238,090 | 24% |
151 Properties |
| 1998 | £181,998 | 9% |
137 Properties |
| 1997 | £164,857 | 16% |
132 Properties |
| 1996 | £139,036 | 2% |
121 Properties |
| 1995 | £136,038 | - |
112 Properties |
Property Price per Property Type in Park
Here you can find historic sold price data in order to help with your property search.
The average Property Paid Price for specific property types in the last three years are:
| Property Type | Average Sold Price | Sold Properties |
|---|---|---|
| Semi Detached House | £712,750.00 | 26 Semi Detached Houses |
| Detached House | £1,137,085.00 | 48 Detached Houses |
| Terraced House | £581,117.00 | 58 Terraced Houses |
| Flat | £346,608.00 | 37 Flats |

