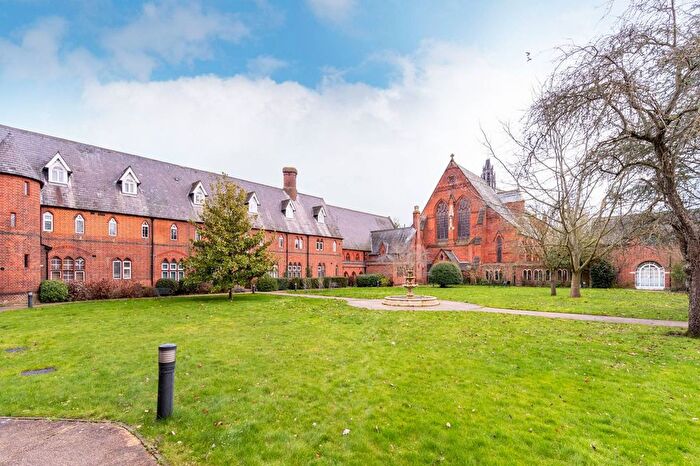
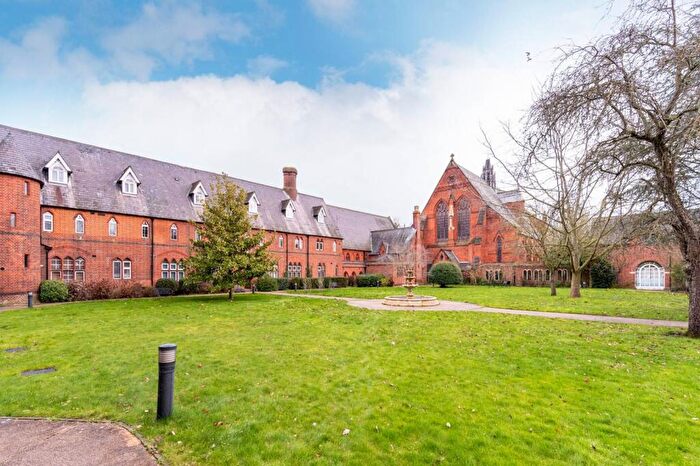
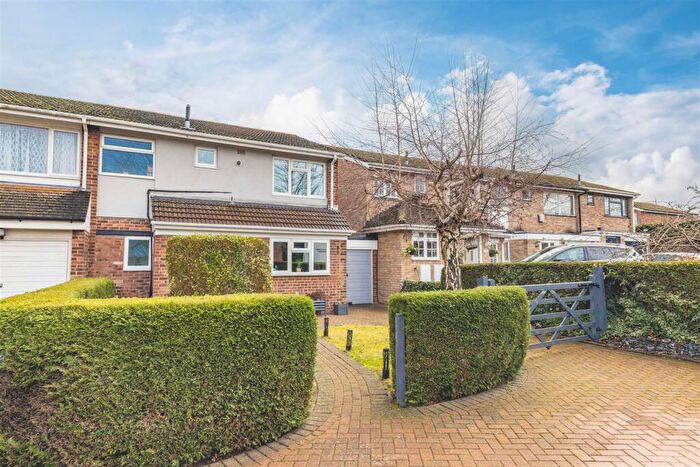
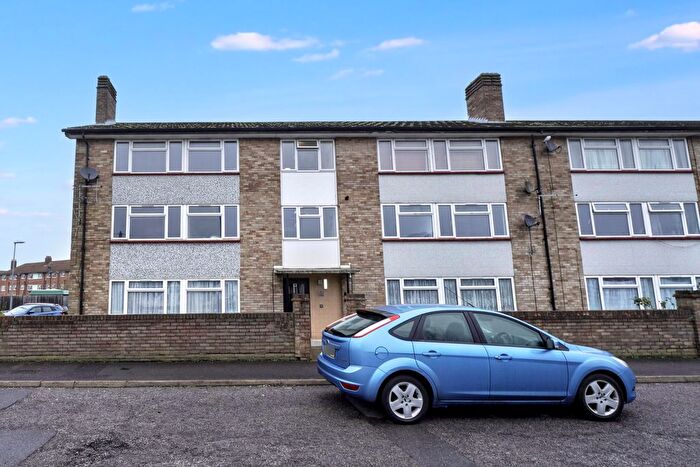
Houses for sale & to rent in Clewer South, Windsor
House Prices in Clewer South
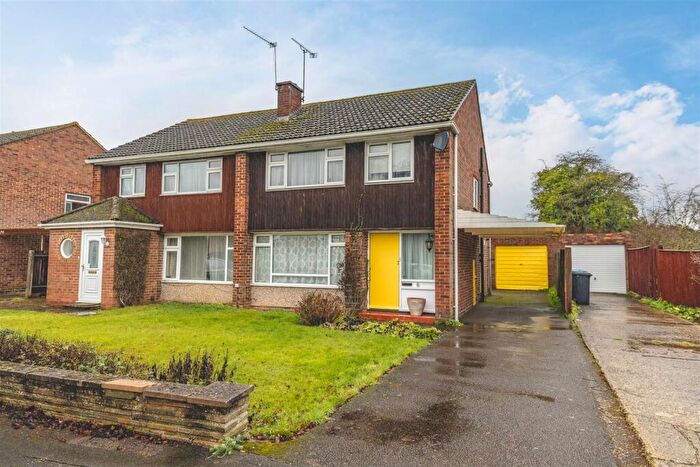
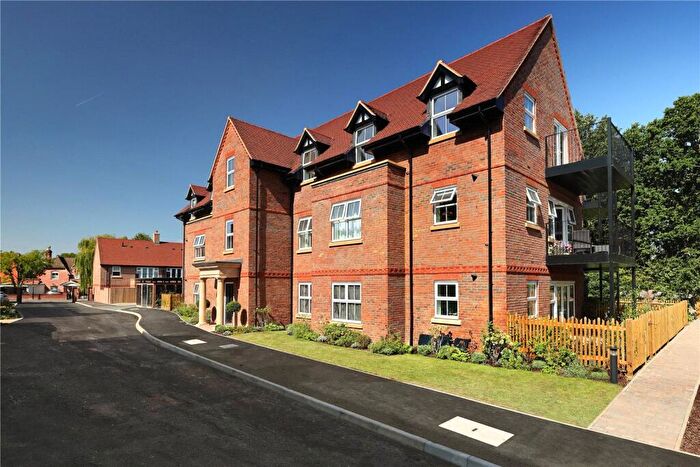
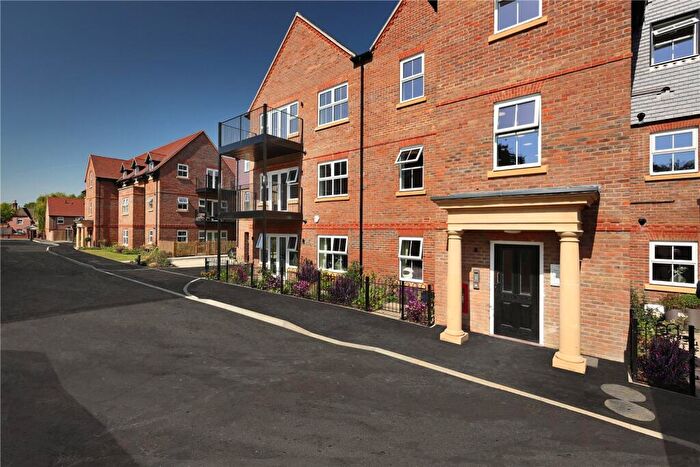
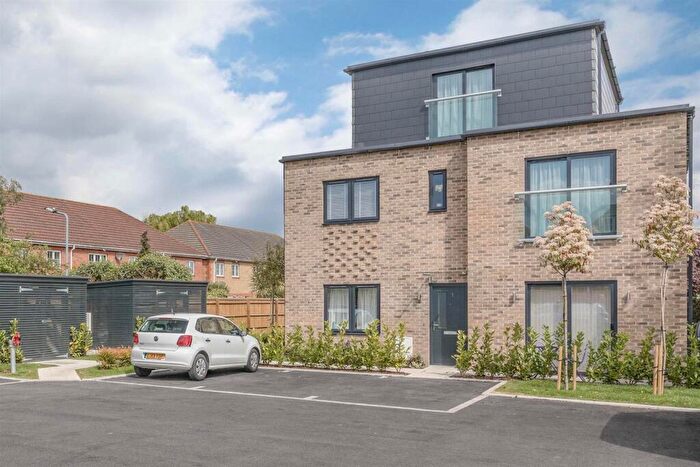
Properties in Clewer South have an average house price of £434,354.00 and had 149 Property Transactions within the last 3 years¹.
Clewer South is an area in Windsor, Windsor and Maidenhead with 1,670 households², where the most expensive property was sold for £780,000.00.
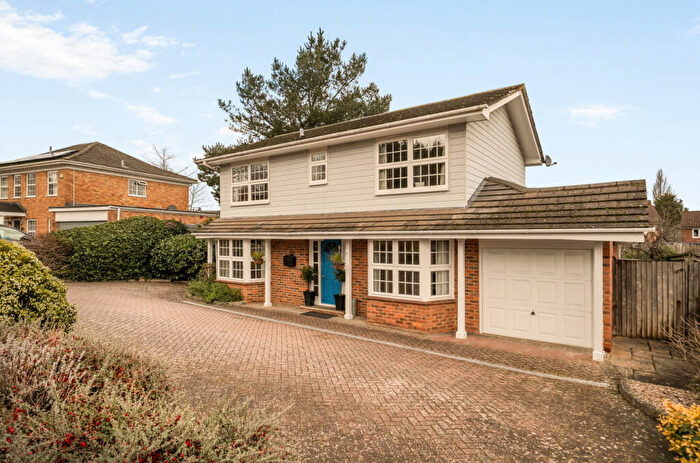
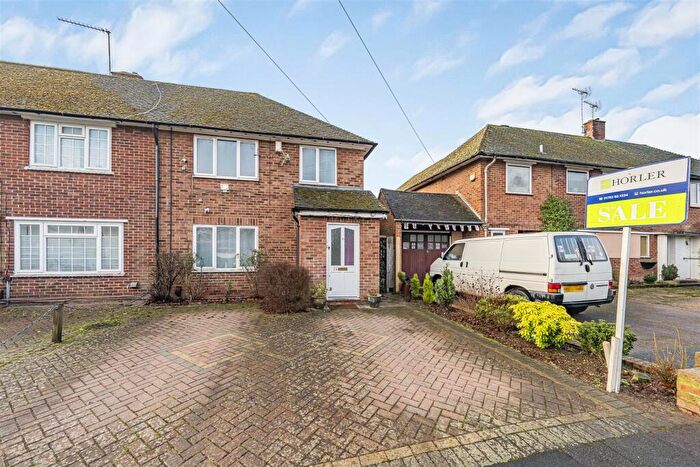
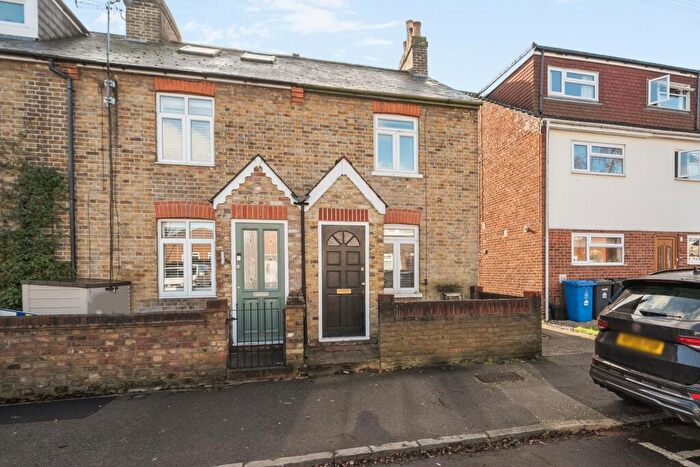
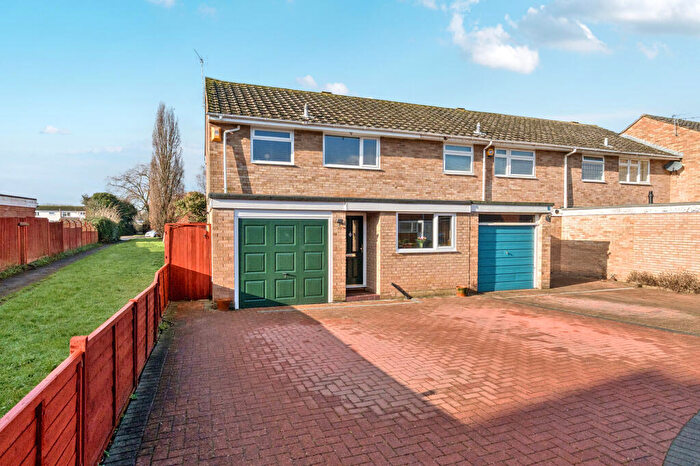
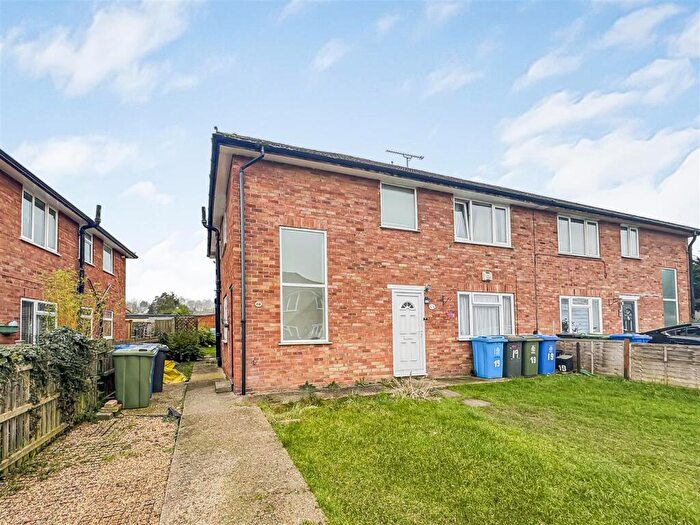
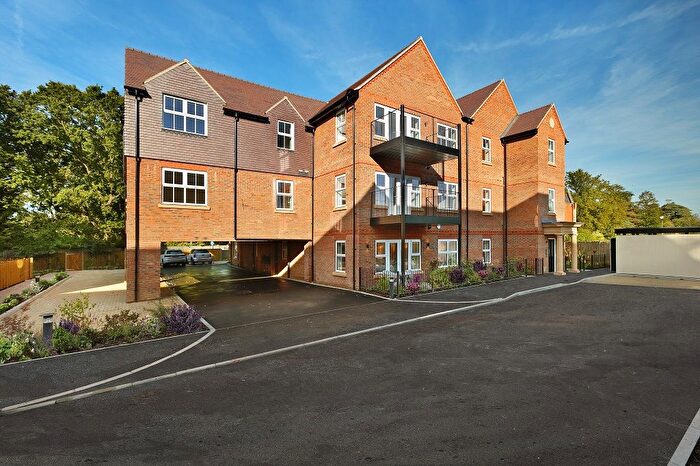
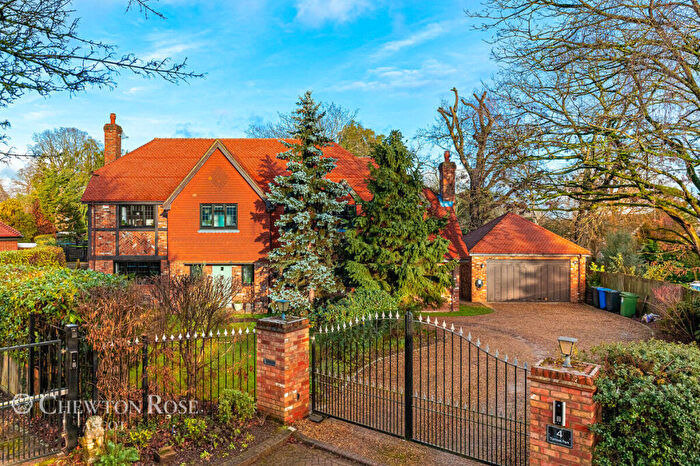
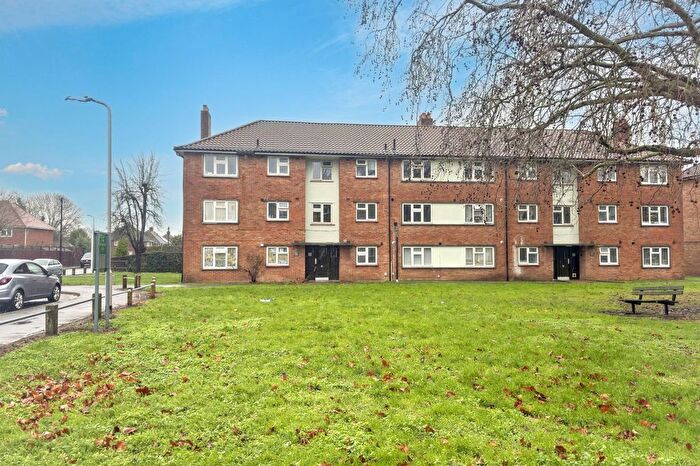
Properties for sale in Clewer South
Roads and Postcodes in Clewer South
Navigate through our locations to find the location of your next house in Clewer South, Windsor for sale or to rent.
| Streets | Postcodes |
|---|---|
| Abbots Walk | SL4 4EA |
| Ash Lane | SL4 4PS |
| Basford Way | SL4 4NF |
| Bell View | SL4 4ET SL4 4EU |
| Bell View Close | SL4 4EX |
| Bruce Walk | SL4 4NB |
| Burnham Close | SL4 4PN |
| Burton Way | SL4 4NJ |
| Camm Avenue | SL4 4NN SL4 4NW |
| Church Terrace | SL4 4JG |
| Clewer Hill Road | SL4 4DP SL4 4DU SL4 4DW SL4 4DX SL4 4DY SL4 4DZ |
| Cranbourne Avenue | SL4 4ER SL4 4ES |
| Dean Close | SL4 4PL |
| Dedworth Road | SL4 4JN SL4 4JS SL4 4JW SL4 4LB SL4 4LW SL4 5BB |
| Filmer Road | SL4 4LZ |
| Fiveways | SL4 4HR |
| Forest Road | SL4 4HU SL4 4HX |
| Foster Avenue | SL4 4NG SL4 4NH SL4 4NQ |
| Greenacre | SL4 5LW |
| Highfield Road | SL4 4DN |
| Keeler Close | SL4 4NL |
| Keepers Farm Close | SL4 4HZ SL4 4JA |
| Kentons Lane | SL4 4JH SL4 4JJ |
| Leigh Square | SL4 4PP |
| Lodge Way | SL4 4DS |
| Lovejoy Lane | SL4 4ND |
| Luff Close | SL4 4NP |
| Manor Farm Close | SL4 4DJ |
| Merwin Way | SL4 4PR |
| Monks Road | SL4 4PE |
| Orchard Lea Villas | SL4 4LD |
| Park Corner | SL4 4DR SL4 4DT |
| Poolmans Road | SL4 4NZ SL4 4PA SL4 4PB |
| Priors Road | SL4 4PD |
| Selwyn Close | SL4 4WA |
| Sheepcote Road | SL4 4JQ SL4 4NY |
| St Andrews Avenue | SL4 4EH SL4 4EJ |
| St Andrews Crescent | SL4 4EL SL4 4EN SL4 4EP SL4 4EW |
| Stirling Close | SL4 4PW |
| Tinkers Lane | SL4 4LP SL4 4LR SL4 4LS |
| Tozer Walk | SL4 4NE |
| White Horse Road | SL4 4PG SL4 4PH SL4 4PJ SL4 4PQ |
| Wolf Lane | SL4 4GY SL4 4HS SL4 4HT SL4 4HY SL4 4JB |
| Wyatt Road | SL4 4PF |
Transport near Clewer South
- FAQ
- Price Paid By Year
- Property Type Price
Frequently asked questions about Clewer South
What is the average price for a property for sale in Clewer South?
The average price for a property for sale in Clewer South is £434,354. This amount is 23% lower than the average price in Windsor. There are 1,047 property listings for sale in Clewer South.
What streets have the most expensive properties for sale in Clewer South?
The streets with the most expensive properties for sale in Clewer South are Bell View Close at an average of £650,000, St Andrews Crescent at an average of £627,110 and Bell View at an average of £574,000.
What streets have the most affordable properties for sale in Clewer South?
The streets with the most affordable properties for sale in Clewer South are Filmer Road at an average of £265,000, Bruce Walk at an average of £300,000 and Wolf Lane at an average of £305,416.
Which train stations are available in or near Clewer South?
Some of the train stations available in or near Clewer South are Windsor and Eton Central, Windsor and Eton Riverside and Datchet.
Property Price Paid in Clewer South by Year
The average sold property price by year was:
| Year | Average Sold Price | Price Change |
Sold Properties
|
|---|---|---|---|
| 2025 | £457,592 | 8% |
39 Properties |
| 2024 | £419,281 | -3% |
46 Properties |
| 2023 | £431,026 | -6% |
64 Properties |
| 2022 | £456,026 | 7% |
52 Properties |
| 2021 | £423,584 | 3% |
93 Properties |
| 2020 | £410,065 | 10% |
40 Properties |
| 2019 | £370,264 | -7% |
55 Properties |
| 2018 | £395,594 | -4% |
37 Properties |
| 2017 | £411,376 | -1% |
55 Properties |
| 2016 | £415,715 | 16% |
51 Properties |
| 2015 | £350,797 | 13% |
55 Properties |
| 2014 | £305,900 | 11% |
57 Properties |
| 2013 | £273,090 | 3% |
55 Properties |
| 2012 | £264,691 | -9% |
46 Properties |
| 2011 | £289,679 | 8% |
52 Properties |
| 2010 | £266,581 | 2% |
48 Properties |
| 2009 | £261,927 | -2% |
36 Properties |
| 2008 | £267,977 | -3% |
44 Properties |
| 2007 | £276,069 | 19% |
94 Properties |
| 2006 | £224,542 | -4% |
129 Properties |
| 2005 | £233,982 | 8% |
69 Properties |
| 2004 | £214,177 | 1% |
71 Properties |
| 2003 | £213,024 | 14% |
76 Properties |
| 2002 | £183,319 | 8% |
98 Properties |
| 2001 | £167,779 | 18% |
76 Properties |
| 2000 | £136,905 | 17% |
77 Properties |
| 1999 | £114,047 | 3% |
88 Properties |
| 1998 | £110,087 | 17% |
70 Properties |
| 1997 | £91,891 | 13% |
82 Properties |
| 1996 | £80,068 | 4% |
125 Properties |
| 1995 | £76,946 | - |
78 Properties |
Property Price per Property Type in Clewer South
Here you can find historic sold price data in order to help with your property search.
The average Property Paid Price for specific property types in the last three years are:
| Property Type | Average Sold Price | Sold Properties |
|---|---|---|
| Semi Detached House | £472,185.00 | 51 Semi Detached Houses |
| Detached House | £602,973.00 | 15 Detached Houses |
| Terraced House | £429,851.00 | 54 Terraced Houses |
| Flat | £288,989.00 | 29 Flats |

