
Houses for sale in Oxton, Birkenhead
House Prices in Oxton
Properties in Oxton have an average house price of £142k and had 63 Property Transactions within the last 3 years¹.
Oxton is an area in Birkenhead, Wirral with 531 households², where the most expensive property was sold for £325k.
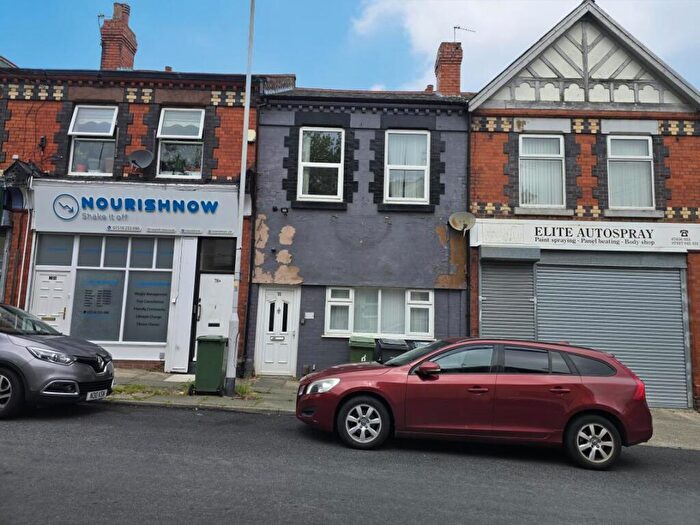
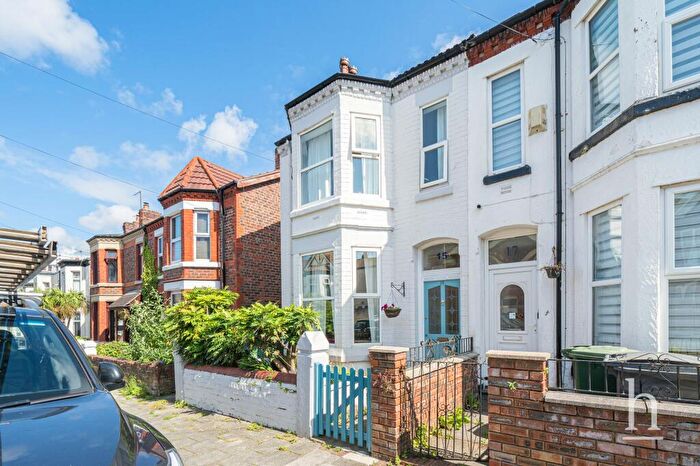
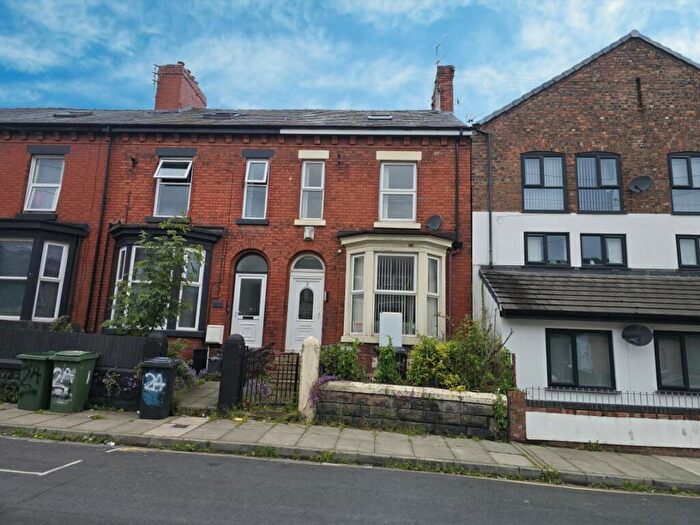
Properties for sale in Oxton
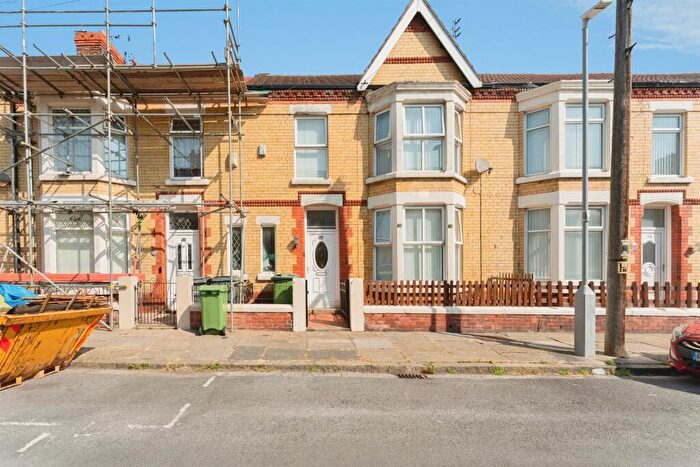
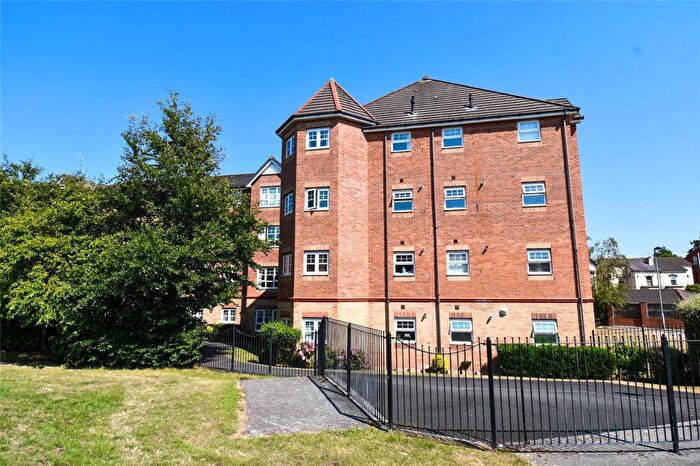

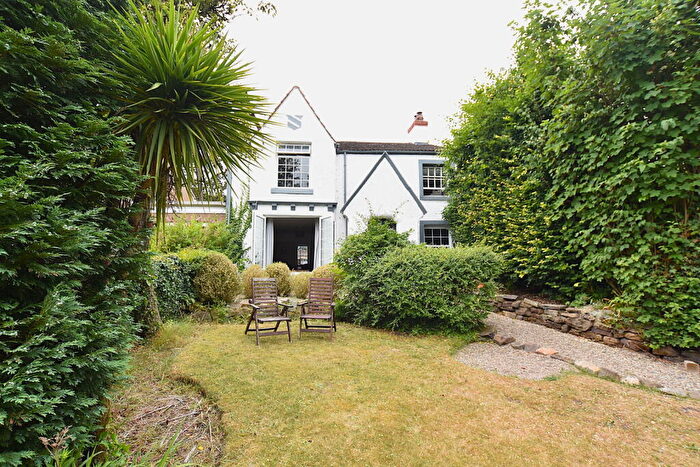
![]()
If you are looking to sell your house, let it out, or receive a property valuation, an expert can help you.
Click the button below to get started.
Roads and Postcodes in Oxton
Navigate through our locations to find the location of your next house in Oxton, Birkenhead for sale or to rent.
| Streets | Postcodes |
|---|---|
| East Bank | CH42 9NP |
| Gorsefield Road | CH42 9NR CH42 9NS CH42 9NT |
| Heatherdale Close | CH42 9QF |
| Highgreen Road | CH42 9NU |
| Merlin Road | CH42 9QG CH42 9QH CH42 9QJ CH42 9QL |
| Oakdene Road | CH42 9NL |
| Singleton Avenue | CH42 9JH CH42 9JJ |
| Woodchurch Court | CH42 9QQ |
| Woodchurch Road | CH41 2UF CH42 8PG CH42 8PQ CH42 9LJ CH42 9LL CH42 9LN CH42 9LP CH42 9LR CH42 9LS CH42 9LW |
Property price trends in Oxton
According to the latest Land Registry data, the average home in Oxton sold for £149,000 in 2026. That figure comes from 733 sales logged over the past 31 years.
Prices have continued to climb over the last three years. Compared with 2023, when the typical sale came in around £137,222, that's a rise of roughly 8.6%.
Looking back five years, average prices are up about 11.7% since 2021, a gain of around £15,653 in cash terms.
Zoom out to the past decade for the fuller picture. Back in 2016, homes here averaged £113,654, so the typical sold price has climbed about 31.1% since then, roughly 2.7% a year. Stretch the view to fifteen years and that annual pace holds at about 2.8%.
Frequently asked questions about Oxton
What is the average price for a property for sale in Oxton?
The average price for a property for sale in Oxton is £141,842. This amount is 1% higher than the average price in Birkenhead. There are 1,267 property listings for sale in Oxton.
What streets have the most expensive properties for sale in Oxton?
The streets with the most expensive properties for sale in Oxton are East Bank at an average of £325,000, Woodchurch Road at an average of £149,499 and Gorsefield Road at an average of £146,500.
What streets have the most affordable properties for sale in Oxton?
The streets with the most affordable properties for sale in Oxton are Singleton Avenue at an average of £128,122, Merlin Road at an average of £129,570 and Highgreen Road at an average of £133,400.
Which train stations are available in or near Oxton?
Some of the train stations available in or near Oxton are Green Lane, Birkenhead Central and Rock Ferry.
Property Price Paid in Oxton by Year
The average sold property price by year was:
| Year | Average Sold Price | Price Change |
Sold Properties
|
|---|---|---|---|
| 2026 | £149,000 | 4% |
2 Properties |
| 2025 | £143,096 | -1% |
24 Properties |
| 2024 | £143,881 | 5% |
19 Properties |
| 2023 | £137,222 | -10% |
18 Properties |
| 2022 | £150,409 | 11% |
22 Properties |
| 2021 | £133,347 | 18% |
20 Properties |
| 2020 | £109,156 | -6% |
16 Properties |
| 2019 | £115,393 | 0,2% |
24 Properties |
| 2018 | £115,167 | 8% |
21 Properties |
| 2017 | £105,599 | -8% |
20 Properties |
Property Price per Property Type in Oxton
Here you can find historic sold price data in order to help with your property search.
The average Property Paid Price for specific property types in the last three years are:
| Property Type | Average Sold Price | Sold Properties |
|---|---|---|
| Semi Detached House | £167,650.00 | 10 Semi Detached Houses |
| Terraced House | £143,030.00 | 44 Terraced Houses |
| Flat | £107,355.00 | 9 Flats |
