
Houses for sale & to rent in Prenton, Birkenhead
House Prices in Prenton
Properties in Prenton have an average house price of £227k and had 403 Property Transactions within the last 3 years¹.
Prenton is an area in Birkenhead, Wirral with 3,686 households², where the most expensive property was sold for £1.01M.
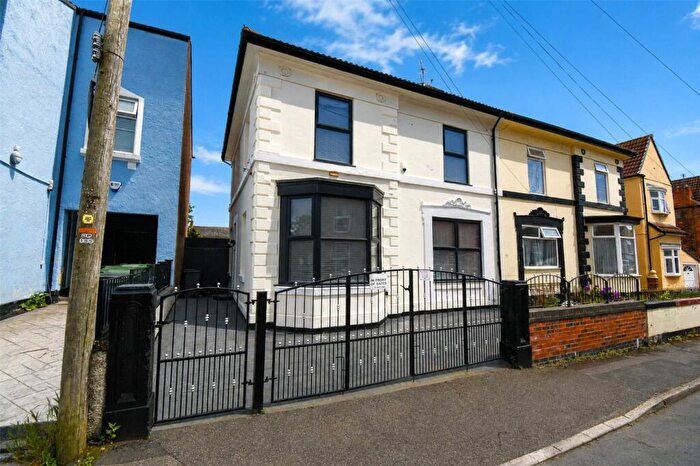
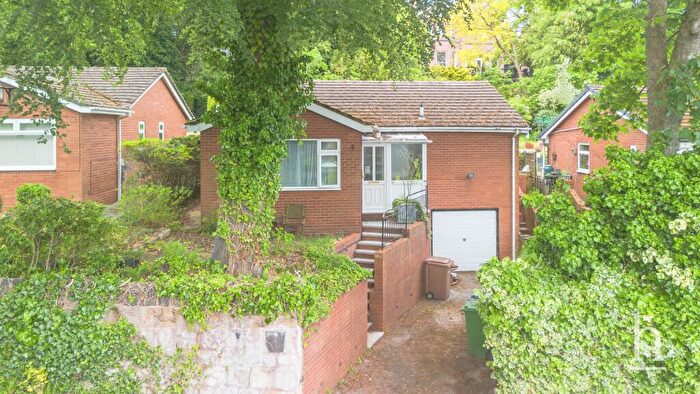
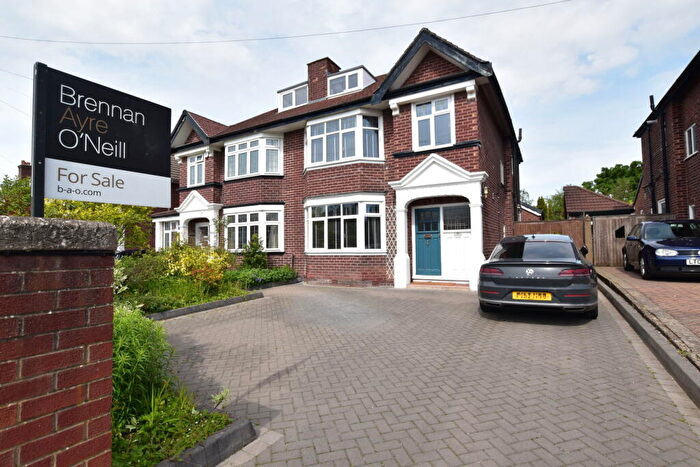
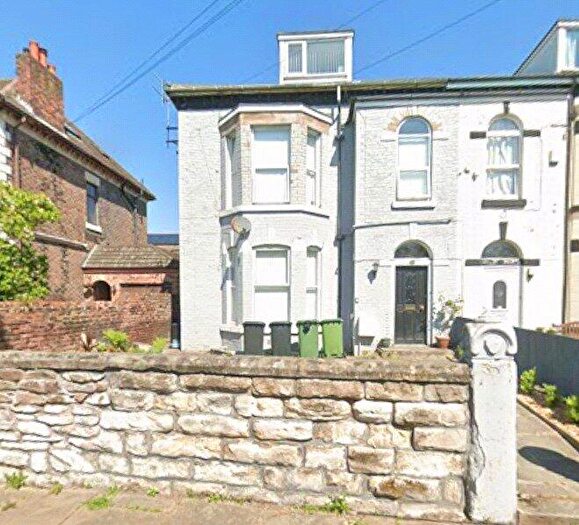
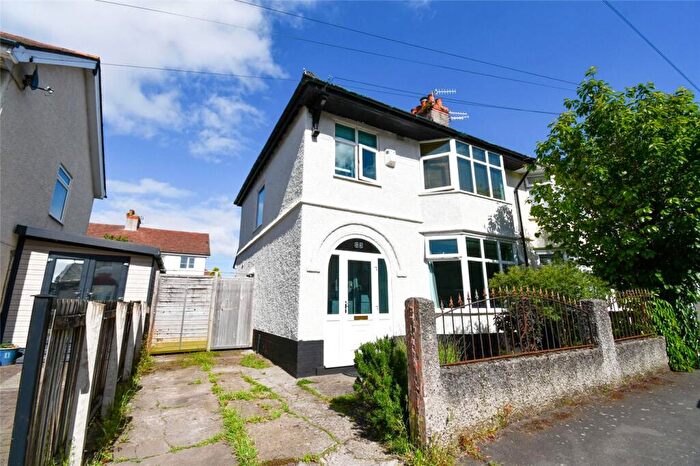
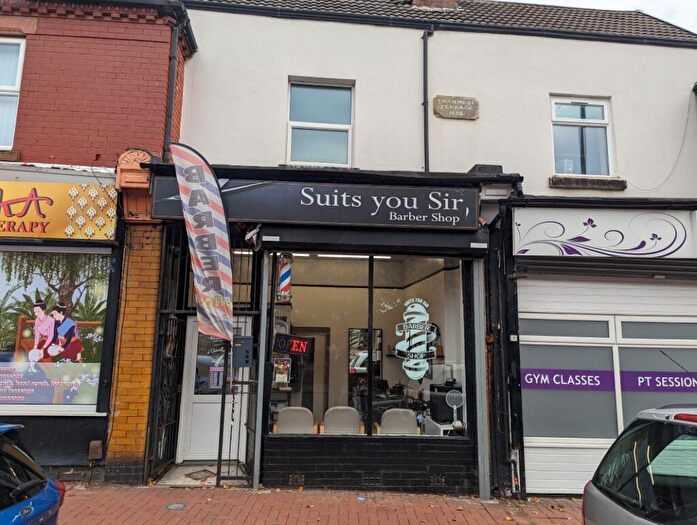
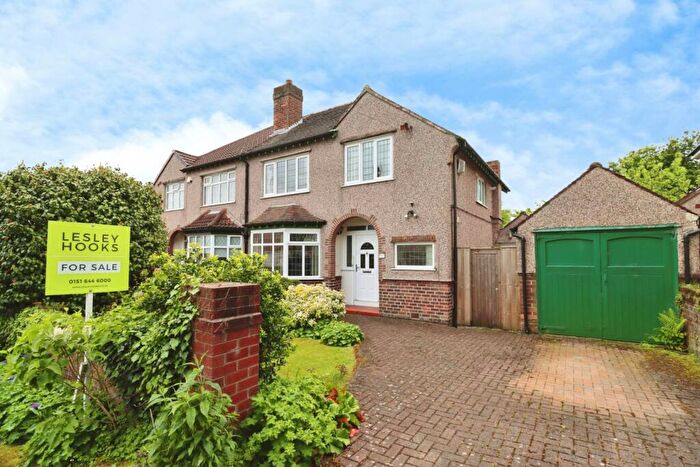
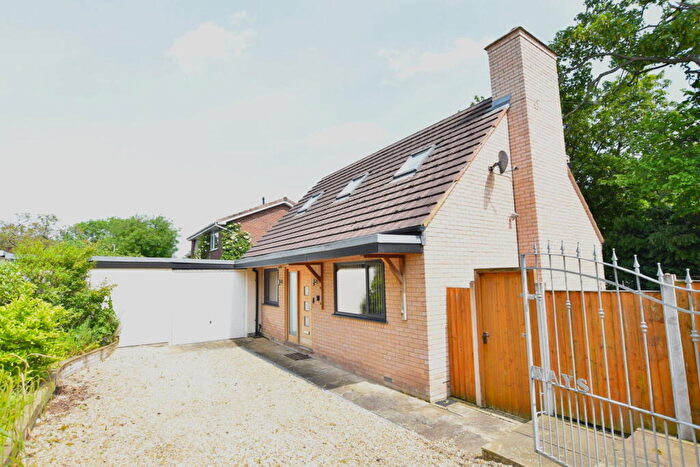
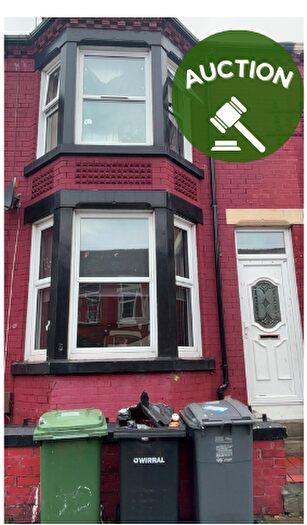
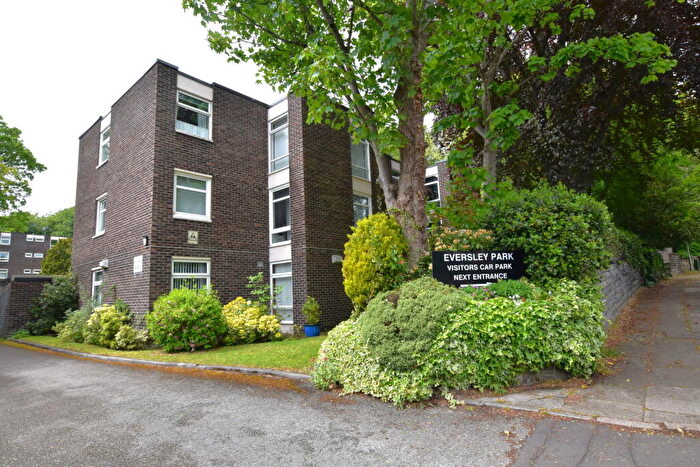
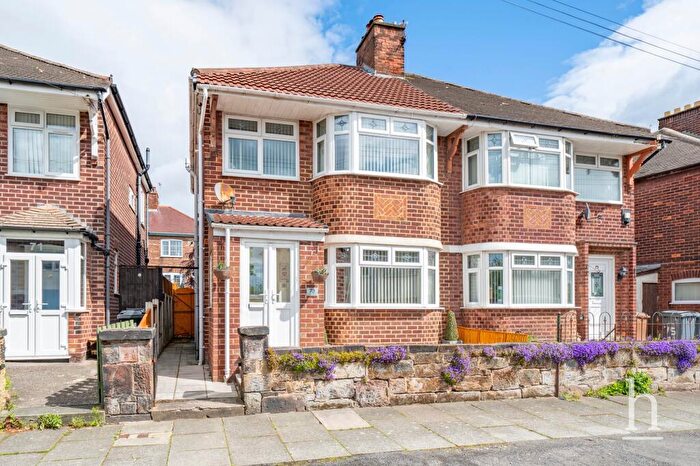
Properties for sale in Prenton
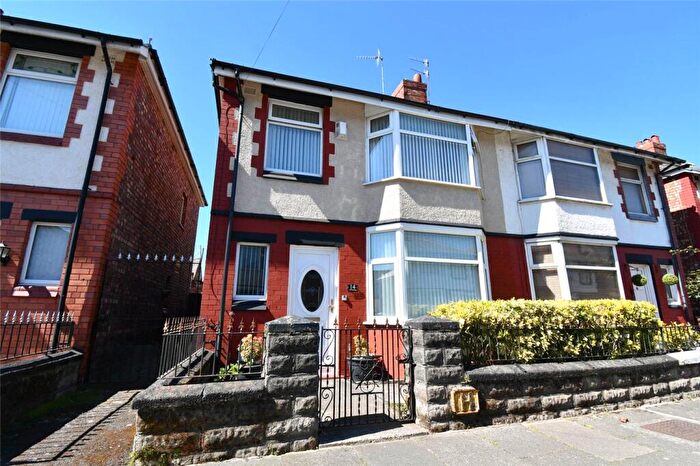
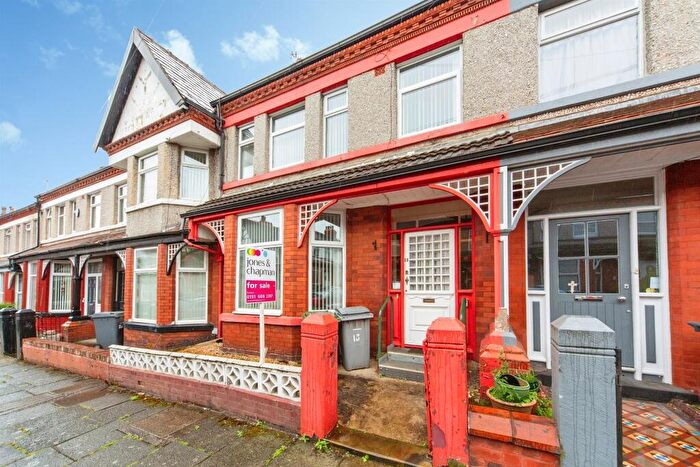
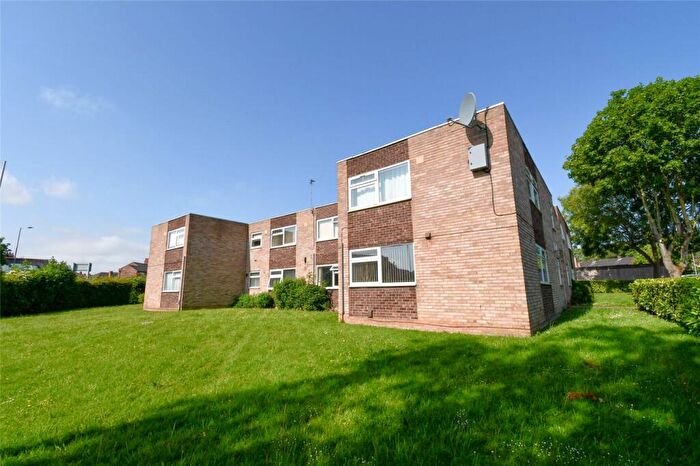
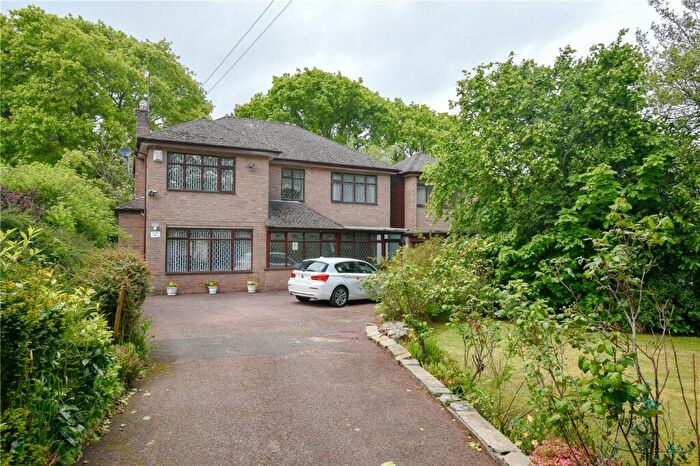
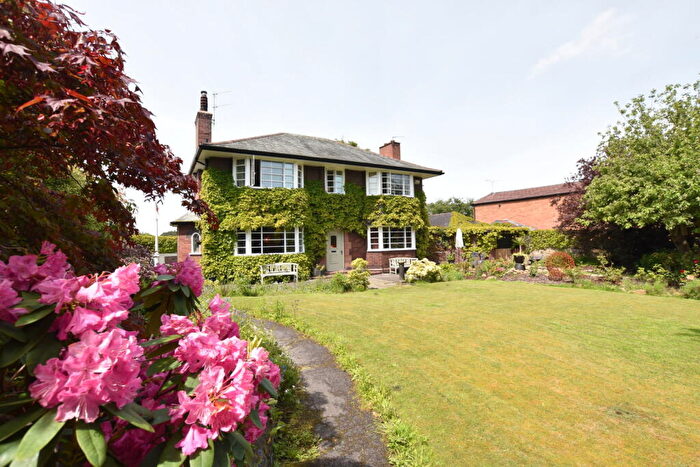
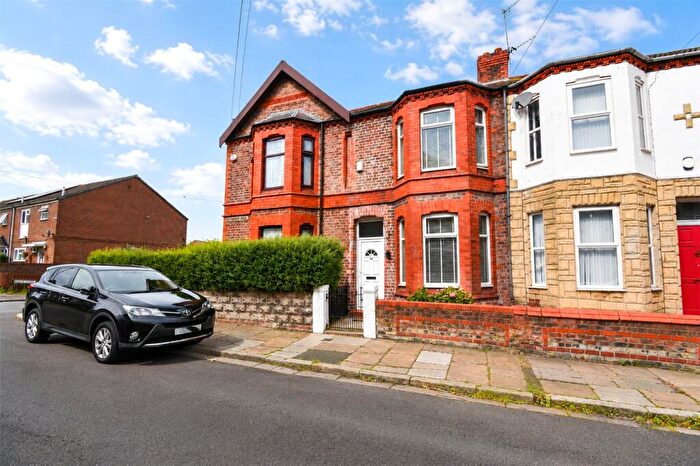
![]()
If you are looking to sell your house, let it out, or receive a property valuation, an expert can help you.
Click the button below to get started.

Roads and Postcodes in Prenton
Navigate through our locations to find the location of your next house in Prenton, Birkenhead for sale or to rent.
Transport near Prenton
-
 Rock Ferry Station
 -
Green Lane Station
-
Birkenhead Central Station
-
Conway Park Station
-
Bebington Station
-
Birkenhead Park Station
-
Birkenhead Hamilton Square Station
-
Port Sunlight Station
-
Upton Station
-
Birkenhead North Station
- FAQ
- Price Paid By Year
- Property Type Price
Frequently asked questions about Prenton
What is the average price for a property for sale in Prenton?
The average price for a property for sale in Prenton is £227,127. This amount is 62% higher than the average price in Birkenhead. There are 1,029 property listings for sale in Prenton.
What streets have the most expensive properties for sale in Prenton?
The streets with the most expensive properties for sale in Prenton are Mountwood Road at an average of £863,750, Golf Links Road at an average of £795,000 and Reservoir Road North at an average of £720,000.
What streets have the most affordable properties for sale in Prenton?
The streets with the most affordable properties for sale in Prenton are Woodchurch Road at an average of £102,500, Acrefield Road at an average of £110,000 and Prenton Park Road at an average of £126,025.
Which train stations are available in or near Prenton?
Some of the train stations available in or near Prenton are Rock Ferry, Green Lane and Birkenhead Central.
Property Price Paid in Prenton by Year
The average sold property price by year was:
| Year | Average Sold Price | Price Change |
Sold Properties
|
|---|---|---|---|
| 2026 | £191,500 | -24% |
3 Properties |
| 2025 | £237,924 | 3% |
141 Properties |
| 2024 | £231,114 | 9% |
141 Properties |
| 2023 | £210,366 | 0,4% |
118 Properties |
| 2022 | £209,486 | -3% |
146 Properties |
| 2021 | £216,669 | 13% |
162 Properties |
| 2020 | £189,011 | -2% |
116 Properties |
| 2019 | £193,408 | 8% |
129 Properties |
| 2018 | £177,314 | 6% |
157 Properties |
| 2017 | £166,752 | -3% |
177 Properties |
| 2016 | £170,937 | 5% |
151 Properties |
| 2015 | £163,027 | -5% |
127 Properties |
| 2014 | £171,517 | 16% |
140 Properties |
| 2013 | £144,624 | -23% |
104 Properties |
| 2012 | £177,408 | 1% |
77 Properties |
| 2011 | £176,002 | 9% |
71 Properties |
| 2010 | £160,118 | -1% |
75 Properties |
| 2009 | £162,069 | 0,2% |
70 Properties |
| 2008 | £161,762 | -3% |
85 Properties |
| 2007 | £166,165 | 13% |
178 Properties |
| 2006 | £144,367 | 1% |
192 Properties |
| 2005 | £142,280 | 2% |
176 Properties |
| 2004 | £139,522 | 19% |
183 Properties |
| 2003 | £113,310 | 17% |
186 Properties |
| 2002 | £94,071 | 17% |
192 Properties |
| 2001 | £77,899 | 14% |
186 Properties |
| 2000 | £66,607 | 2% |
163 Properties |
| 1999 | £65,407 | 14% |
160 Properties |
| 1998 | £56,249 | 2% |
153 Properties |
| 1997 | £55,355 | 14% |
131 Properties |
| 1996 | £47,726 | 5% |
123 Properties |
| 1995 | £45,482 | - |
107 Properties |
Property Price per Property Type in Prenton
Here you can find historic sold price data in order to help with your property search.
The average Property Paid Price for specific property types in the last three years are:
| Property Type | Average Sold Price | Sold Properties |
|---|---|---|
| Flat | £123,814.00 | 35 Flats |
| Semi Detached House | £226,443.00 | 184 Semi Detached Houses |
| Detached House | £466,598.00 | 51 Detached Houses |
| Terraced House | £163,433.00 | 133 Terraced Houses |