Houses for sale & to rent in Charvil, Reading
House Prices in Charvil
Properties in Charvil have an average house price of £649,866.00 and had 109 Property Transactions within the last 3 years¹.
Charvil is an area in Reading, Wokingham with 1,098 households², where the most expensive property was sold for £1,850,000.00.
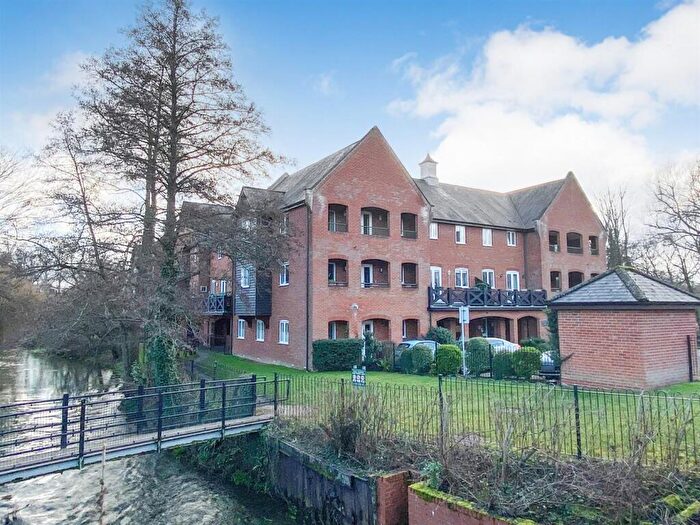
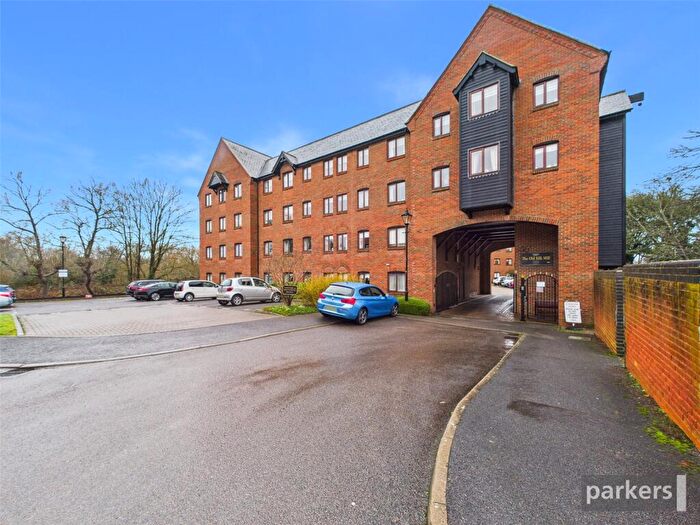
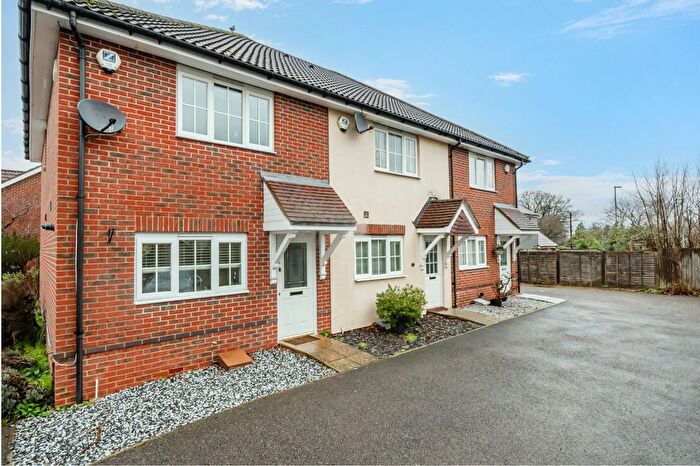
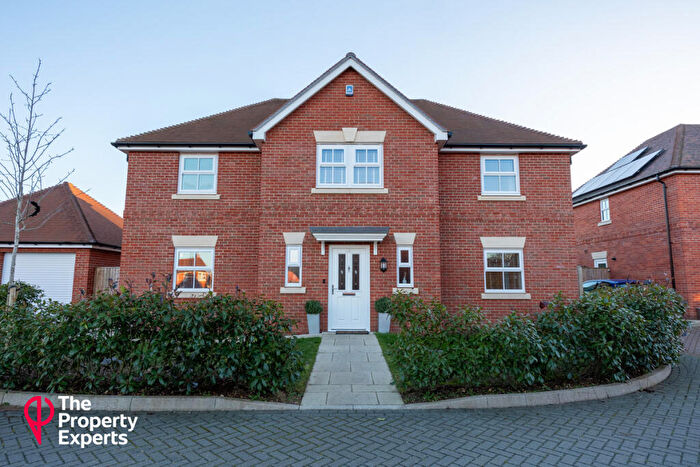
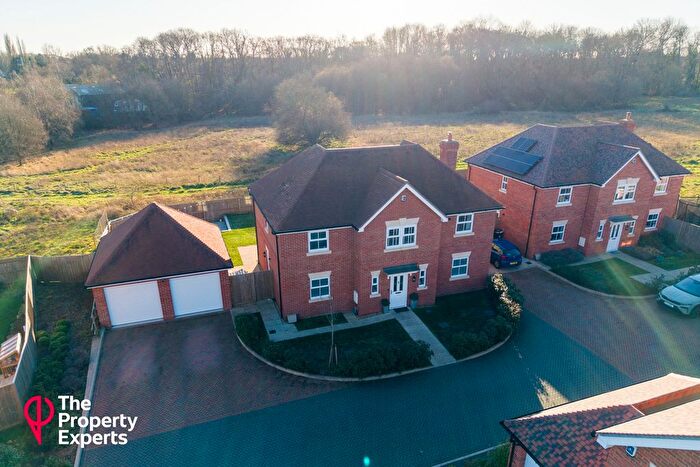
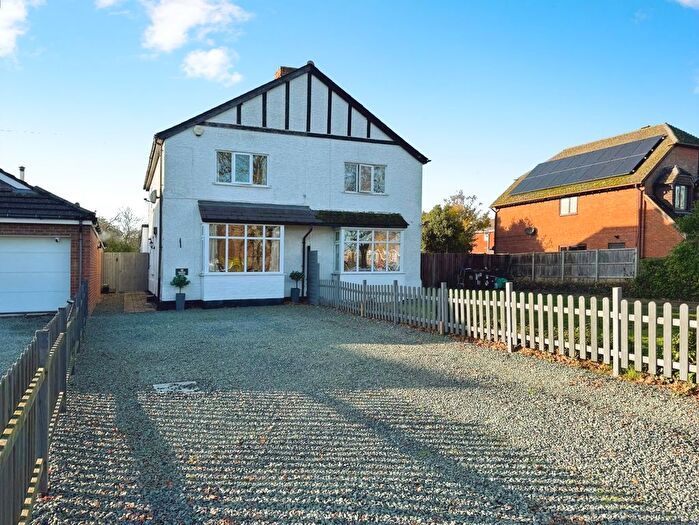
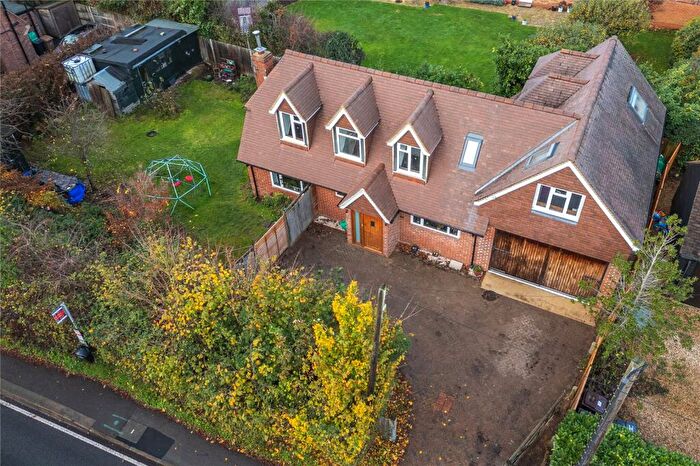
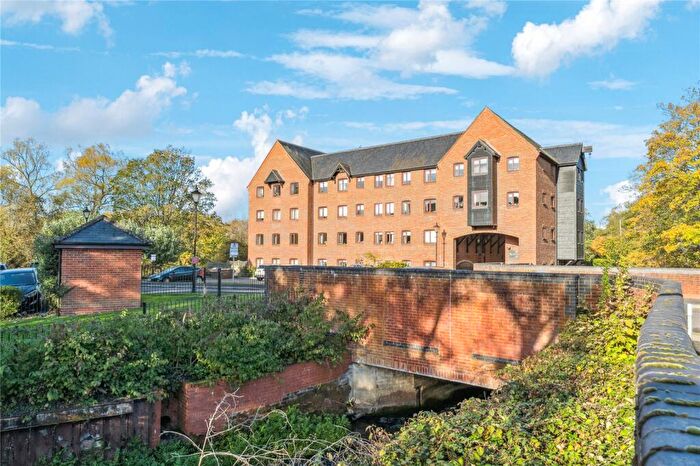
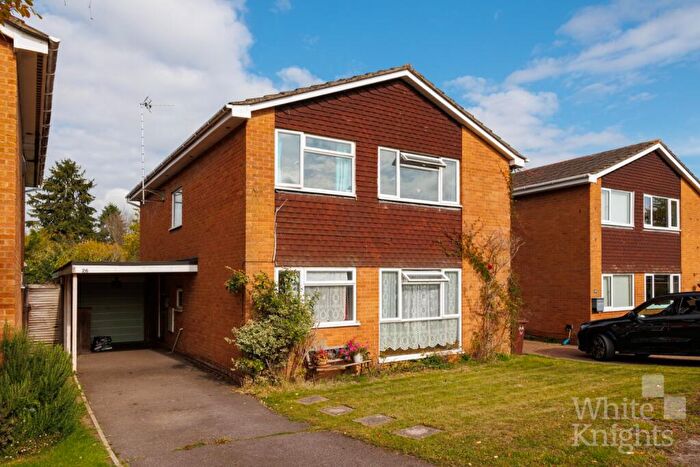
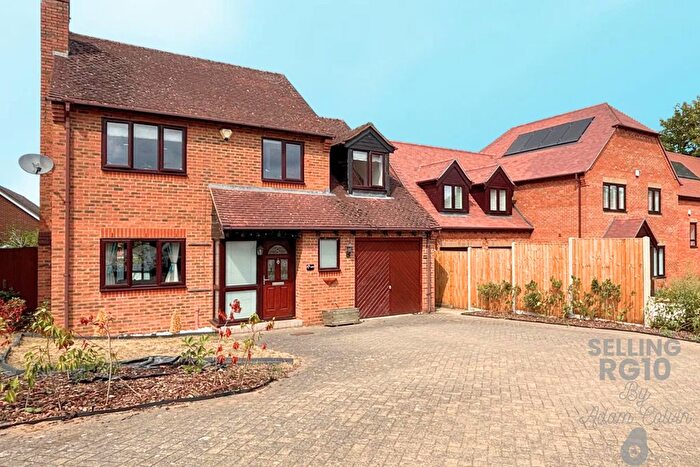
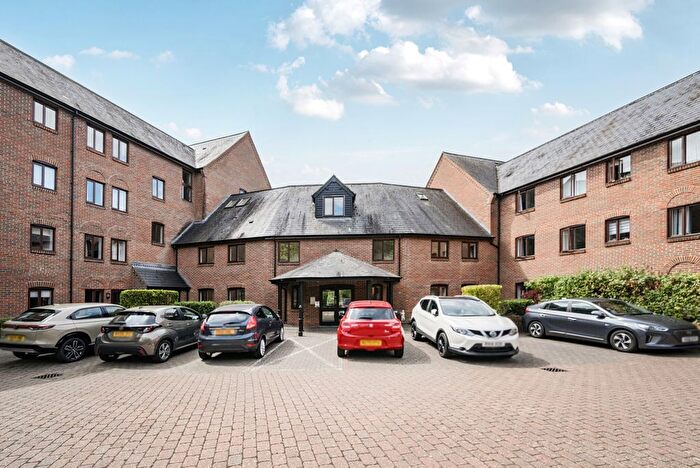
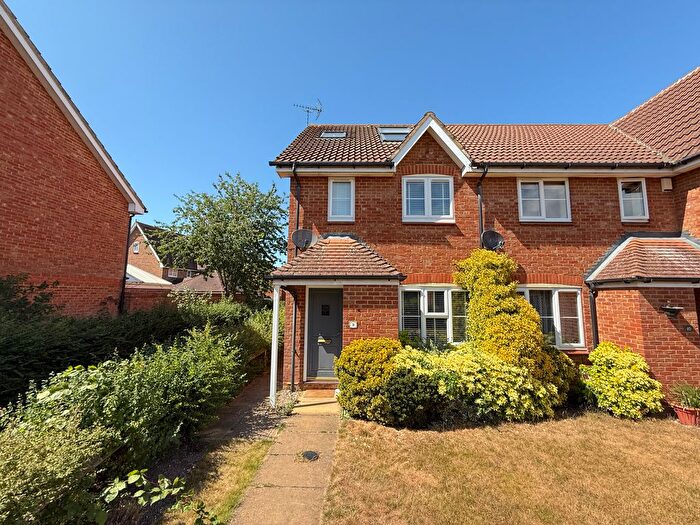
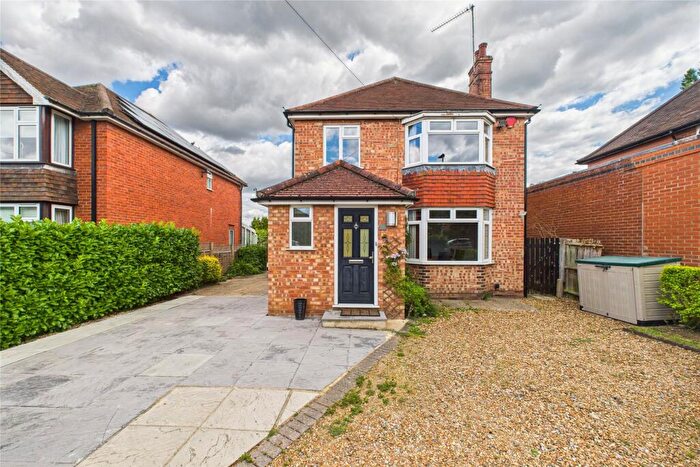
Properties for sale in Charvil
Previously listed properties in Charvil
Roads and Postcodes in Charvil
Navigate through our locations to find the location of your next house in Charvil, Reading for sale or to rent.
| Streets | Postcodes |
|---|---|
| Balme Close | RG10 9RN |
| Beggars Hill Road | RG10 0UB RG10 0UD |
| Canberra Lake Way | RG10 9DH |
| Charvil House Road | RG10 9RD |
| Charvil Meadow Road | RG10 9DX |
| Cheviot Drive | RG10 9QD |
| Chiltern Drive | RG10 9QF |
| Cleveland | RG10 9QW |
| East Park Farm Drive | RG10 9UG RG10 9UH RG10 9UJ RG10 9UL RG10 9UQ RG10 9US |
| Edward Road | RG10 9QS |
| Fairway Drive | RG10 9RE |
| Farmers End | RG10 9RZ |
| Foxes Walk | RG10 9TX |
| Gingells Farm Road | RG10 9DJ |
| Kilowna Close | RG10 9QU |
| Kingsley Close | RG10 9RB |
| Landsend Lane | RG10 0UE |
| Lime Tree Close | RG10 9FH |
| Mendip Close | RG10 9QE |
| Milestone Avenue | RG10 9TN |
| Milestone Crescent | RG10 9RG |
| New Bath Road | RG10 9DS RG10 9RL |
| Newbury Close | RG10 9RT |
| Norris Green | RG5 4RU |
| Old Acres Lane | RG10 9NP RG10 9QZ |
| Old Bath Road | RG10 9QB RG10 9QL RG10 9QN RG10 9QP RG10 9QR RG10 9QJ RG10 9RJ |
| Old Church Close | RG10 9FA |
| Park Lane | RG10 9TR RG10 9TY |
| Park View Drive North | RG10 9QY |
| Park View Drive South | RG10 9QX |
| Pennine Way | RG10 9QH |
| Pipistrelle Way | RG10 9WA |
| Quantock Close | RG10 9QQ |
| Righton Close | RG10 9UN |
| Simmons Fields | RG10 9UW |
| St Patricks Avenue | RG10 9RA |
| Strathmore Drive | RG10 9QT |
| Thames Drive | RG10 9TP |
| The Hawthorns | RG10 9TS RG10 9TT |
| Thornbers Way | RG10 9DW |
| Vale View | RG10 9SJ |
| Waingels Road | RG10 0UA |
| Wenlock Edge | RG10 9QG |
Transport near Charvil
- FAQ
- Price Paid By Year
- Property Type Price
Frequently asked questions about Charvil
What is the average price for a property for sale in Charvil?
The average price for a property for sale in Charvil is £649,866. This amount is 29% higher than the average price in Reading. There are 199 property listings for sale in Charvil.
What streets have the most expensive properties for sale in Charvil?
The streets with the most expensive properties for sale in Charvil are Thornbers Way at an average of £925,000, Balme Close at an average of £885,000 and Charvil Meadow Road at an average of £877,500.
What streets have the most affordable properties for sale in Charvil?
The streets with the most affordable properties for sale in Charvil are Cheviot Drive at an average of £307,000, Pipistrelle Way at an average of £320,000 and Mendip Close at an average of £423,500.
Which train stations are available in or near Charvil?
Some of the train stations available in or near Charvil are Twyford, Wargrave and Shiplake.
Property Price Paid in Charvil by Year
The average sold property price by year was:
| Year | Average Sold Price | Price Change |
Sold Properties
|
|---|---|---|---|
| 2025 | £649,068 | 1% |
29 Properties |
| 2024 | £644,398 | -2% |
45 Properties |
| 2023 | £657,557 | -13% |
35 Properties |
| 2022 | £740,413 | 9% |
23 Properties |
| 2021 | £672,544 | 12% |
56 Properties |
| 2020 | £594,813 | 5% |
26 Properties |
| 2019 | £566,062 | -2% |
24 Properties |
| 2018 | £577,714 | 3% |
35 Properties |
| 2017 | £557,879 | 1% |
27 Properties |
| 2016 | £550,740 | 10% |
37 Properties |
| 2015 | £494,171 | 6% |
57 Properties |
| 2014 | £463,748 | -7% |
54 Properties |
| 2013 | £496,773 | 17% |
38 Properties |
| 2012 | £412,102 | -1% |
33 Properties |
| 2011 | £417,315 | 15% |
46 Properties |
| 2010 | £354,034 | 3% |
41 Properties |
| 2009 | £342,416 | -8% |
42 Properties |
| 2008 | £371,389 | 6% |
35 Properties |
| 2007 | £349,549 | 10% |
65 Properties |
| 2006 | £316,086 | -5% |
80 Properties |
| 2005 | £330,437 | 8% |
66 Properties |
| 2004 | £305,435 | 10% |
59 Properties |
| 2003 | £274,131 | 4% |
77 Properties |
| 2002 | £264,517 | 8% |
88 Properties |
| 2001 | £242,637 | -4% |
62 Properties |
| 2000 | £253,180 | 21% |
57 Properties |
| 1999 | £200,762 | 7% |
96 Properties |
| 1998 | £187,543 | 3% |
189 Properties |
| 1997 | £181,600 | 26% |
88 Properties |
| 1996 | £134,321 | 2% |
61 Properties |
| 1995 | £131,789 | - |
45 Properties |
Property Price per Property Type in Charvil
Here you can find historic sold price data in order to help with your property search.
The average Property Paid Price for specific property types in the last three years are:
| Property Type | Average Sold Price | Sold Properties |
|---|---|---|
| Semi Detached House | £587,480.00 | 15 Semi Detached Houses |
| Detached House | £782,526.00 | 66 Detached Houses |
| Terraced House | £395,547.00 | 21 Terraced Houses |
| Flat | £295,714.00 | 7 Flats |

