
Houses for sale in RG10 0SA, Wokingham Road, Hurst, Reading
House Prices in RG10 0SA, Wokingham Road, Hurst
Properties in RG10 0SA have no sales history available within the last 3 years. RG10 0SA is a postcode in Wokingham Road located in Hurst, an area in Reading, Wokingham, with 2 households².
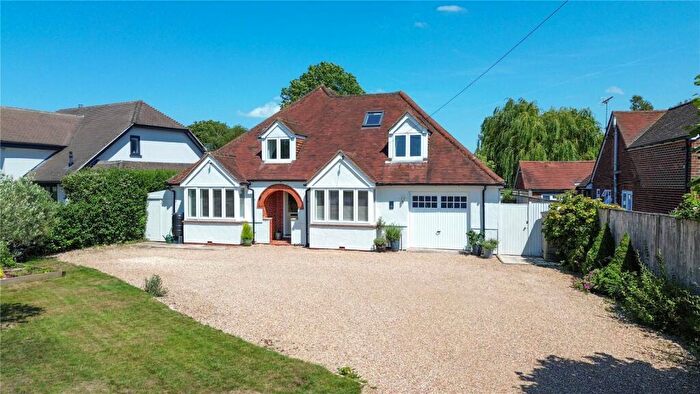
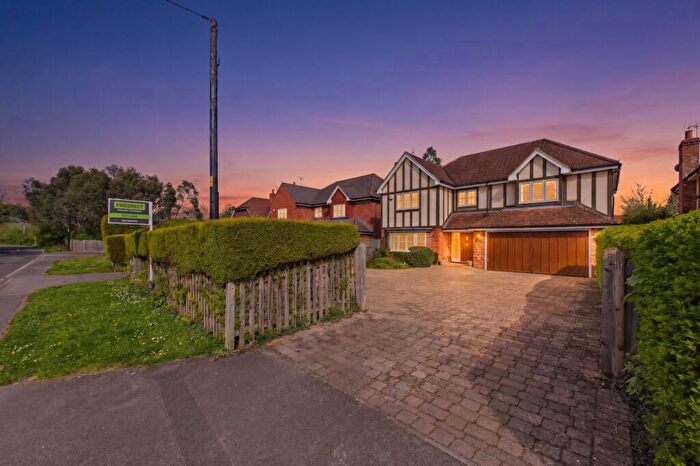
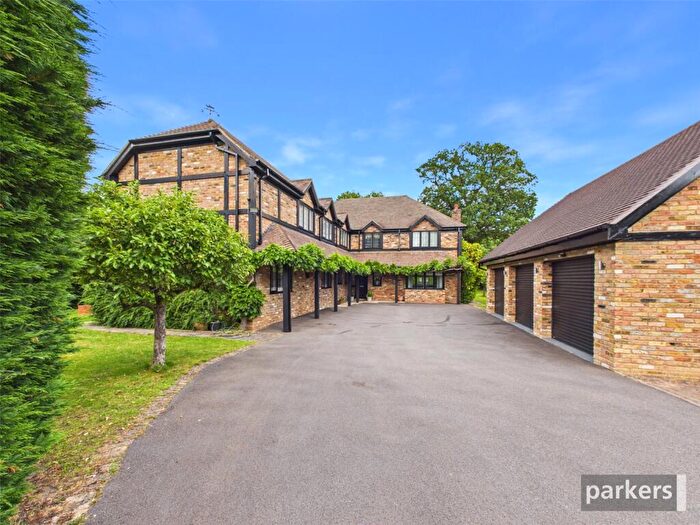
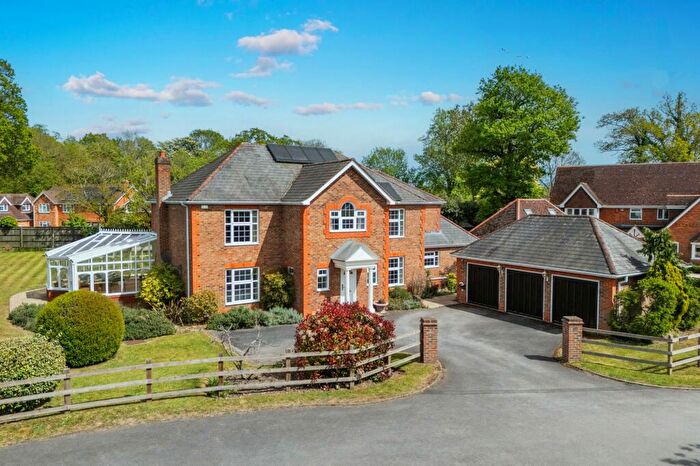
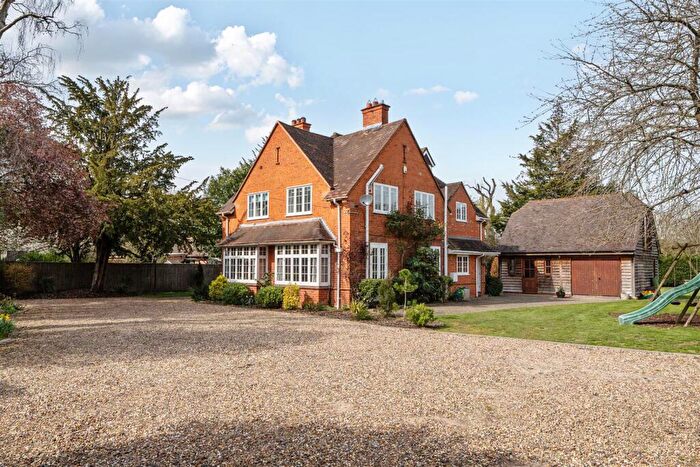
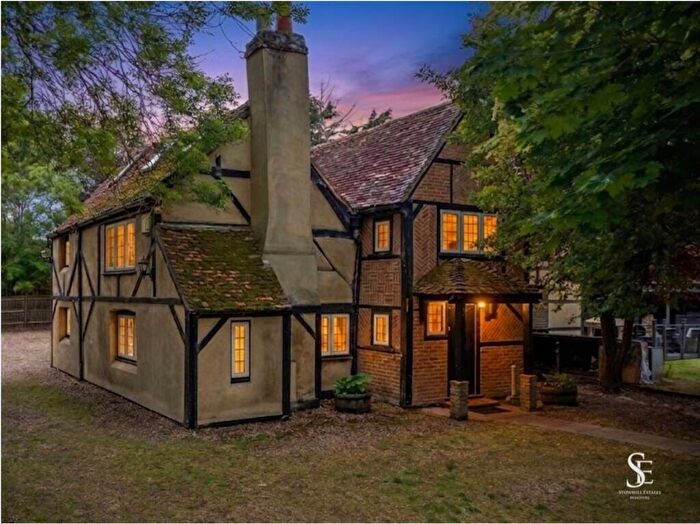
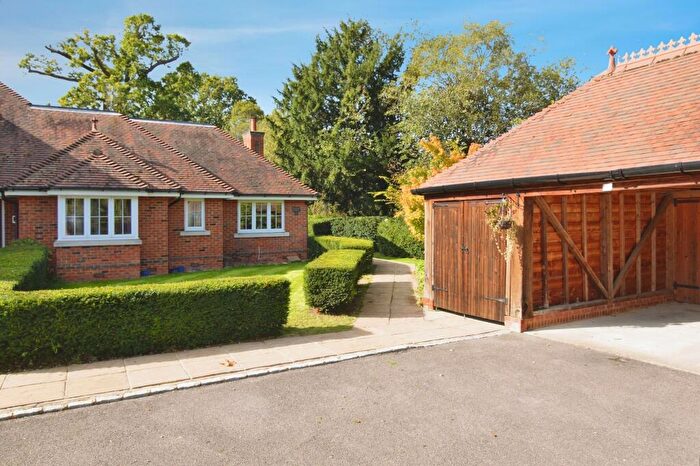
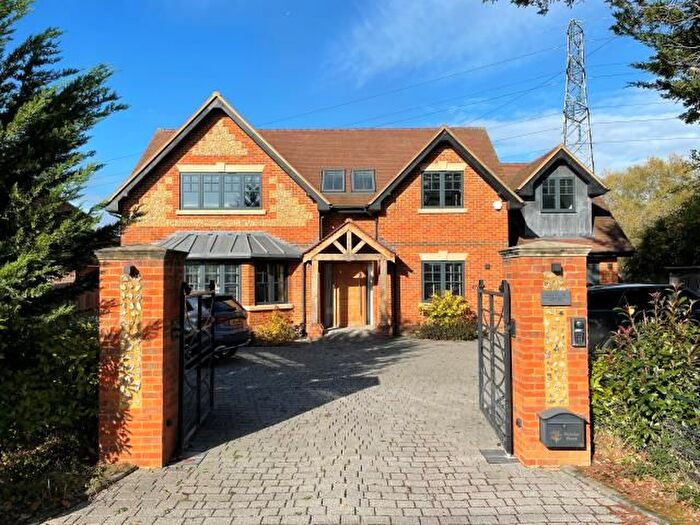
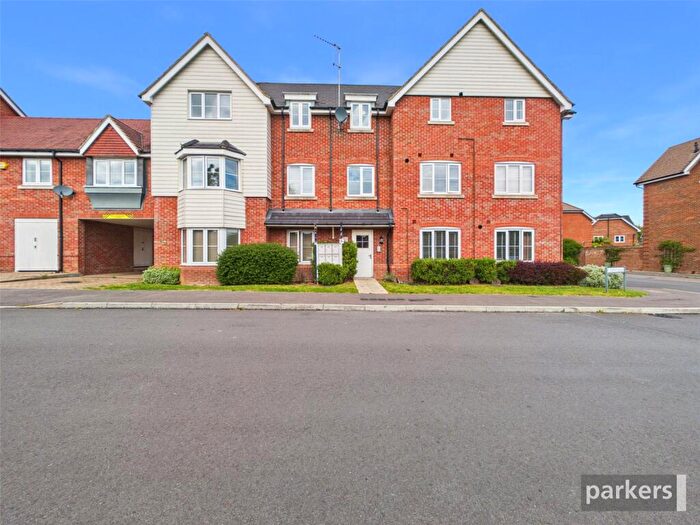
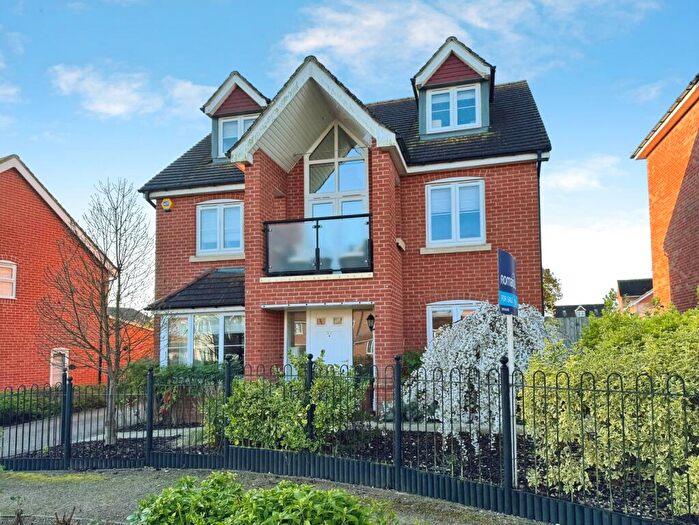
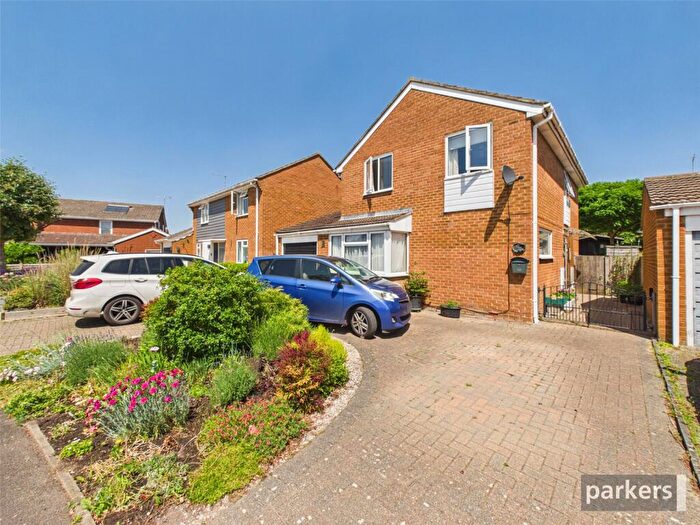
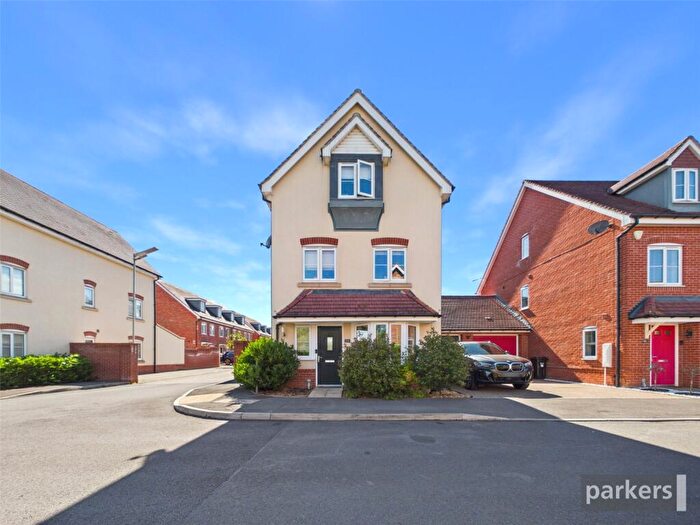
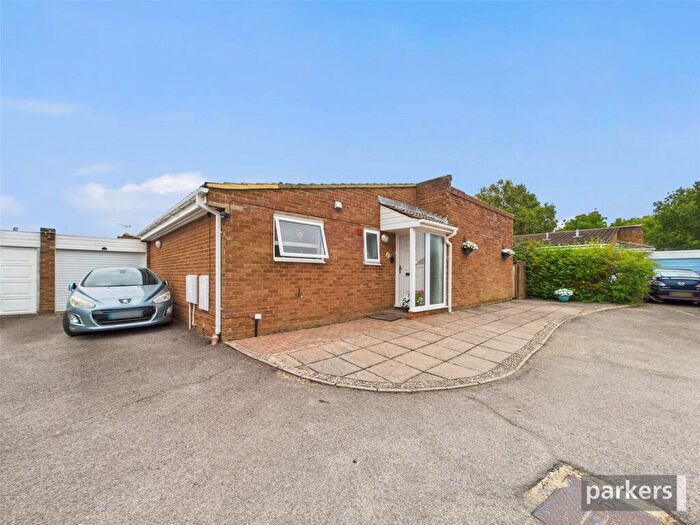
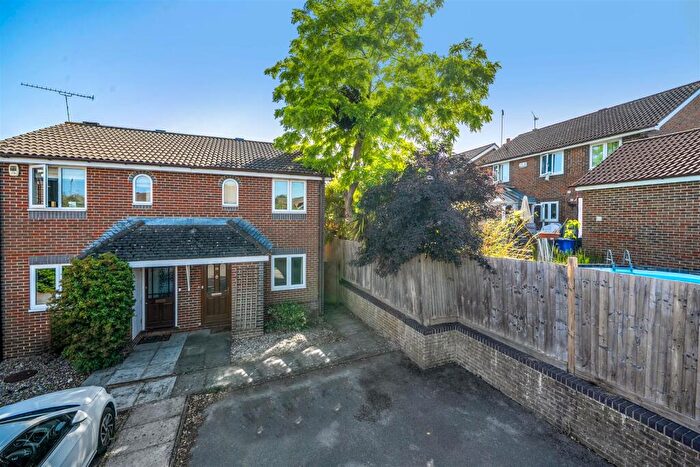
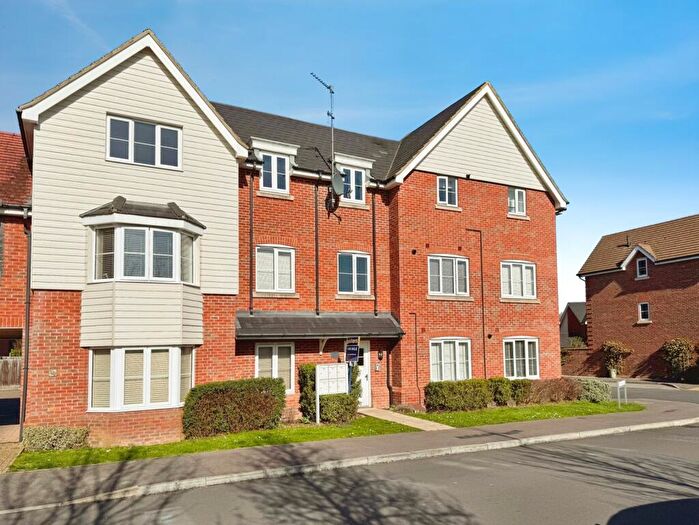
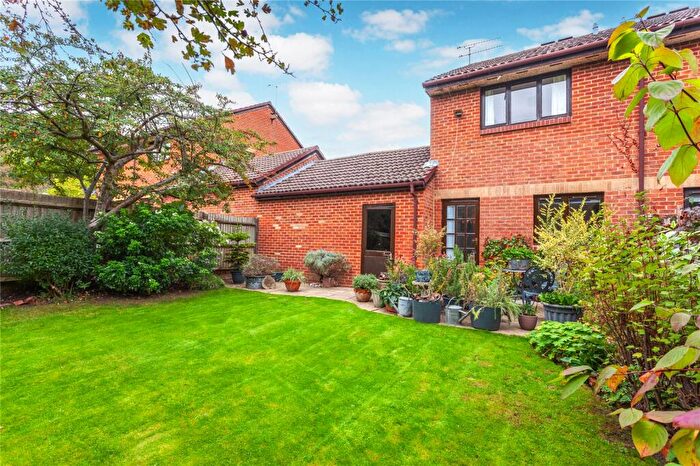
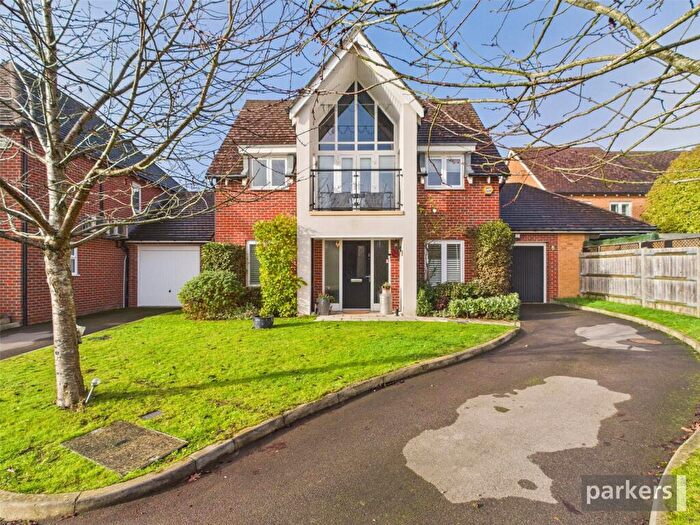
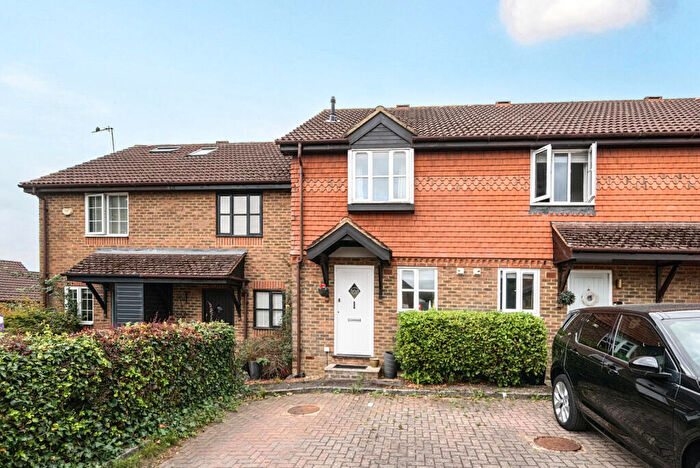
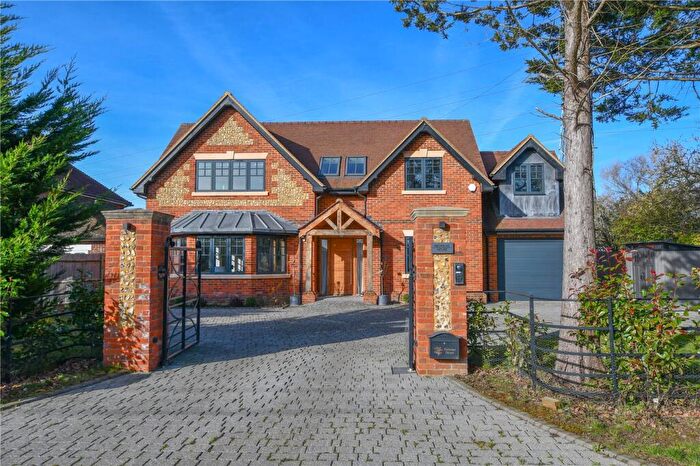
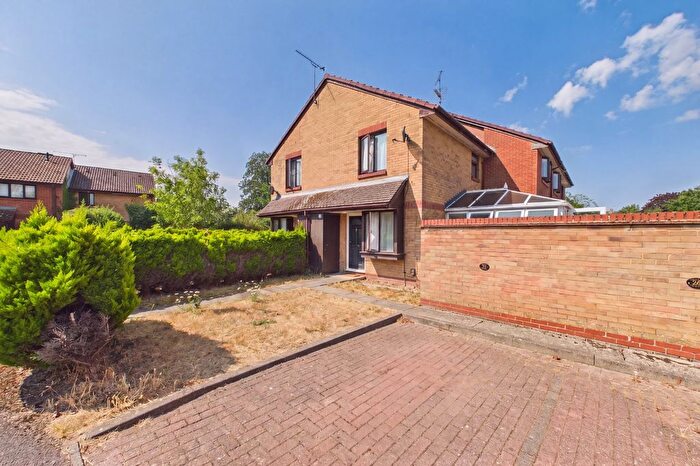
Properties for sale near RG10 0SA, Wokingham Road
![]()
If you are looking to sell your house, let it out, or receive a property valuation, an expert can help you.
Click the button below to get started.


Price Paid in Wokingham Road, RG10 0SA, Hurst
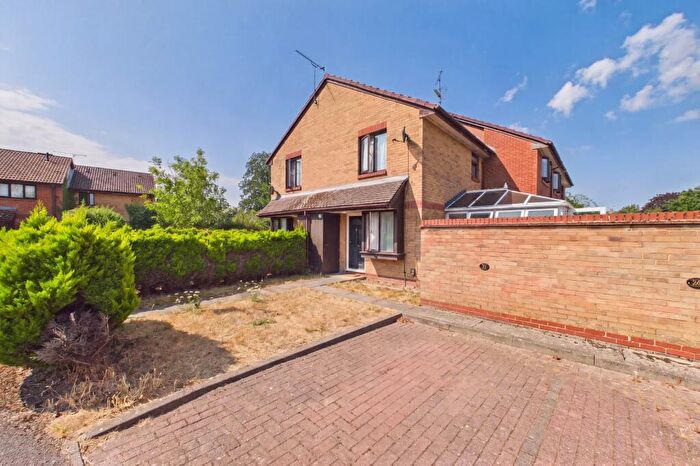
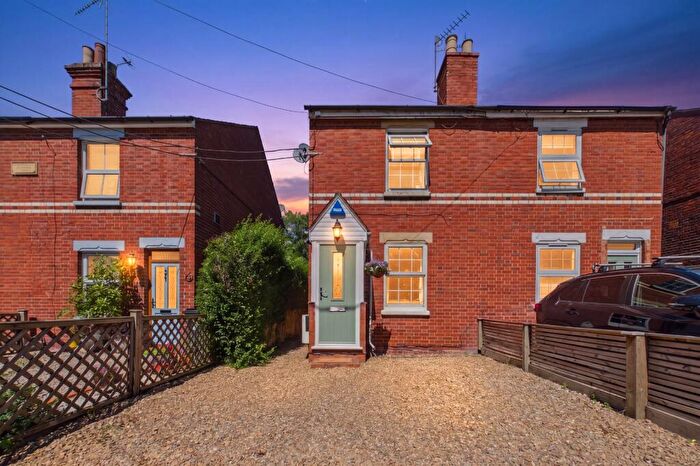
WOODLANDS COTTAGES 2 Wokingham Road, RG10 0SA, Hurst Reading
Property WOODLANDS COTTAGES 2 has been sold 4 times. The last time it was sold was in 30/04/2010 and the sold price was £274,000.00.
This is a Semi Detached House which was sold as a freehold in 30/04/2010
| Date | Price | Property Type | Tenure | Classification |
|---|---|---|---|---|
| 30/04/2010 | £274,000.00 | Semi Detached House | freehold | Established Building |
| 03/09/2004 | £269,950.00 | Semi Detached House | freehold | Established Building |
| 17/05/2002 | £217,500.00 | Semi Detached House | freehold | Established Building |
| 02/06/1999 | £134,500.00 | Semi Detached House | freehold | Established Building |
2 Woodlands Cottages Wokingham Road Hurst, RG10 0SA, Hurst Reading
This is a 70 square meter Semi-detached House with an EPC rating of D. Currently, there is no transaction history available for this property.
Postcodes in Wokingham Road, Hurst
Navigate through other locations in Wokingham Road, Hurst, Reading to see more property listings for sale or to rent.
Property price trends in RG10 0SA, Wokingham Road
According to the latest Land Registry data, the average home in RG10 0SA, Wokingham Road sold for £274,000 in 2010. That figure comes from 4 sales logged over the past 11 years.
Looking back five years, average prices are up about 1.5% since 2004, a gain of around £4,050 in cash terms.
Zoom out to the past decade for the fuller picture. Back in 1999, homes here averaged £134,500, so the typical sold price has climbed about 103.7% since then, roughly 6.7% a year.
Property Price Paid in RG10 0SA, Wokingham Road by Year
The average sold property price by year was:
| Year | Average Sold Price | Price Change |
Sold Properties
|
|---|---|---|---|
| 2010 | £274,000 | 1% |
1 Property |
| 2004 | £269,950 | 19% |
1 Property |
| 2002 | £217,500 | 38% |
1 Property |
| 1999 | £134,500 | - |
1 Property |

