
Houses for sale & to rent in Emmbrook, Wokingham
House Prices in Emmbrook
Properties in Emmbrook have an average house price of £510,883.00 and had 586 Property Transactions within the last 3 years¹.
Emmbrook is an area in Wokingham, Wokingham with 3,289 households², where the most expensive property was sold for £1,615,000.00.
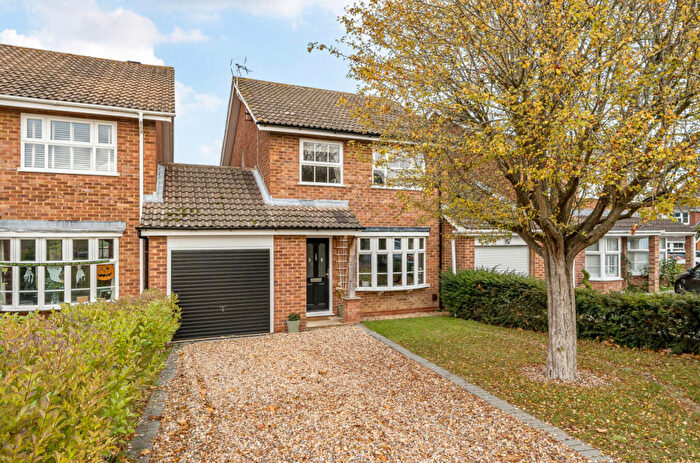
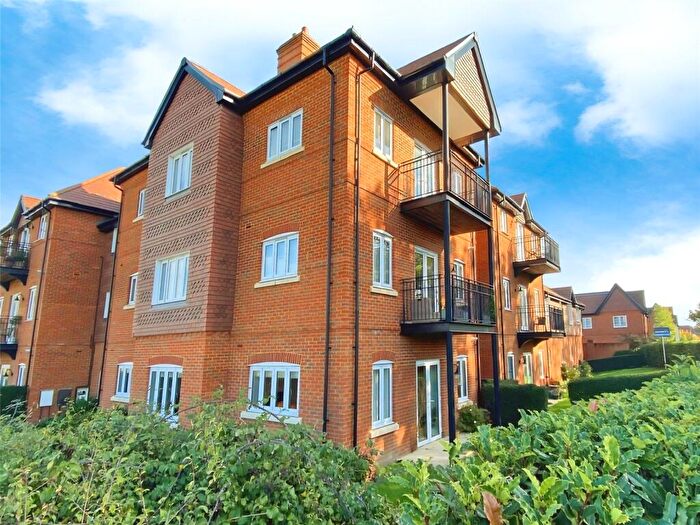
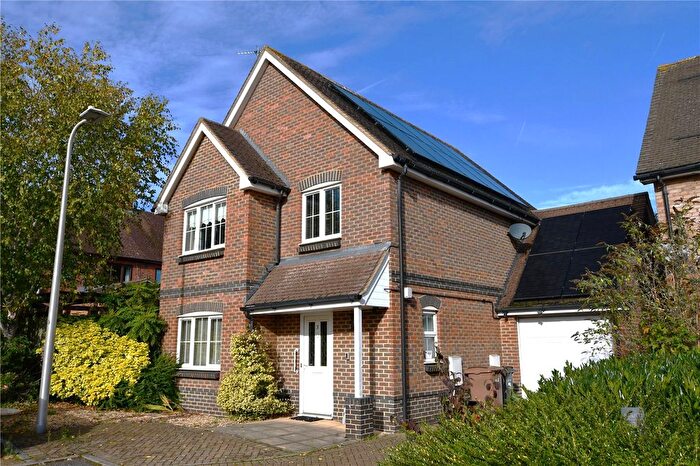
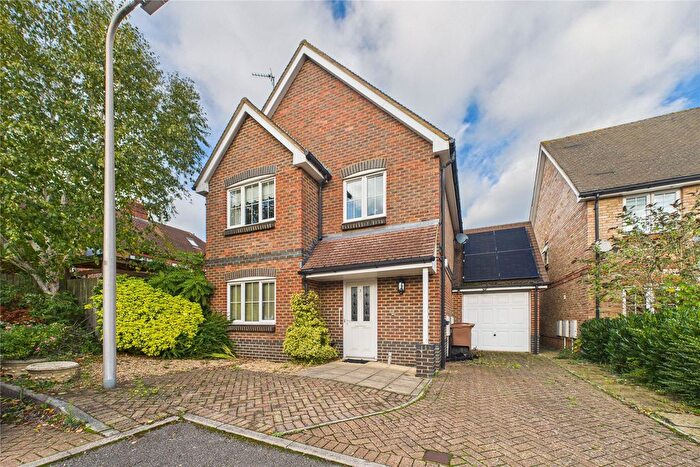
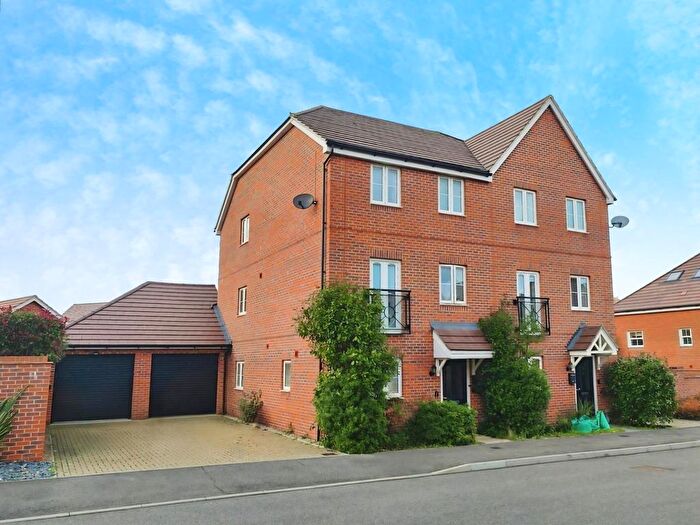
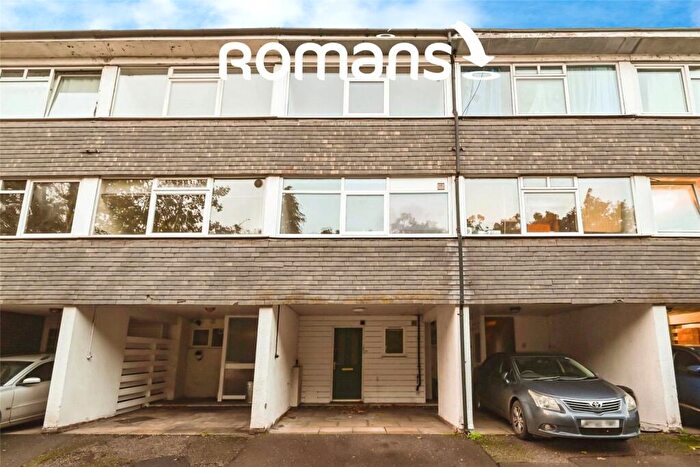
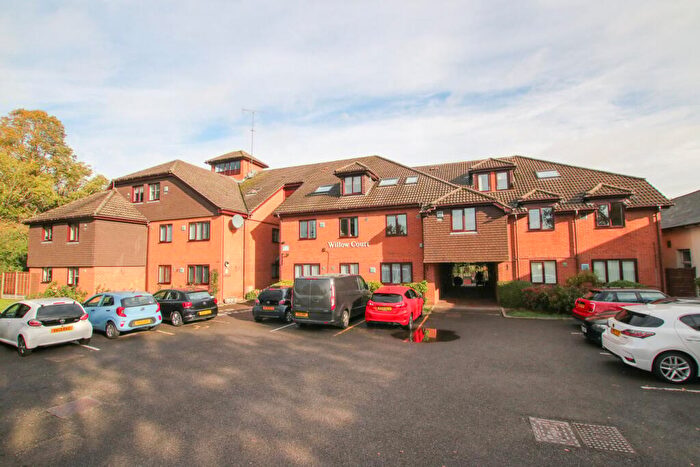
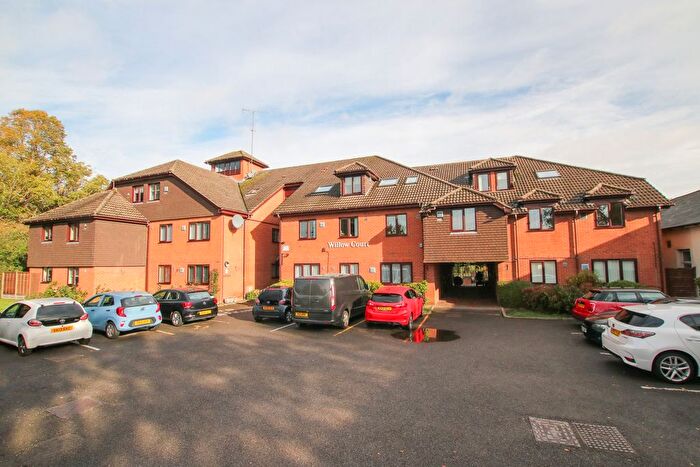
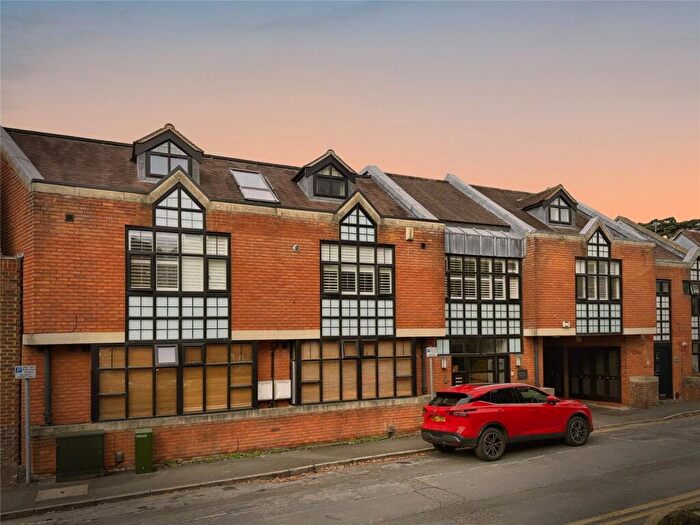
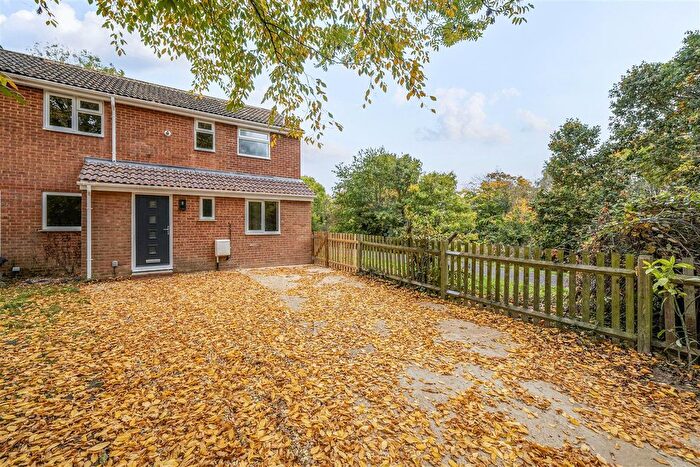
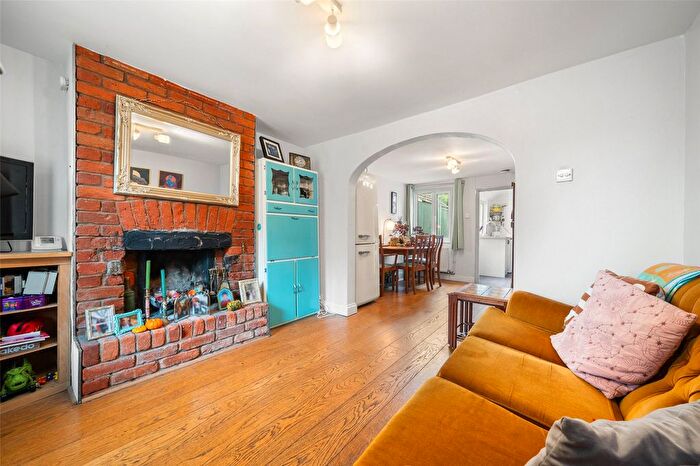
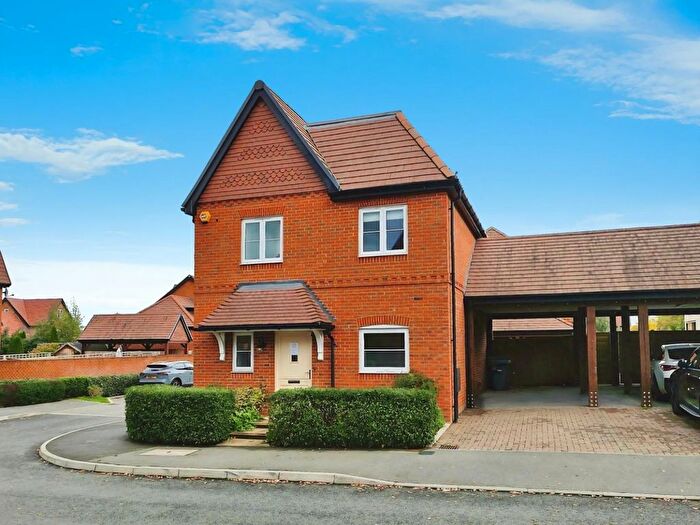
Properties for sale in Emmbrook

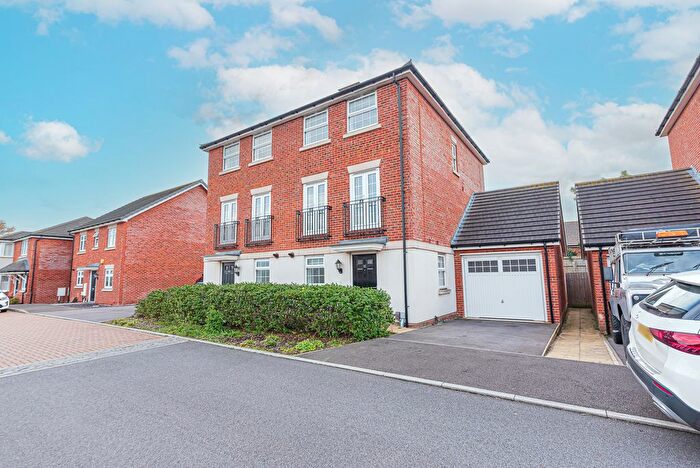
![]()
If you are looking to sell your house, let it out, or receive a property valuation, an expert can help you.
Click the button below to get started.
Roads and Postcodes in Emmbrook
Navigate through our locations to find the location of your next house in Emmbrook, Wokingham for sale or to rent.
Transport near Emmbrook

- FAQ
- Price Paid By Year
- Property Type Price
Frequently asked questions about Emmbrook
What is the average price for a property for sale in Emmbrook?
The average price for a property for sale in Emmbrook is £510,883. This amount is 5% lower than the average price in Wokingham. There are 1,548 property listings for sale in Emmbrook.
What streets have the most expensive properties for sale in Emmbrook?
The streets with the most expensive properties for sale in Emmbrook are Park Avenue at an average of £1,267,500, Villiers Mead at an average of £1,050,000 and The Terrace at an average of £985,000.
What streets have the most affordable properties for sale in Emmbrook?
The streets with the most affordable properties for sale in Emmbrook are Langman Close at an average of £195,750, Potter Crescent at an average of £216,975 and Emmview Close at an average of £218,785.
Which train stations are available in or near Emmbrook?
Some of the train stations available in or near Emmbrook are Wokingham, Winnersh and Winnersh Triangle.
Property Price Paid in Emmbrook by Year
The average sold property price by year was:
| Year | Average Sold Price | Price Change |
Sold Properties
|
|---|---|---|---|
| 2025 | £521,937 | 2% |
64 Properties |
| 2024 | £513,237 | -3% |
143 Properties |
| 2023 | £526,757 | 7% |
193 Properties |
| 2022 | £488,800 | 5% |
186 Properties |
| 2021 | £462,918 | 5% |
261 Properties |
| 2020 | £437,509 | -6% |
187 Properties |
| 2019 | £464,601 | 13% |
195 Properties |
| 2018 | £404,204 | -8% |
209 Properties |
| 2017 | £435,148 | 3% |
247 Properties |
| 2016 | £423,108 | 13% |
208 Properties |
| 2015 | £368,067 | 7% |
233 Properties |
| 2014 | £343,754 | 11% |
239 Properties |
| 2013 | £305,020 | -5% |
202 Properties |
| 2012 | £319,436 | 3% |
141 Properties |
| 2011 | £309,927 | -3% |
127 Properties |
| 2010 | £318,609 | 11% |
129 Properties |
| 2009 | £282,002 | -11% |
162 Properties |
| 2008 | £311,868 | 5% |
107 Properties |
| 2007 | £296,307 | 1% |
190 Properties |
| 2006 | £293,626 | 8% |
222 Properties |
| 2005 | £269,997 | 5% |
178 Properties |
| 2004 | £256,101 | 6% |
211 Properties |
| 2003 | £239,502 | 5% |
178 Properties |
| 2002 | £227,997 | 10% |
200 Properties |
| 2001 | £204,900 | 16% |
179 Properties |
| 2000 | £172,087 | 12% |
172 Properties |
| 1999 | £151,877 | 16% |
186 Properties |
| 1998 | £127,450 | 6% |
142 Properties |
| 1997 | £119,281 | 19% |
186 Properties |
| 1996 | £96,211 | 3% |
183 Properties |
| 1995 | £93,497 | - |
152 Properties |
Property Price per Property Type in Emmbrook
Here you can find historic sold price data in order to help with your property search.
The average Property Paid Price for specific property types in the last three years are:
| Property Type | Average Sold Price | Sold Properties |
|---|---|---|
| Flat | £306,492.00 | 139 Flats |
| Semi Detached House | £511,503.00 | 147 Semi Detached Houses |
| Detached House | £708,705.00 | 185 Detached Houses |
| Terraced House | £438,904.00 | 115 Terraced Houses |