
Houses for sale & to rent in Wescott, Wokingham
House Prices in Wescott
Properties in Wescott have an average house price of £483k and had 369 Property Transactions within the last 3 years¹.
Wescott is an area in Wokingham, Wokingham with 2,276 households², where the most expensive property was sold for £1.75M.
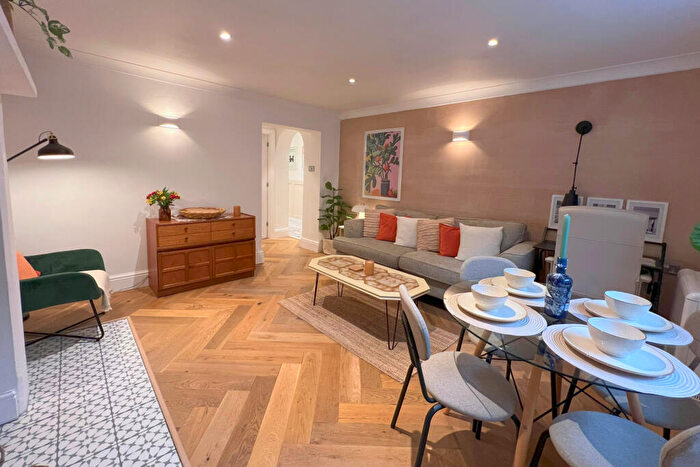
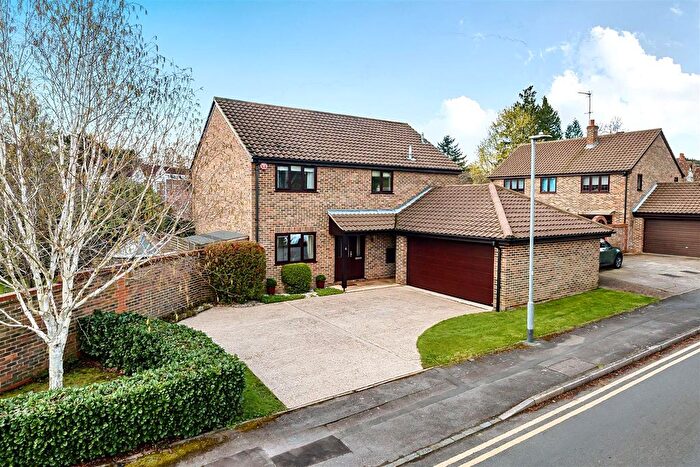
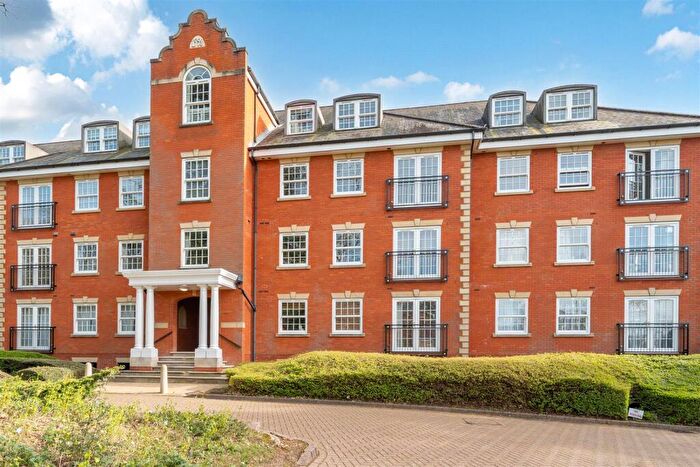
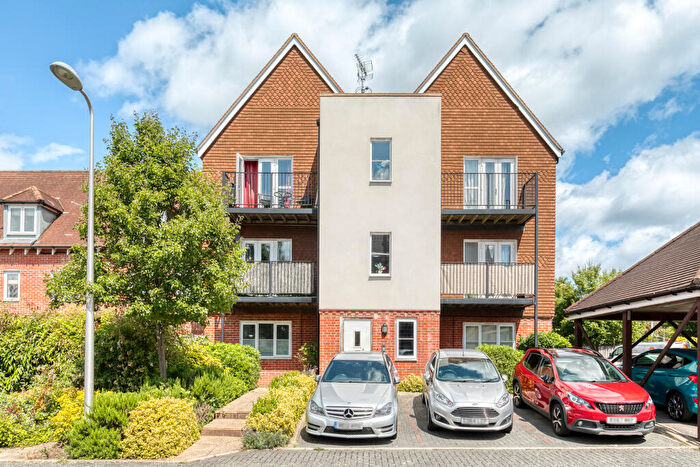
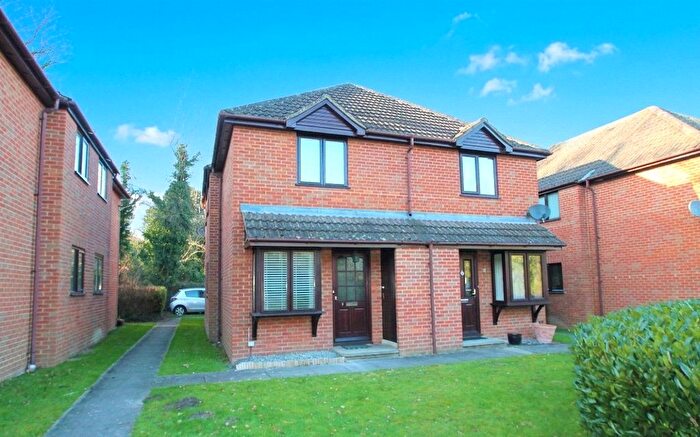
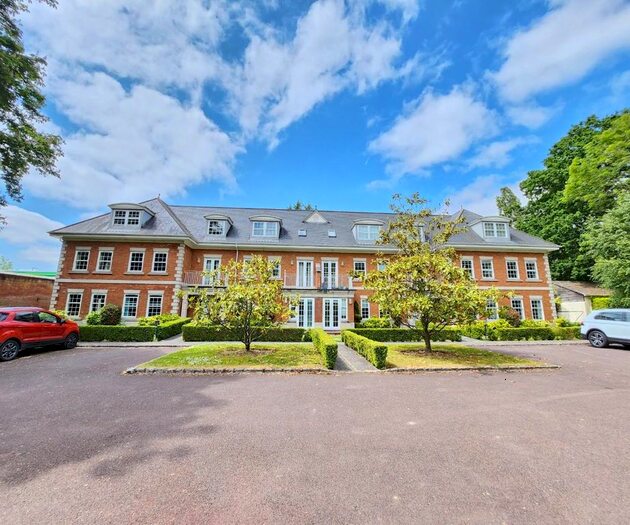
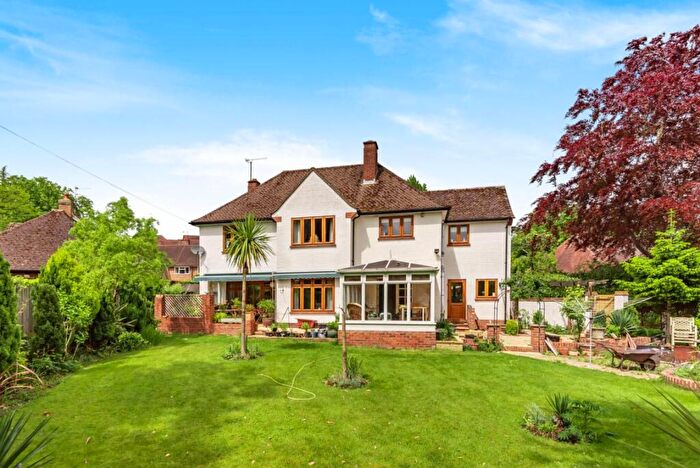
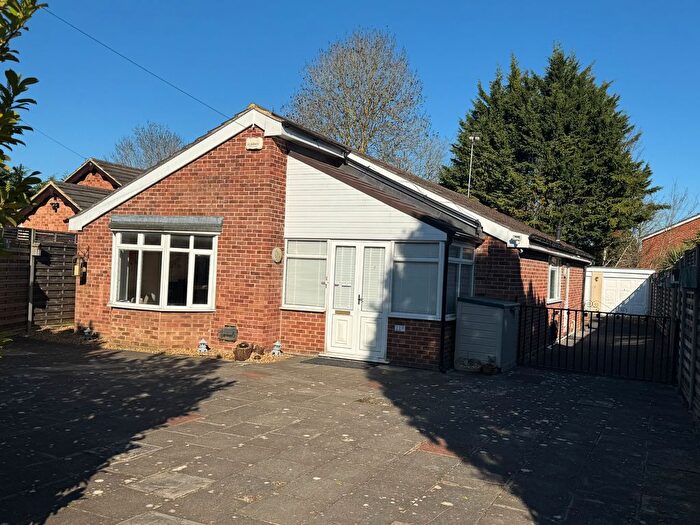
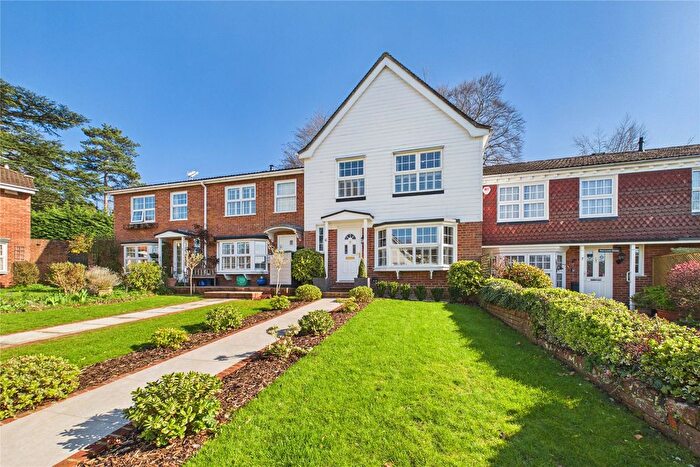
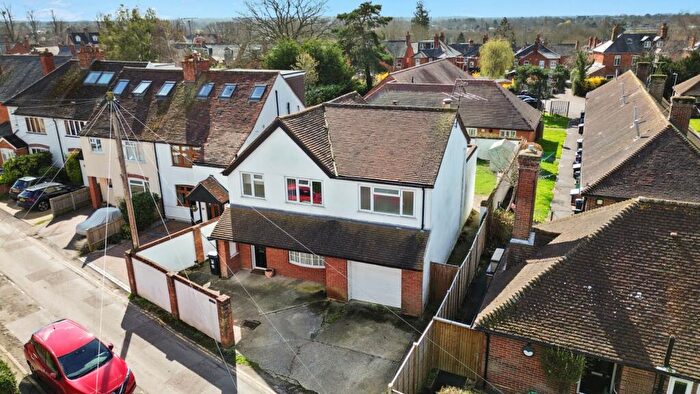
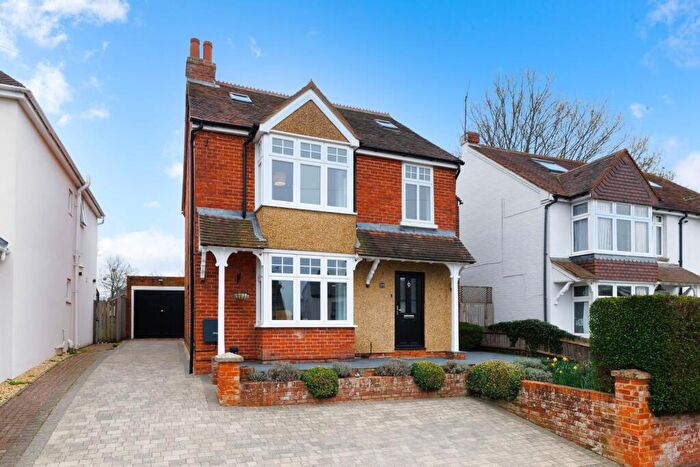
Properties for sale in Wescott


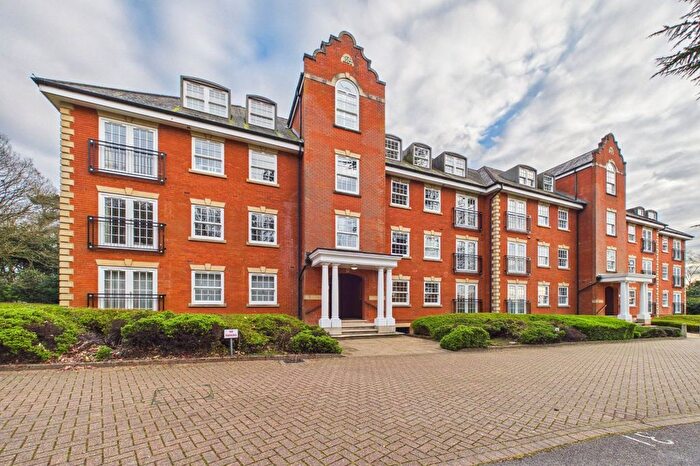
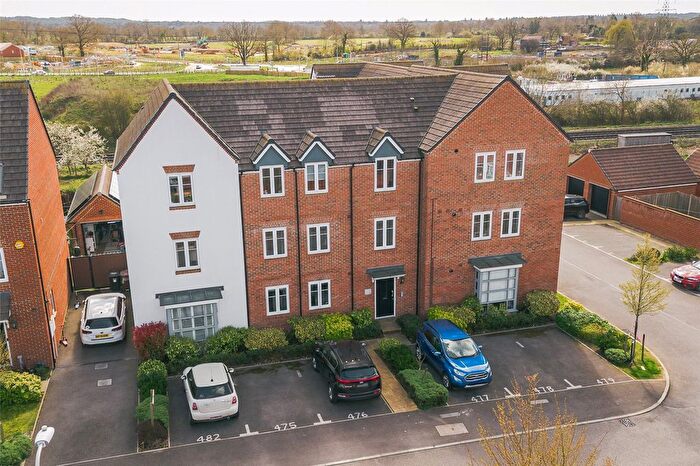
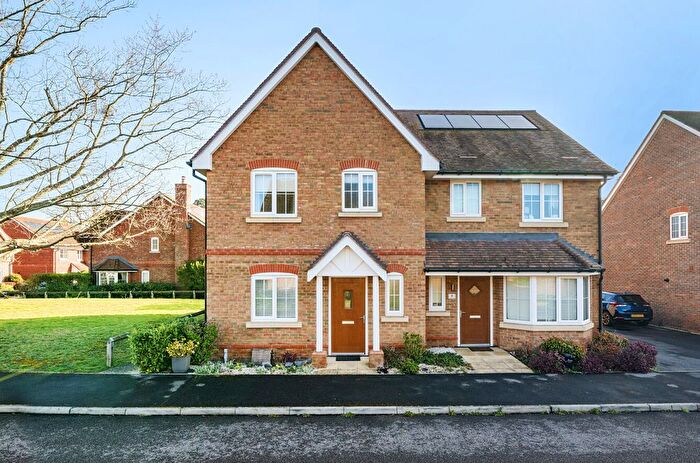
![]()
If you are looking to sell your house, let it out, or receive a property valuation, an expert can help you.
Click the button below to get started.


Roads and Postcodes in Wescott
Navigate through our locations to find the location of your next house in Wescott, Wokingham for sale or to rent.
Transport near Wescott

- FAQ
- Price Paid By Year
- Property Type Price
Frequently asked questions about Wescott
What is the average price for a property for sale in Wescott?
The average price for a property for sale in Wescott is £483,408. This amount is 11% lower than the average price in Wokingham. There are 3,689 property listings for sale in Wescott.
What streets have the most expensive properties for sale in Wescott?
The streets with the most expensive properties for sale in Wescott are Buckhurst Grove at an average of £1,232,500, Sandhurst Road at an average of £1,125,000 and Hart Dyke Close at an average of £1,010,000.
What streets have the most affordable properties for sale in Wescott?
The streets with the most affordable properties for sale in Wescott are Oak View at an average of £210,000, Denmark Street at an average of £217,375 and Elms Road at an average of £231,833.
Which train stations are available in or near Wescott?
Some of the train stations available in or near Wescott are Wokingham, Winnersh and Crowthorne.
Property Price Paid in Wescott by Year
The average sold property price by year was:
| Year | Average Sold Price | Price Change |
Sold Properties
|
|---|---|---|---|
| 2026 | £705,000 | 30% |
1 Property |
| 2025 | £496,059 | 2% |
102 Properties |
| 2024 | £483,931 | 3% |
151 Properties |
| 2023 | £469,573 | 3% |
115 Properties |
| 2022 | £456,063 | -0,2% |
131 Properties |
| 2021 | £457,095 | 3% |
197 Properties |
| 2020 | £444,609 | 1% |
119 Properties |
| 2019 | £438,671 | 9% |
149 Properties |
| 2018 | £401,189 | -17% |
197 Properties |
| 2017 | £467,426 | -3% |
188 Properties |
| 2016 | £480,619 | 18% |
161 Properties |
| 2015 | £396,389 | 1% |
206 Properties |
| 2014 | £392,426 | 17% |
141 Properties |
| 2013 | £326,359 | -4% |
100 Properties |
| 2012 | £338,764 | -10% |
77 Properties |
| 2011 | £371,132 | 6% |
96 Properties |
| 2010 | £347,992 | 9% |
89 Properties |
| 2009 | £318,088 | 9% |
103 Properties |
| 2008 | £289,468 | -29% |
91 Properties |
| 2007 | £372,067 | 18% |
169 Properties |
| 2006 | £305,516 | 17% |
172 Properties |
| 2005 | £254,287 | -1% |
117 Properties |
| 2004 | £256,827 | -5% |
161 Properties |
| 2003 | £270,141 | 18% |
137 Properties |
| 2002 | £221,553 | -3% |
172 Properties |
| 2001 | £227,641 | 19% |
157 Properties |
| 2000 | £184,865 | 18% |
134 Properties |
| 1999 | £152,151 | 17% |
165 Properties |
| 1998 | £126,268 | -1% |
136 Properties |
| 1997 | £127,388 | 12% |
149 Properties |
| 1996 | £111,891 | 14% |
131 Properties |
| 1995 | £96,075 | - |
104 Properties |
Property Price per Property Type in Wescott
Here you can find historic sold price data in order to help with your property search.
The average Property Paid Price for specific property types in the last three years are:
| Property Type | Average Sold Price | Sold Properties |
|---|---|---|
| Flat | £276,890.00 | 155 Flats |
| Semi Detached House | £513,435.00 | 72 Semi Detached Houses |
| Detached House | £863,417.00 | 86 Detached Houses |
| Terraced House | £432,828.00 | 56 Terraced Houses |