
Houses for sale & to rent in Hurst, Wokingham
House Prices in Hurst
Properties in Hurst have an average house price of £979k and had 7 Property Transactions within the last 3 years¹.
Hurst is an area in Wokingham, Wokingham with 124 households², where the most expensive property was sold for £1.63M.
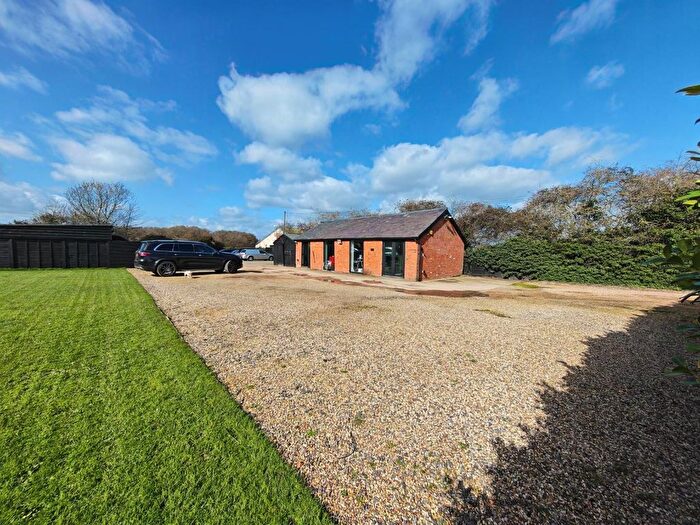
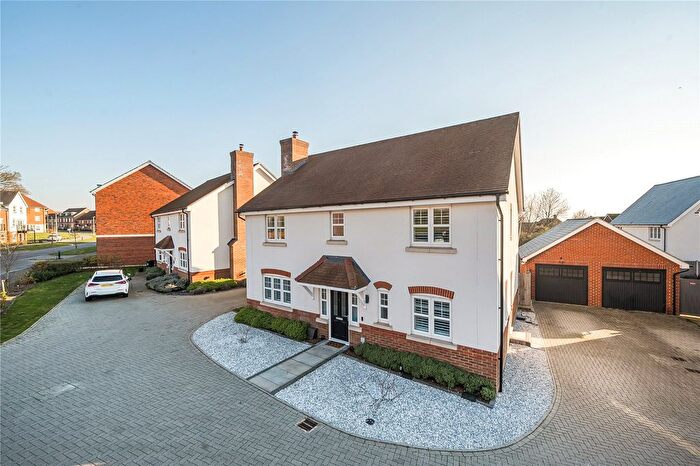
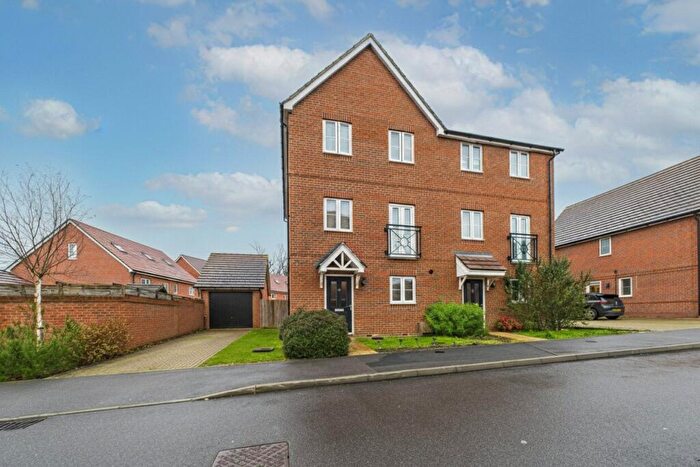
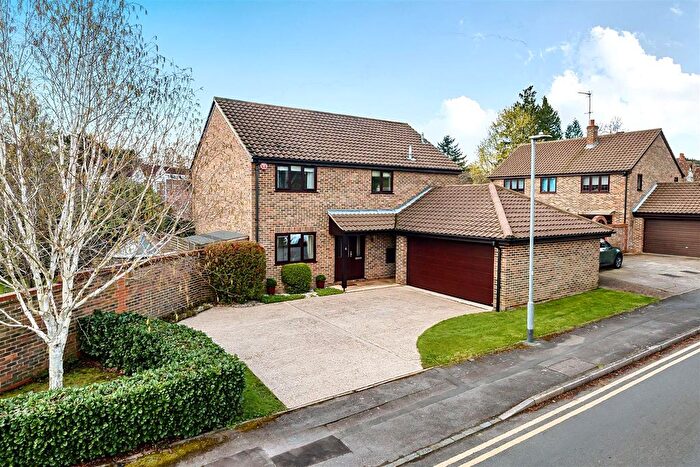
Properties for sale in Hurst
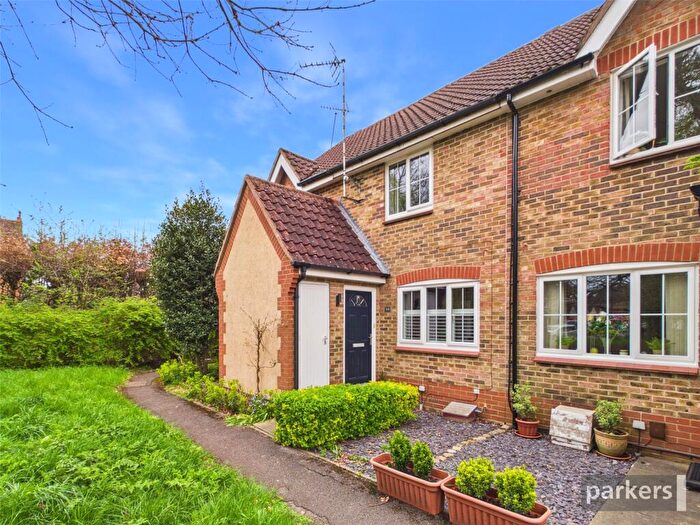
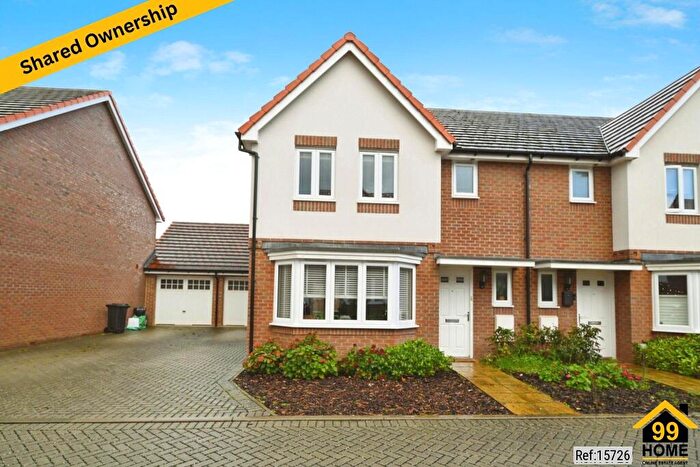
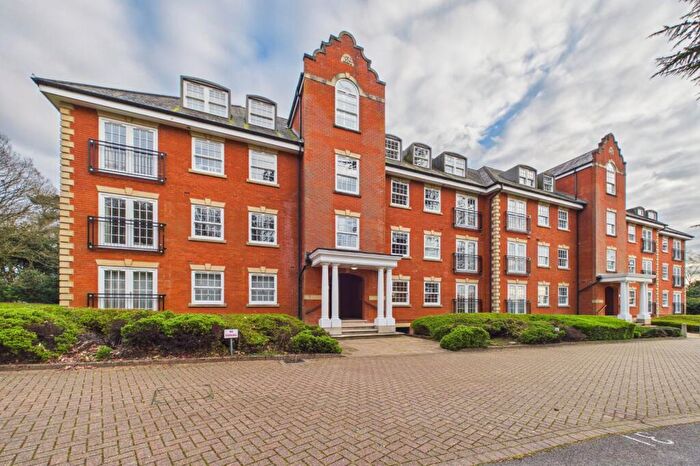

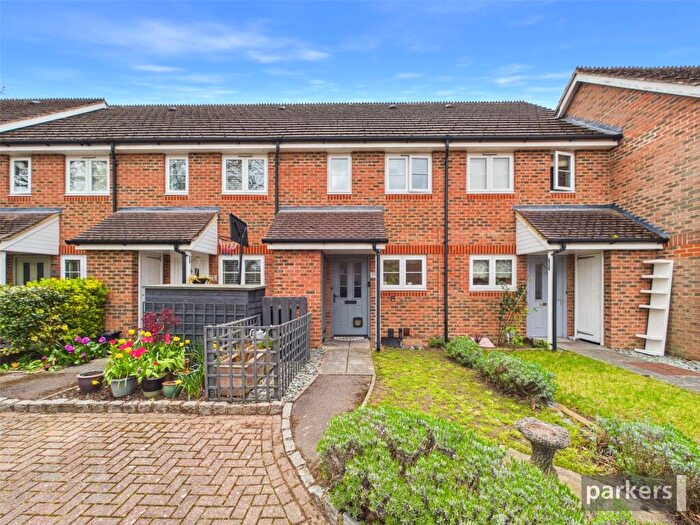
![]()
If you are looking to sell your house, let it out, or receive a property valuation, an expert can help you.
Click the button below to get started.


Roads and Postcodes in Hurst
Navigate through our locations to find the location of your next house in Hurst, Wokingham for sale or to rent.
| Streets | Postcodes |
|---|---|
| Ashridgewood Business Park | RG40 5BS |
| Ashridgewood Farm Cottages | RG40 5RF |
| Binfield Road | RG40 5PR RG40 5PP |
| Carters Hill | RG40 5RR RG40 5RT RG40 5RP RG40 5RS |
| Carters Hill Park | RG40 5QL |
| Forest Road | RG40 5QS RG40 5RA RG40 5RB RG40 5SA RG40 5SB RG40 5SD RG40 5SG RG40 5QR RG40 5QY RG40 5SE |
| Green Lane | RG40 5SH |
| Maidenhead Road | RG40 5RH RG40 5RJ RG40 5RL RG40 5RN RG40 5RU RG40 5RW RG40 5RX |
| Twyford Road | RG40 5QX RG40 5QT RG40 5QU |
| Warren House Road | RG40 5RG RG40 5RD |
Transport near Hurst
-
 Wokingham Station
 -
Winnersh Station
-
Winnersh Triangle Station
-
Bracknell Station
-
 Twyford Station
 -
Earley Station
-
Martins Heron Station
-
Crowthorne Station
- FAQ
- Price Paid By Year
- Property Type Price
Frequently asked questions about Hurst
What is the average price for a property for sale in Hurst?
The average price for a property for sale in Hurst is £979,378. This amount is 81% higher than the average price in Wokingham. There are 2,151 property listings for sale in Hurst.
What streets have the most expensive properties for sale in Hurst?
The street with the most expensive properties for sale in Hurst is Maidenhead Road at an average of £1,212,500.
What streets have the most affordable properties for sale in Hurst?
The street with the most affordable properties for sale in Hurst is Forest Road at an average of £886,130.
Which train stations are available in or near Hurst?
Some of the train stations available in or near Hurst are Wokingham, Winnersh and Winnersh Triangle.
Property Price Paid in Hurst by Year
The average sold property price by year was:
| Year | Average Sold Price | Price Change |
Sold Properties
|
|---|---|---|---|
| 2025 | £805,550 | -38% |
3 Properties |
| 2024 | £1,110,000 | - |
1 Property |
| 2023 | £1,109,666 | 37% |
3 Properties |
| 2022 | £701,600 | -2% |
5 Properties |
| 2021 | £717,000 | 5% |
4 Properties |
| 2020 | £677,900 | 11% |
5 Properties |
| 2019 | £603,000 | -28% |
1 Property |
| 2018 | £770,400 | 35% |
5 Properties |
| 2017 | £499,166 | -77% |
6 Properties |
| 2016 | £882,500 | 37% |
2 Properties |
| 2015 | £554,250 | 10% |
4 Properties |
| 2014 | £498,000 | 5% |
4 Properties |
| 2013 | £471,500 | -21% |
3 Properties |
| 2012 | £571,250 | -23% |
4 Properties |
| 2011 | £705,000 | 34% |
3 Properties |
| 2010 | £462,833 | 27% |
3 Properties |
| 2009 | £339,450 | 26% |
1 Property |
| 2008 | £249,950 | -126% |
1 Property |
| 2007 | £564,438 | 7% |
9 Properties |
| 2006 | £527,406 | 42% |
7 Properties |
| 2005 | £308,333 | 0,1% |
3 Properties |
| 2004 | £308,000 | -31% |
2 Properties |
| 2003 | £402,900 | 0,4% |
5 Properties |
| 2002 | £401,250 | 42% |
2 Properties |
| 2001 | £234,000 | -41% |
5 Properties |
| 2000 | £330,000 | 39% |
2 Properties |
| 1999 | £201,875 | 41% |
4 Properties |
| 1998 | £118,333 | -49% |
3 Properties |
| 1997 | £176,000 | 31% |
3 Properties |
| 1996 | £121,416 | 42% |
6 Properties |
| 1995 | £69,999 | - |
1 Property |
Property Price per Property Type in Hurst
Here you can find historic sold price data in order to help with your property search.
The average Property Paid Price for specific property types in the last three years are:
| Property Type | Average Sold Price | Sold Properties |
|---|---|---|
| Semi Detached House | £545,325.00 | 2 Semi Detached Houses |
| Detached House | £1,153,000.00 | 5 Detached Houses |