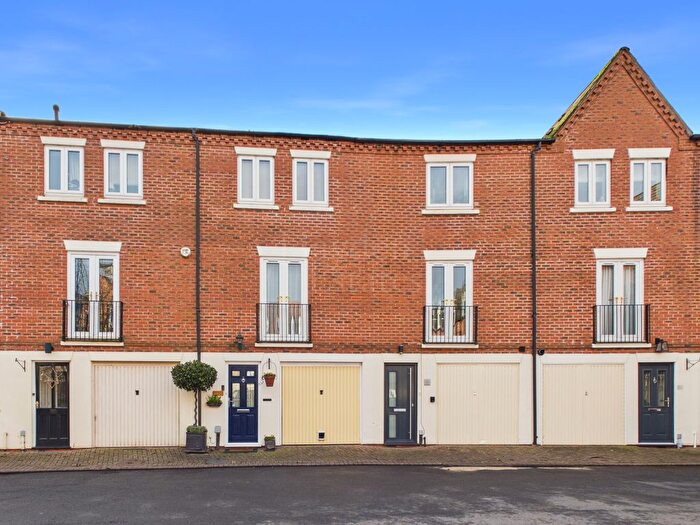
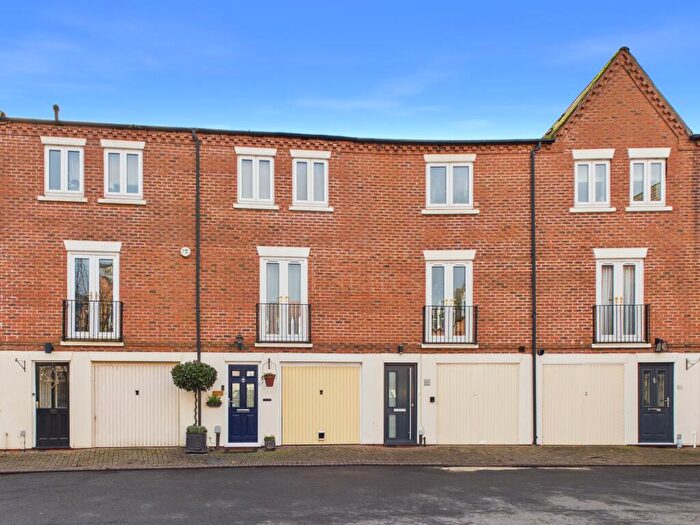
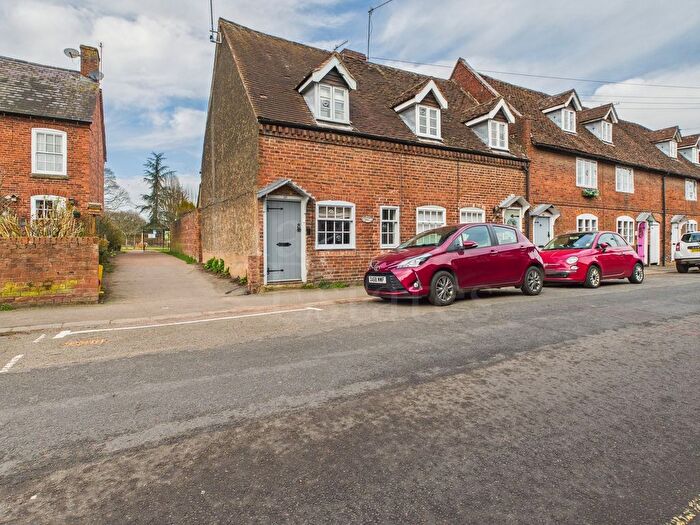
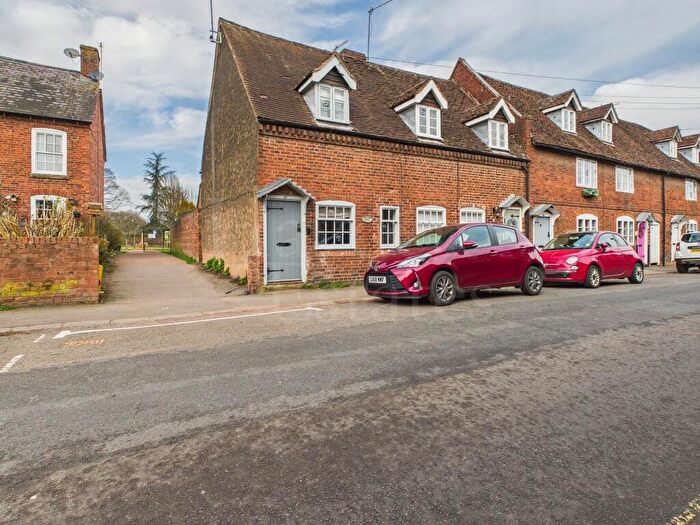
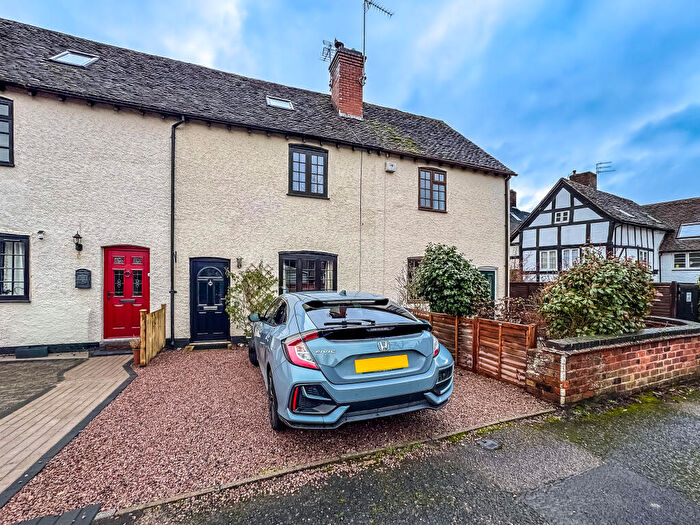
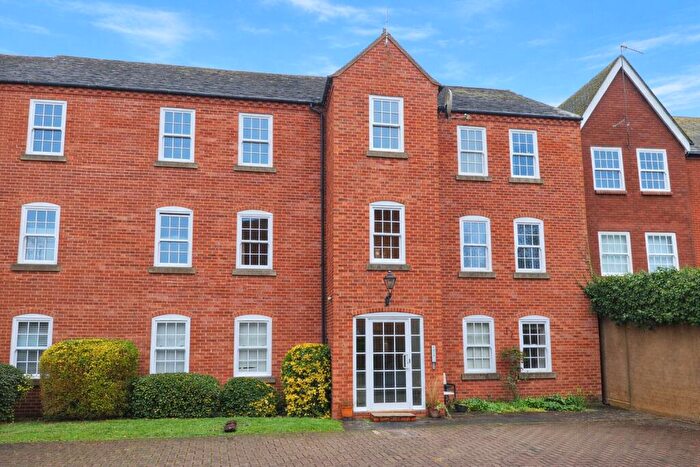
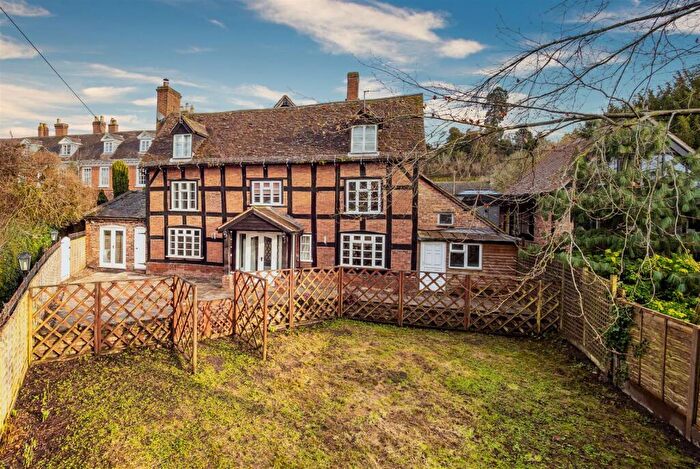
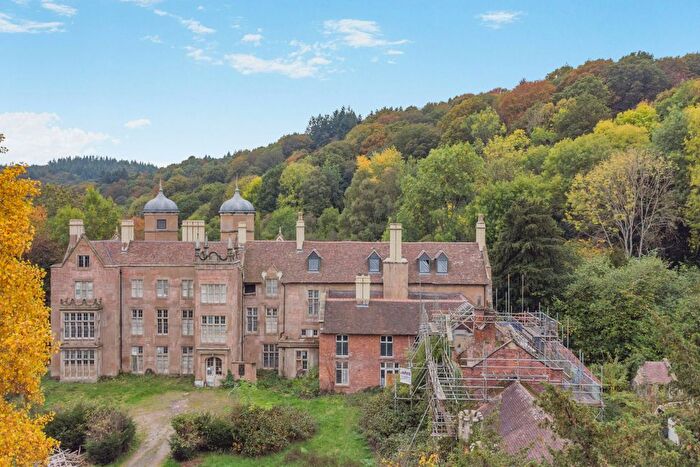
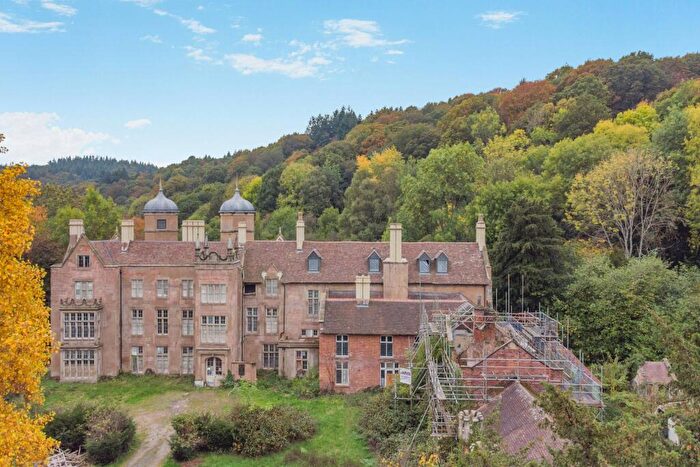
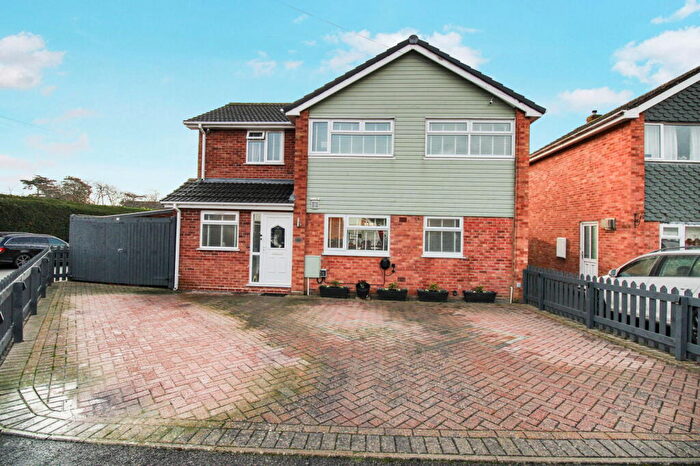
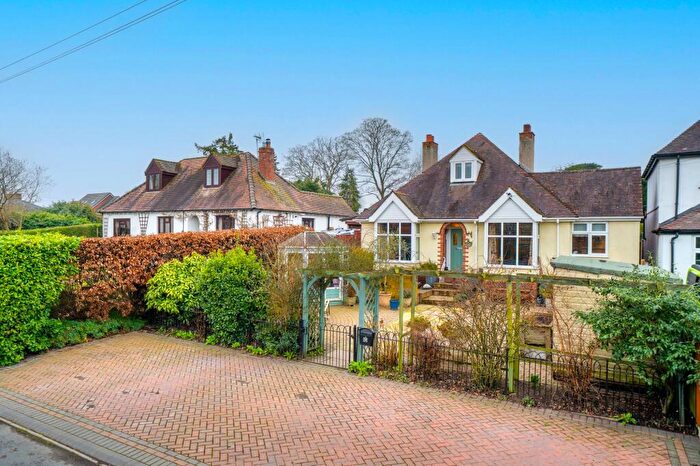
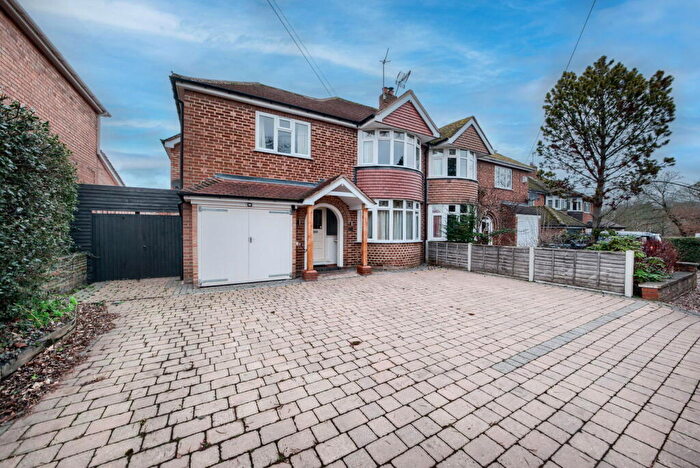
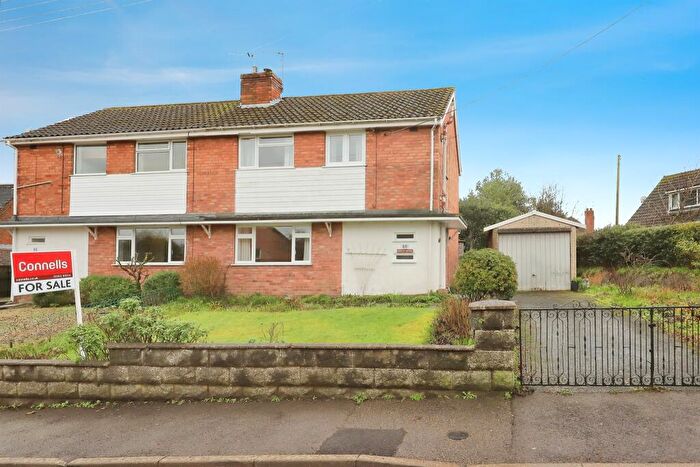
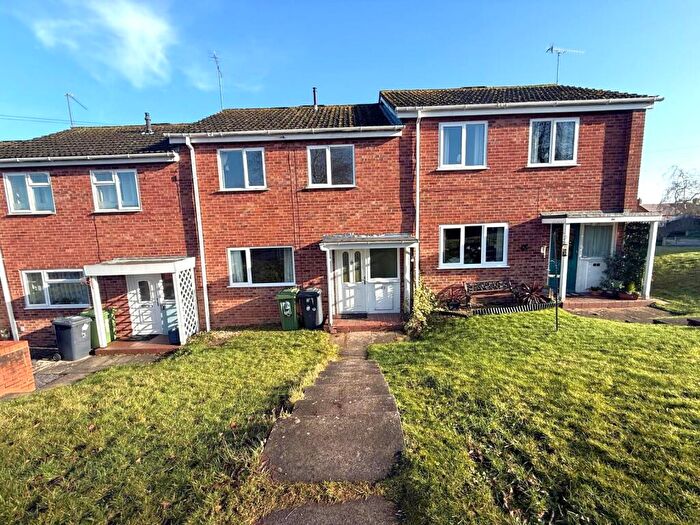
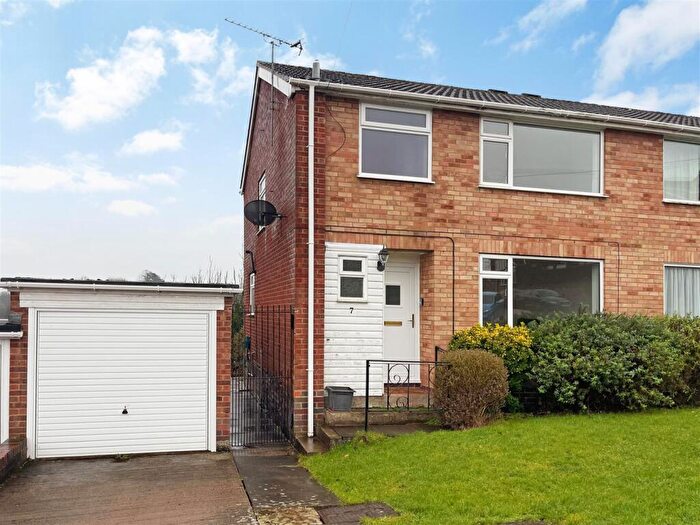
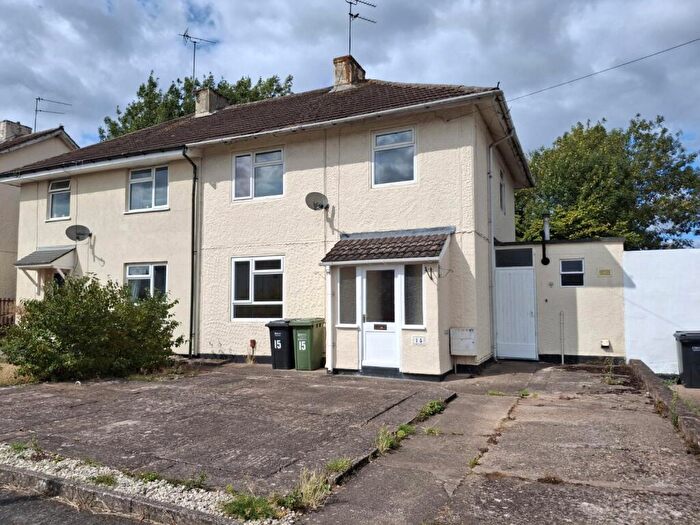
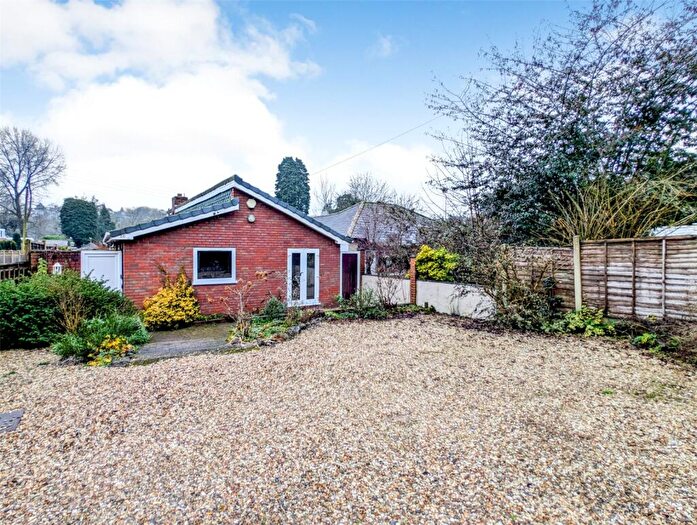
Houses for sale & to rent in Wribbenhall, Bewdley
House Prices in Wribbenhall
Properties in Wribbenhall have an average house price of £313,136.00 and had 136 Property Transactions within the last 3 years¹.
Wribbenhall is an area in Bewdley, Worcestershire with 1,834 households², where the most expensive property was sold for £1,550,000.00.
Properties for sale in Wribbenhall
Roads and Postcodes in Wribbenhall
Navigate through our locations to find the location of your next house in Wribbenhall, Bewdley for sale or to rent.
| Streets | Postcodes |
|---|---|
| Acacia Avenue | DY12 1BP |
| All Saints Avenue | DY12 1EG DY12 1EQ |
| Anton Close | DY12 1HX |
| Beales Corner | DY12 1AF |
| Belvedere Crescent | DY12 1JX |
| Brook Vale | DY12 1BQ |
| Brunel Mews | DY12 1HH |
| Campion Way | DY12 1HW |
| Castle Lane | DY12 1BX |
| Chester Terrace | DY12 1JG |
| Clarence Way | DY12 1QE |
| Cordlemarsh Road | DY12 1EJ DY12 1EL DY12 1EW |
| Crundalls Lane | DY12 1JL DY12 1JN DY12 1NA DY12 1NB DY12 1ND |
| Damson Way | DY12 1EZ |
| Delamere Road | DY12 1JU |
| Dunmore Road | DY12 1JY |
| Eymore Wood | DY12 1NY |
| Gloucester Way | DY12 1QF |
| Grey Green Lane | DY12 1LP DY12 1LR DY12 1LS DY12 1LT DY12 1LU DY12 1LX |
| Habberley Road | DY12 1JA DY12 1JH DY12 1JQ DY12 1LD |
| Hall Farm Lane | DY12 1NP |
| Heath Field Road | DY12 1JT |
| Hilltop Avenue | DY12 1HY |
| Hoarstone Close | DY12 1ER |
| Hunts Rise | DY12 1HR |
| Jordens Walk | DY12 1JW |
| Kidderminster Road | DY12 1AG DY12 1AQ DY12 1BU DY12 1BY DY12 1DG DY12 1DL DY12 1DQ DY12 1JD DY12 1JE DY12 1LN |
| Lingfield Road | DY12 1JZ |
| Lodge Close | DY12 1DN |
| March Grove | DY12 1QQ |
| Maypole Close | DY12 1BZ |
| Meadow Rise | DY12 1JP DY12 1JS |
| Millside Court | DY12 1AX |
| Mortimer Grove | DY12 1QG |
| New Road | DY12 1JF |
| Northwood Lane | DY12 1AH DY12 1AN DY12 1AW |
| Nursery Road | DY12 1AL |
| Orchard Bungalow | DY12 1AP |
| Pewterers Alley | DY12 1AE |
| Pleasant Harbour | DY12 1AD |
| Queensway | DY12 1EP DY12 1ES DY12 1ET |
| Ricketts Place | DY12 1DW |
| Riddings Close | DY12 1EN |
| Riverway Drive | DY12 1AJ |
| Rope Walk | DY12 1HA |
| Sandbourne Drive | DY12 1BN |
| Sandstone Road | DY12 1BW |
| Severnside Mill | DY12 1AY |
| Shaw Hedge Road | DY12 1EH DY12 1EU DY12 1EX |
| Spencer Avenue | DY12 1DA DY12 1DB |
| Spring Grove | DY12 1LG DY12 1LQ |
| Springfield Villas | DY12 1AB |
| Springhill Rise | DY12 1EA DY12 1EB |
| Station Road | DY12 1BT |
| Stephenson Place | DY12 1AZ |
| Stourport Road | DY12 1BA DY12 1BB DY12 1BD DY12 1BH DY12 1BJ DY12 1BL DY12 1PU DY12 1QA |
| Threlfall Drive | DY12 1HU |
| Trimpley Lane | DY12 1JJ DY12 1RB DY12 1RD DY12 1RE DY12 1RF DY12 1RG |
| Upper Birch Farm Cottages | DY12 1TR |
| Warstone Close | DY12 1HZ |
| Warstone Meadows | DY12 1HT DY12 1JB |
| Wassell Drive | DY12 1EE DY12 1EF |
| Westbourne Street | DY12 1BS |
| Wheatcroft Avenue | DY12 1DE |
| Wynn Close | DY12 1JR |
| DY12 1NG DY12 1NJ DY12 1NL DY12 1NQ DY12 1NS DY12 1NZ DY12 1PA DY12 1PD DY12 1PE |
Transport near Wribbenhall
-
Kidderminster Station
-
Hartlebury Station
-
Blakedown Station
-
Hagley Station
-
Stourbridge Junction Station
-
Stourbridge Town Station
-
Lye Station
- FAQ
- Price Paid By Year
- Property Type Price
Frequently asked questions about Wribbenhall
What is the average price for a property for sale in Wribbenhall?
The average price for a property for sale in Wribbenhall is £313,136. This amount is 5% lower than the average price in Bewdley. There are 2,436 property listings for sale in Wribbenhall.
What streets have the most expensive properties for sale in Wribbenhall?
The streets with the most expensive properties for sale in Wribbenhall are Threlfall Drive at an average of £658,750, Campion Way at an average of £615,000 and Acacia Avenue at an average of £570,000.
What streets have the most affordable properties for sale in Wribbenhall?
The streets with the most affordable properties for sale in Wribbenhall are Lodge Close at an average of £165,833, Springhill Rise at an average of £173,333 and Hoarstone Close at an average of £190,000.
Which train stations are available in or near Wribbenhall?
Some of the train stations available in or near Wribbenhall are Kidderminster, Hartlebury and Blakedown.
Property Price Paid in Wribbenhall by Year
The average sold property price by year was:
| Year | Average Sold Price | Price Change |
Sold Properties
|
|---|---|---|---|
| 2025 | £306,088 | 9% |
45 Properties |
| 2024 | £279,657 | -21% |
35 Properties |
| 2023 | £339,725 | 12% |
56 Properties |
| 2022 | £298,217 | 0,1% |
65 Properties |
| 2021 | £297,908 | 9% |
82 Properties |
| 2020 | £270,361 | 6% |
53 Properties |
| 2019 | £253,048 | 13% |
52 Properties |
| 2018 | £219,503 | -1% |
61 Properties |
| 2017 | £220,651 | -10% |
64 Properties |
| 2016 | £242,311 | 11% |
56 Properties |
| 2015 | £214,735 | -2% |
68 Properties |
| 2014 | £219,707 | 8% |
48 Properties |
| 2013 | £201,706 | 2% |
63 Properties |
| 2012 | £198,398 | 2% |
45 Properties |
| 2011 | £193,767 | 2% |
54 Properties |
| 2010 | £189,733 | -10% |
37 Properties |
| 2009 | £208,330 | -11% |
33 Properties |
| 2008 | £230,497 | 1% |
36 Properties |
| 2007 | £228,049 | 11% |
98 Properties |
| 2006 | £202,067 | -5% |
72 Properties |
| 2005 | £211,851 | 11% |
77 Properties |
| 2004 | £188,510 | -0,1% |
103 Properties |
| 2003 | £188,628 | 17% |
87 Properties |
| 2002 | £155,666 | 10% |
121 Properties |
| 2001 | £139,789 | 25% |
125 Properties |
| 2000 | £104,910 | 13% |
86 Properties |
| 1999 | £91,425 | 6% |
78 Properties |
| 1998 | £86,265 | 11% |
68 Properties |
| 1997 | £76,732 | 10% |
82 Properties |
| 1996 | £69,409 | 7% |
81 Properties |
| 1995 | £64,790 | - |
56 Properties |
Property Price per Property Type in Wribbenhall
Here you can find historic sold price data in order to help with your property search.
The average Property Paid Price for specific property types in the last three years are:
| Property Type | Average Sold Price | Sold Properties |
|---|---|---|
| Semi Detached House | £264,096.00 | 38 Semi Detached Houses |
| Detached House | £418,403.00 | 52 Detached Houses |
| Terraced House | £243,584.00 | 38 Terraced Houses |
| Flat | £192,218.00 | 8 Flats |

