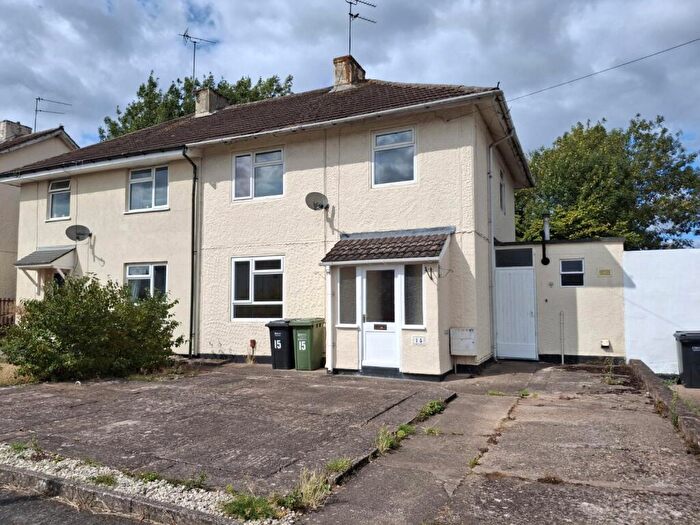
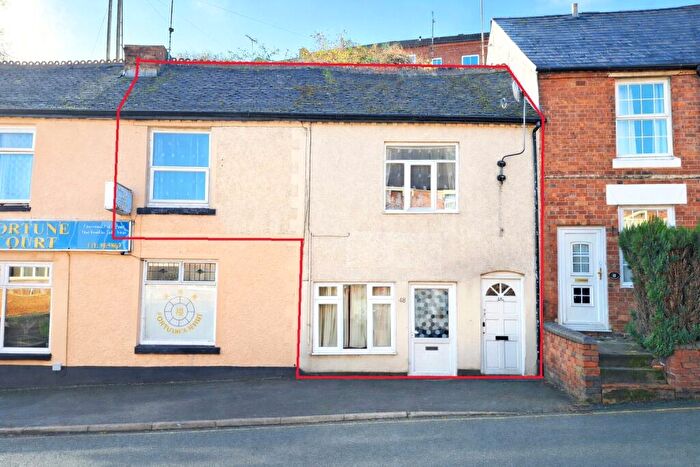
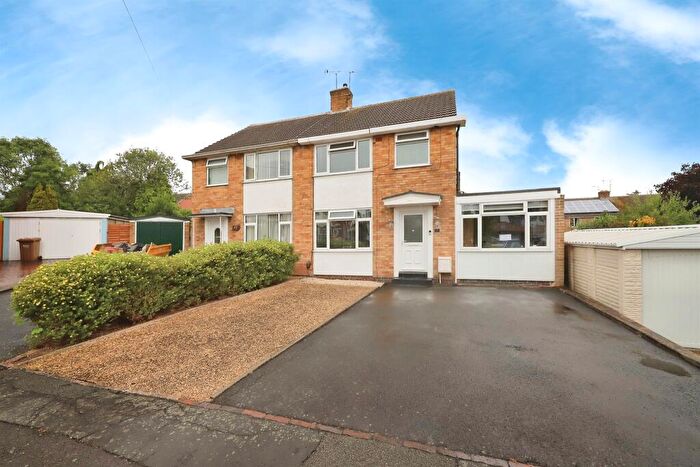
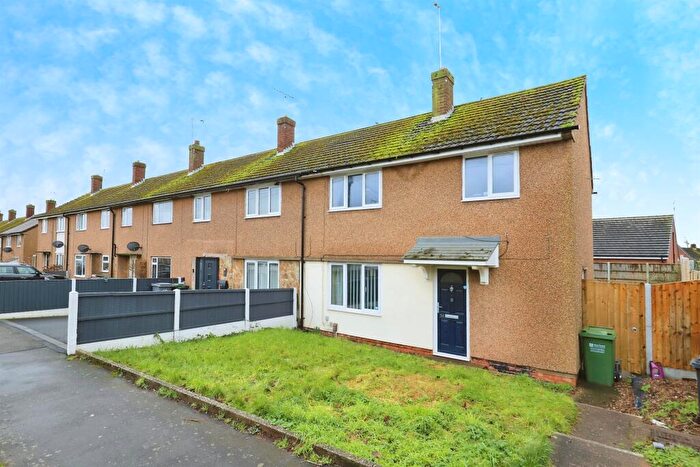
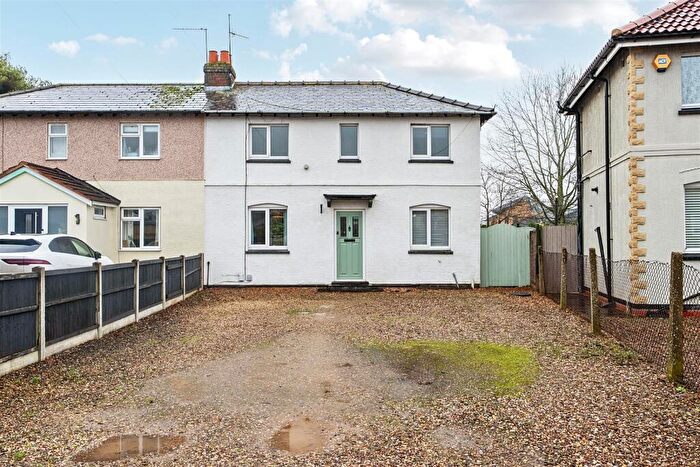
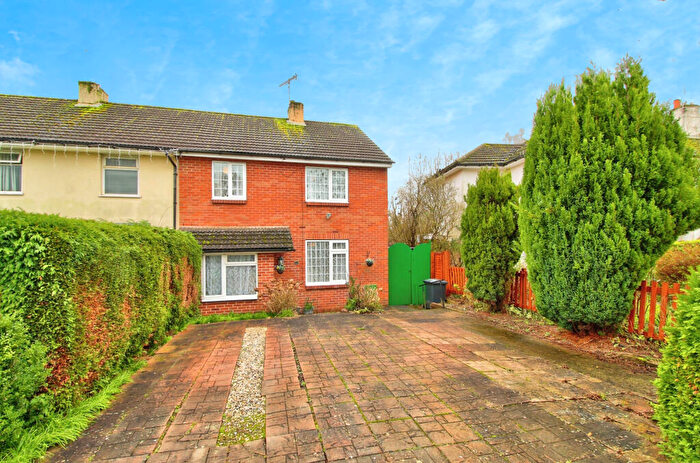
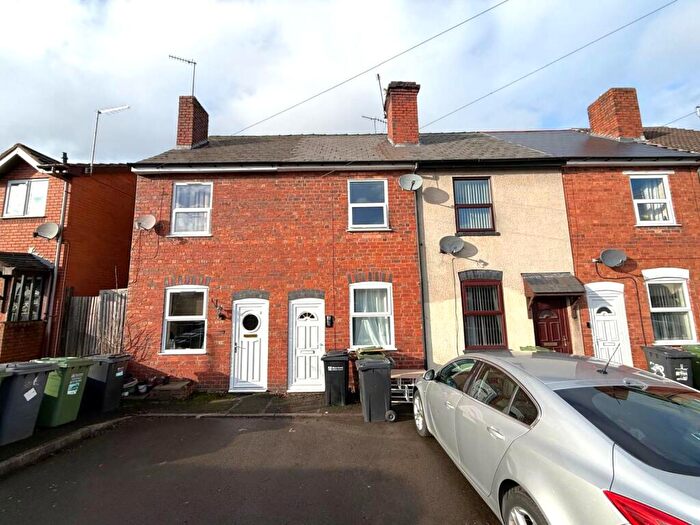
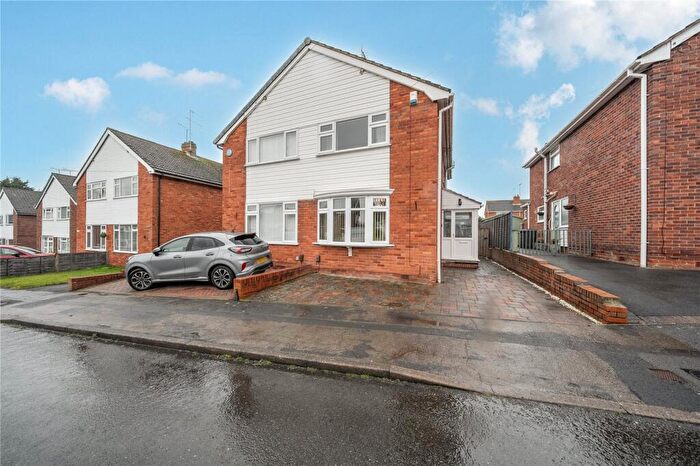
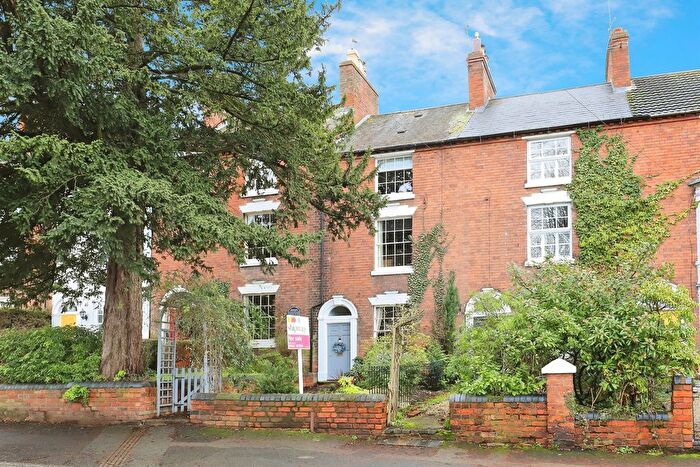
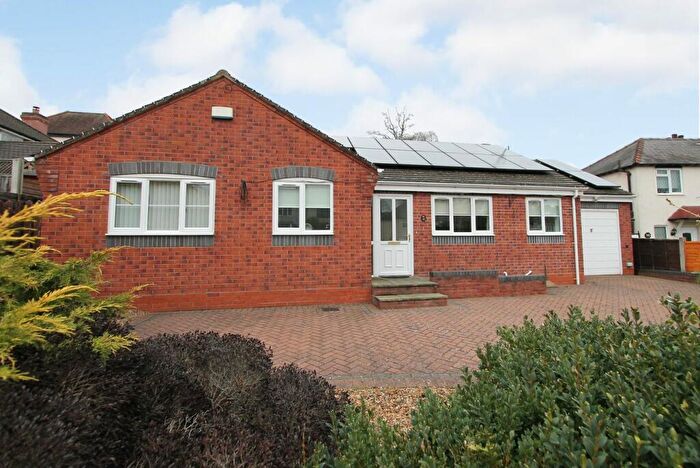
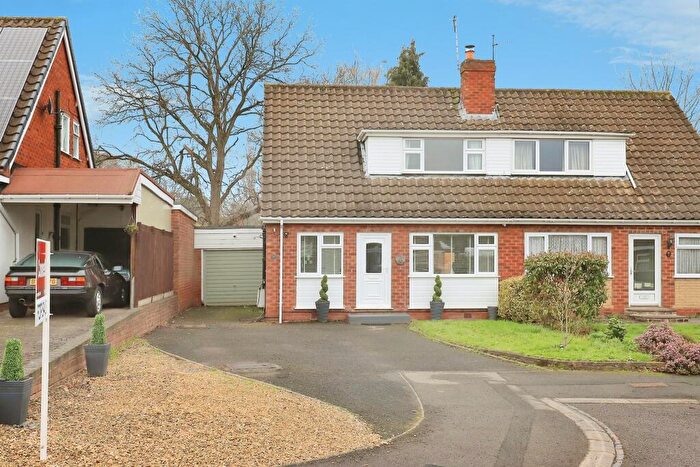
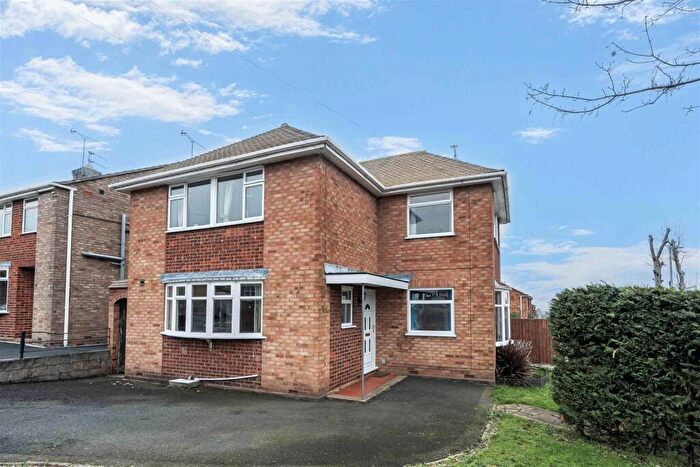
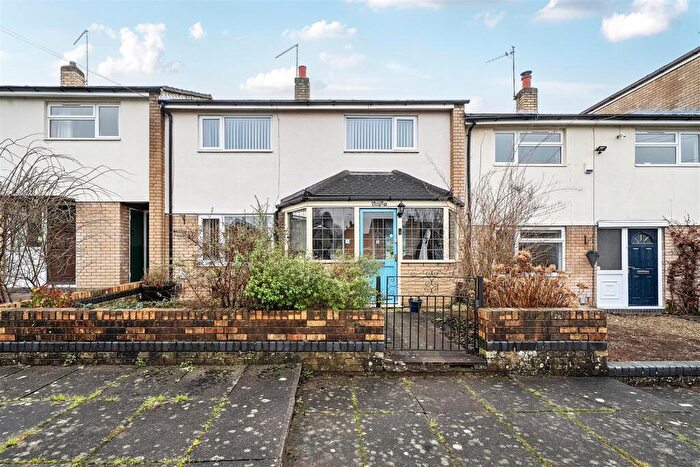
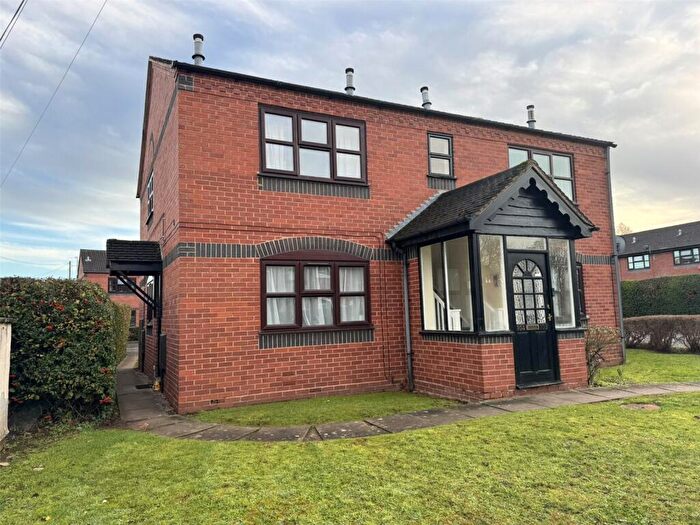
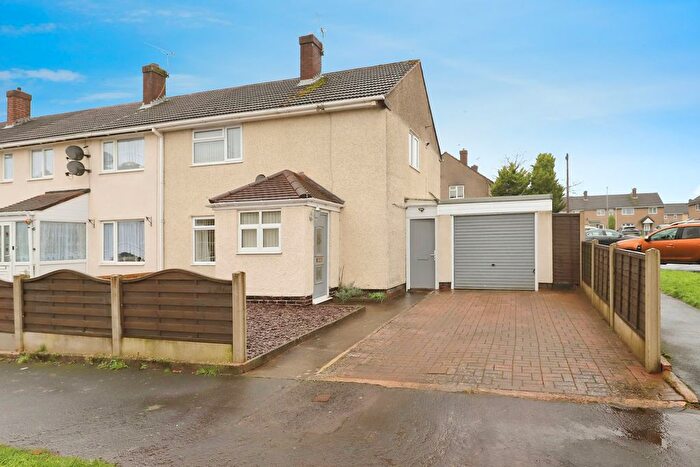
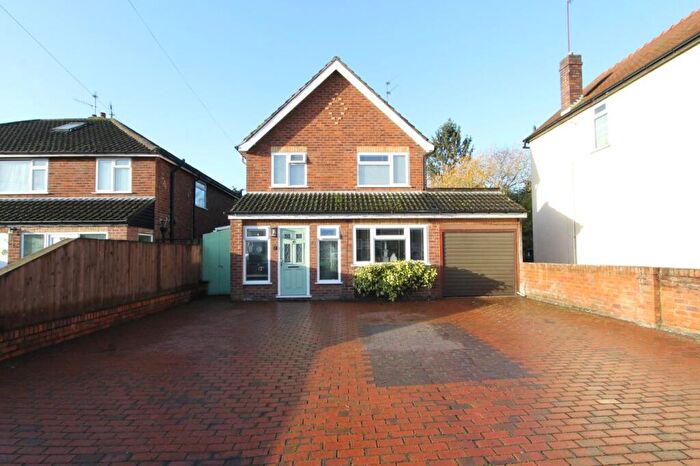
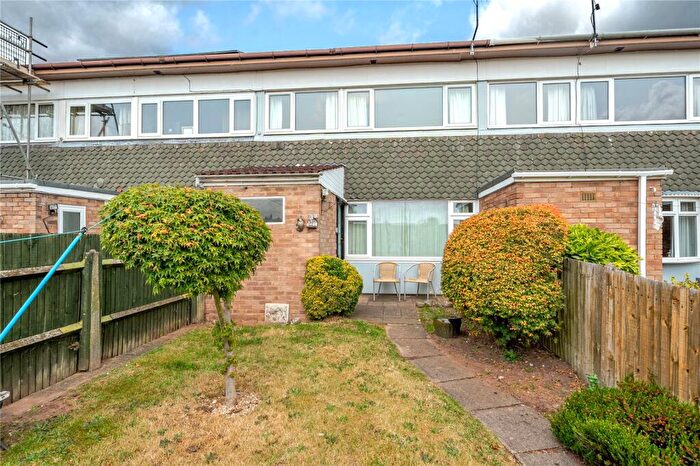
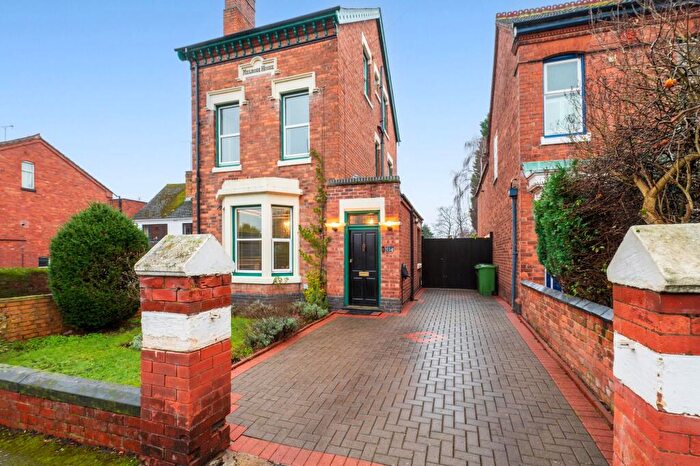
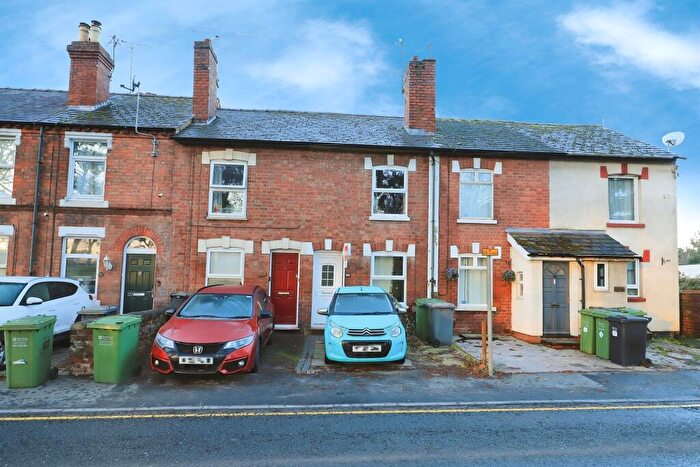
Houses for sale & to rent in Habberley And Blakebrook, Kidderminster
House Prices in Habberley And Blakebrook
Properties in Habberley And Blakebrook have an average house price of £272,222.00 and had 239 Property Transactions within the last 3 years¹.
Habberley And Blakebrook is an area in Kidderminster, Worcestershire with 2,585 households², where the most expensive property was sold for £782,500.00.
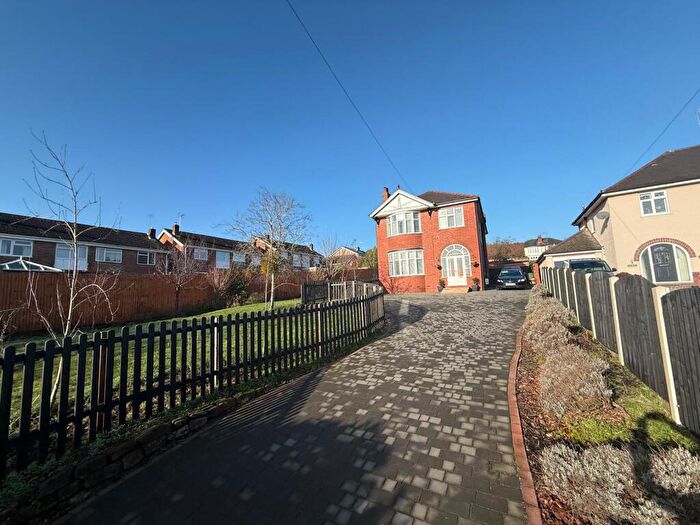
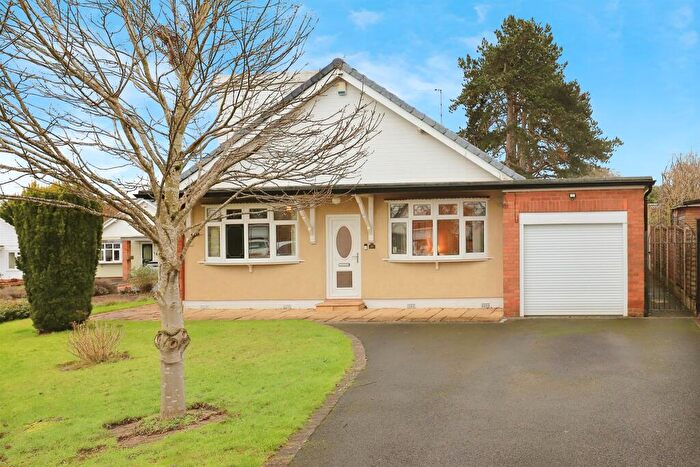
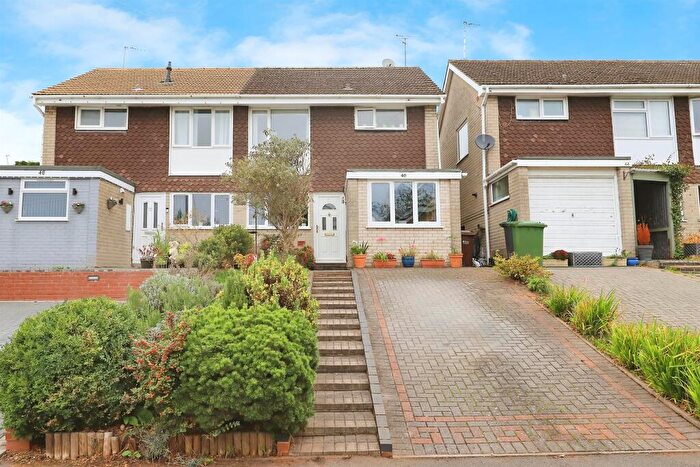
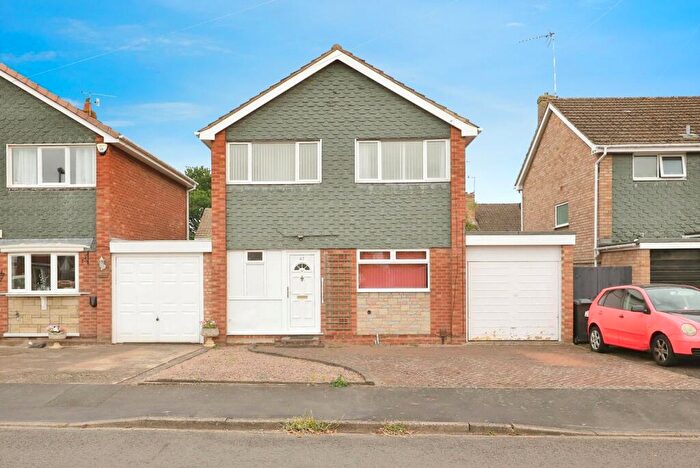
Properties for sale in Habberley And Blakebrook
Roads and Postcodes in Habberley And Blakebrook
Navigate through our locations to find the location of your next house in Habberley And Blakebrook, Kidderminster for sale or to rent.
| Streets | Postcodes |
|---|---|
| Abbey Road | DY11 6EN |
| Bennett Street | DY11 6XU DY11 6XX |
| Bentons Court | DY11 6YY |
| Beverley Close | DY11 6HH |
| Bewdley Grange | DY11 6JZ |
| Bewdley Hill | DY11 6BS DY11 6BT DY11 6JA DY11 6JE DY11 6JR |
| Blakebrook | DY11 6AP DY11 6AR DY11 6RG |
| Blakebrook Close | DY11 6AW |
| Blakebrook Gardens | DY11 6RF |
| Briars Gardens | DY11 5PS |
| Brook Street | DY11 6RH |
| Broomfield Close | DY11 5PD |
| Broomfield Road | DY11 5PB DY11 5PH |
| Burghley Drive | DY11 6BB |
| Canterbury Road | DY11 6ET DY11 6EU DY11 6EX |
| Cathedral Avenue | DY11 6ER DY11 6ES |
| Cedar Crescent | DY11 6AQ |
| Cedar Drive | DY11 6AH |
| Cheshire Grove | DY11 6AY |
| Church Walk | DY11 6XY DY11 6XZ |
| Clares Court | DY11 6YX |
| Crane Street | DY11 6XT |
| Crestwood Avenue | DY11 6JS |
| Domar Road | DY11 5PJ DY11 5PL |
| Drake Crescent | DY11 6EB DY11 6EE |
| Ely Close | DY11 6EJ |
| Exeter Close | DY11 6EL |
| Franche Road | DY11 5AQ |
| Glastonbury Close | DY11 6EP |
| Grange Road | DY11 5NT |
| Habberley Road | DY11 5PE DY11 5PN DY11 5PW DY11 6AA |
| Habberley Street | DY11 6XS |
| Hawthorn Grove | DY11 6DD |
| Highlands Close | DY11 6JU |
| Hill Close | DY11 6GB |
| Hillside Drive | DY11 5PP |
| Holmwood Avenue | DY11 6DA DY11 6DB |
| Jelleyman Close | DY11 6AD |
| Kings Road | DY11 6YU |
| Lansdown Green | DY11 6PY |
| Leawood Grove | DY11 6JT |
| Lichfield Avenue | DY11 6HB |
| Manor Avenue | DY11 6EA |
| Manor Avenue South | DY11 6DE DY11 6DG |
| Manor Close | DY11 6DF |
| Mason Road | DY11 6AF DY11 6AG |
| Meadow Hill Close | DY11 6JX |
| Mill Lane | DY11 6YG DY11 6YH DY11 6YJ |
| Mill Street | DY11 6XB |
| Milton Close | DY11 6EW |
| Moule Close | DY11 6AL |
| Newlands Close | DY11 5AR |
| Norwich Avenue | DY11 6HA |
| Oakden Place | DY11 6BP |
| Parkland Avenue | DY11 6BX |
| Pershore Road | DY11 6DJ |
| Pineridge Drive | DY11 6BG DY11 6BQ |
| Renfrew Gardens | DY11 6BA |
| Rowland Hill Avenue | DY11 6JB |
| Salisbury Drive | DY11 6EY DY11 6HE |
| Selba Drive | DY11 6HN DY11 6HW |
| Selsdon Close | DY11 6BD |
| Spinney Close | DY11 6DQ |
| St Albans Avenue | DY11 6EF |
| St Davids Close | DY11 6HJ |
| St Johns Avenue | DY11 6AT DY11 6AU DY11 6AX DY11 6AZ |
| St Johns Close | DY11 6YQ |
| St Johns Street | DY11 6YE DY11 6YF |
| St Pauls Avenue | DY11 6EG |
| Summer Hill Avenue | DY11 6BU DY11 6BY |
| Summer Place | DY11 6QH |
| The Lea | DY11 6JY |
| The Patios | DY11 5AB |
| Trimpley Drive | DY11 5LA DY11 5LB |
| Truro Drive | DY11 6DL DY11 6DN |
| Welbeck Drive | DY11 6BJ |
| Wells Close | DY11 6EQ |
| Western Way | DY11 6JF |
| Westminster Road | DY11 6HG DY11 6HL |
| Westville Avenue | DY11 6BZ |
| Whitburn Close | DY11 6BH |
| Winchester Avenue | DY11 6EH |
| Woodfield Street | DY11 6YB |
| Woodland Avenue | DY11 5AN DY11 5AW |
Transport near Habberley And Blakebrook
- FAQ
- Price Paid By Year
- Property Type Price
Frequently asked questions about Habberley And Blakebrook
What is the average price for a property for sale in Habberley And Blakebrook?
The average price for a property for sale in Habberley And Blakebrook is £272,222. This amount is 5% higher than the average price in Kidderminster. There are 919 property listings for sale in Habberley And Blakebrook.
What streets have the most expensive properties for sale in Habberley And Blakebrook?
The streets with the most expensive properties for sale in Habberley And Blakebrook are Bewdley Grange at an average of £635,000, Manor Avenue at an average of £583,333 and Westville Avenue at an average of £540,000.
What streets have the most affordable properties for sale in Habberley And Blakebrook?
The streets with the most affordable properties for sale in Habberley And Blakebrook are Mill Street at an average of £105,000, St Johns Street at an average of £130,083 and Mill Lane at an average of £134,805.
Which train stations are available in or near Habberley And Blakebrook?
Some of the train stations available in or near Habberley And Blakebrook are Kidderminster, Blakedown and Hartlebury.
Property Price Paid in Habberley And Blakebrook by Year
The average sold property price by year was:
| Year | Average Sold Price | Price Change |
Sold Properties
|
|---|---|---|---|
| 2025 | £280,557 | 6% |
80 Properties |
| 2024 | £262,587 | -4% |
83 Properties |
| 2023 | £273,971 | 1% |
76 Properties |
| 2022 | £270,288 | 13% |
94 Properties |
| 2021 | £236,145 | 2% |
130 Properties |
| 2020 | £232,334 | 2% |
90 Properties |
| 2019 | £227,708 | 5% |
108 Properties |
| 2018 | £215,773 | 10% |
109 Properties |
| 2017 | £195,096 | 1% |
104 Properties |
| 2016 | £193,062 | 5% |
92 Properties |
| 2015 | £184,293 | 0,1% |
100 Properties |
| 2014 | £184,131 | 3% |
106 Properties |
| 2013 | £179,016 | -13% |
80 Properties |
| 2012 | £201,542 | 13% |
67 Properties |
| 2011 | £175,449 | 8% |
59 Properties |
| 2010 | £162,202 | 3% |
71 Properties |
| 2009 | £157,733 | -13% |
46 Properties |
| 2008 | £177,957 | 1% |
48 Properties |
| 2007 | £176,600 | 3% |
104 Properties |
| 2006 | £171,655 | -4% |
138 Properties |
| 2005 | £178,778 | 15% |
112 Properties |
| 2004 | £151,299 | 9% |
118 Properties |
| 2003 | £137,583 | 12% |
88 Properties |
| 2002 | £121,369 | 18% |
156 Properties |
| 2001 | £99,674 | 22% |
130 Properties |
| 2000 | £78,071 | -4% |
122 Properties |
| 1999 | £81,074 | -2% |
118 Properties |
| 1998 | £82,691 | 19% |
117 Properties |
| 1997 | £67,297 | 10% |
120 Properties |
| 1996 | £60,330 | 5% |
87 Properties |
| 1995 | £57,462 | - |
64 Properties |
Property Price per Property Type in Habberley And Blakebrook
Here you can find historic sold price data in order to help with your property search.
The average Property Paid Price for specific property types in the last three years are:
| Property Type | Average Sold Price | Sold Properties |
|---|---|---|
| Semi Detached House | £235,429.00 | 79 Semi Detached Houses |
| Detached House | £397,004.00 | 83 Detached Houses |
| Terraced House | £183,269.00 | 70 Terraced Houses |
| Flat | £97,428.00 | 7 Flats |

