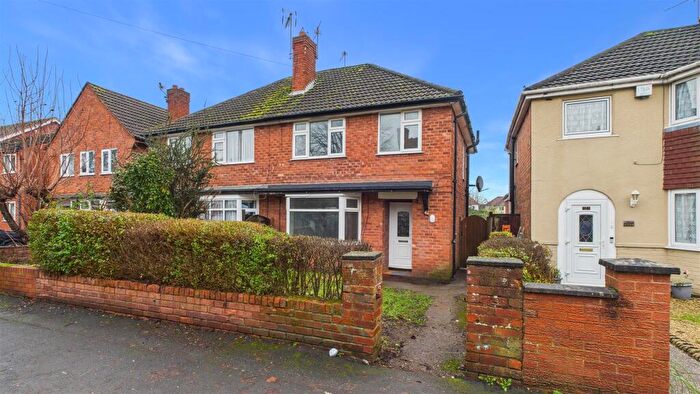
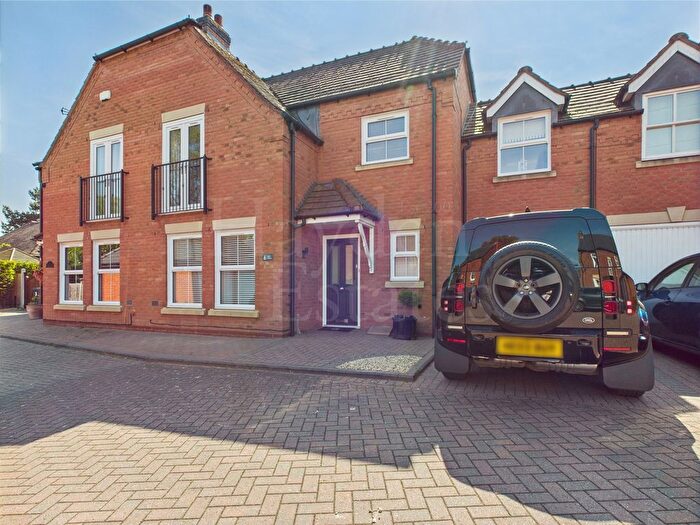
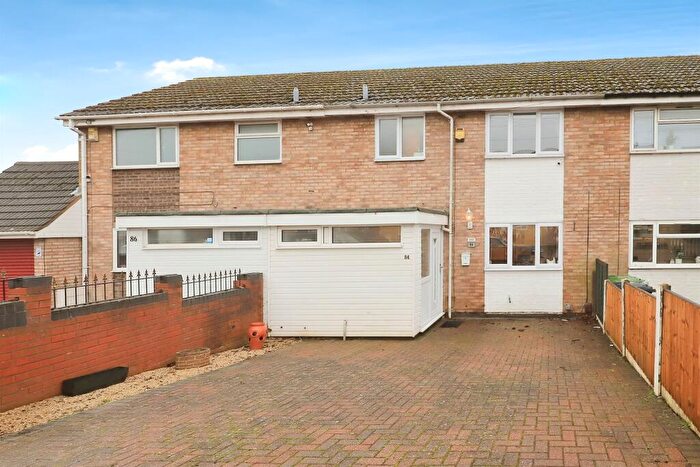
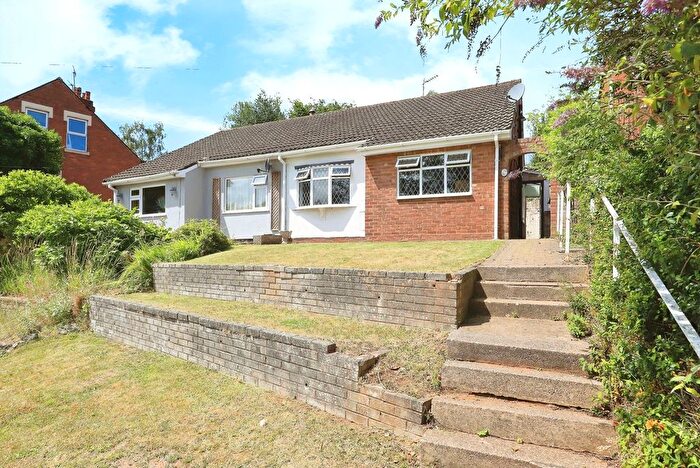
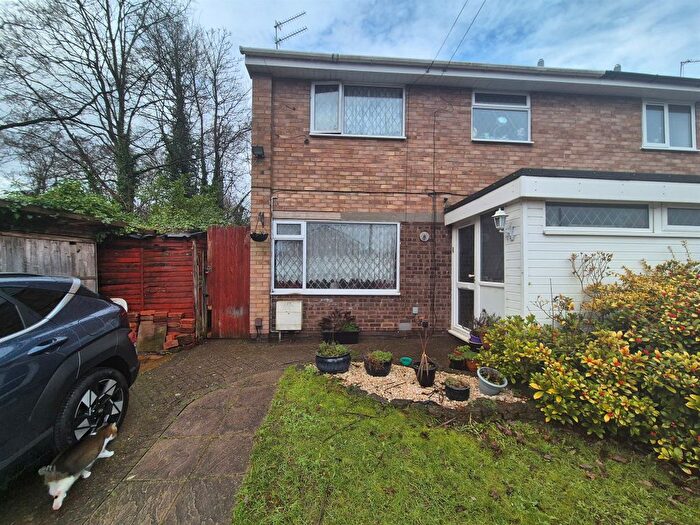
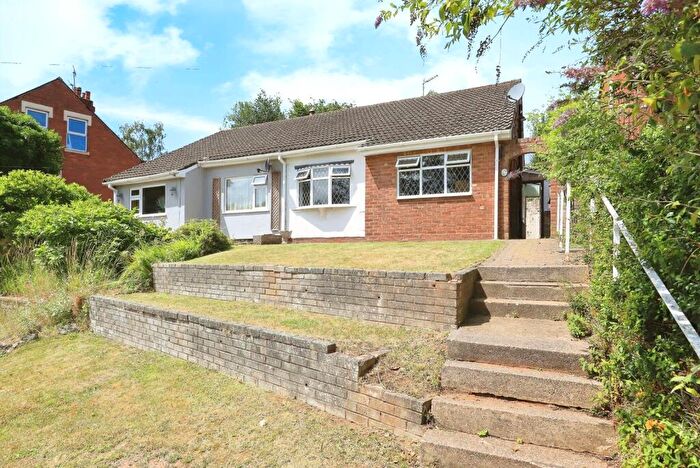
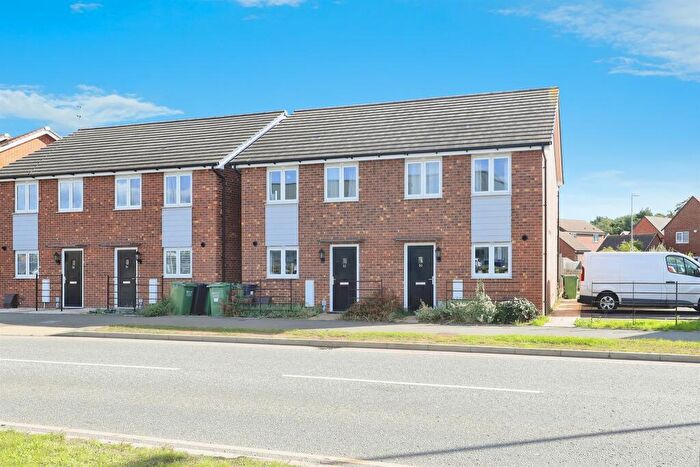
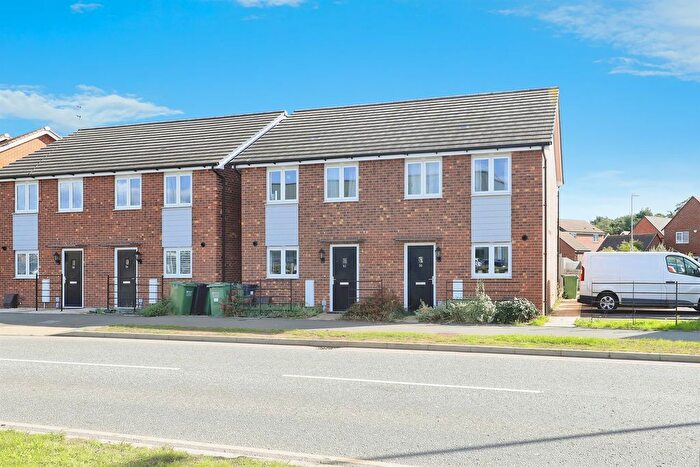
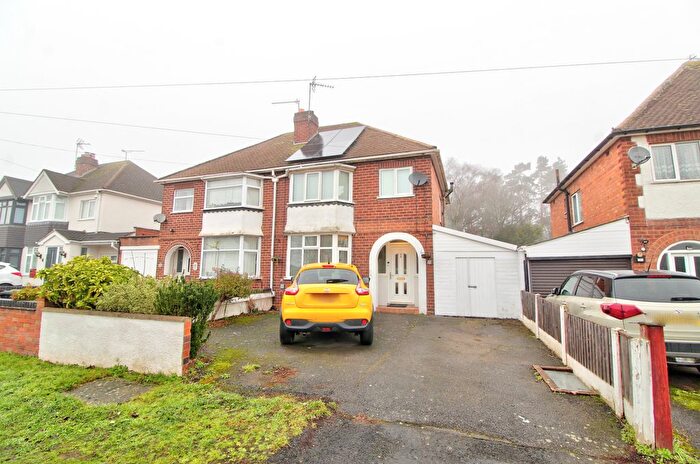
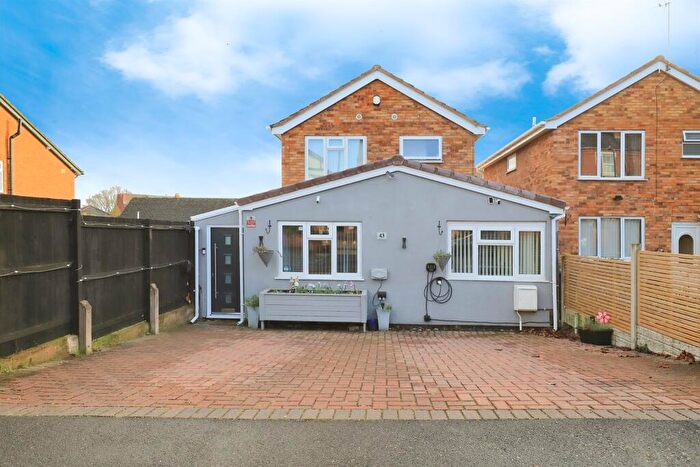
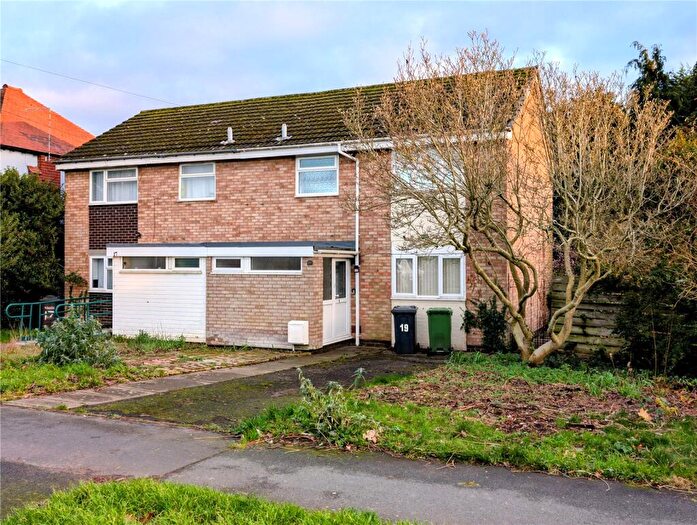
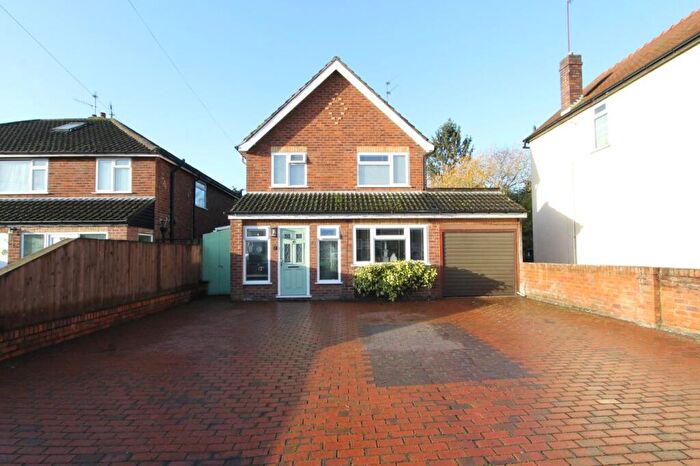
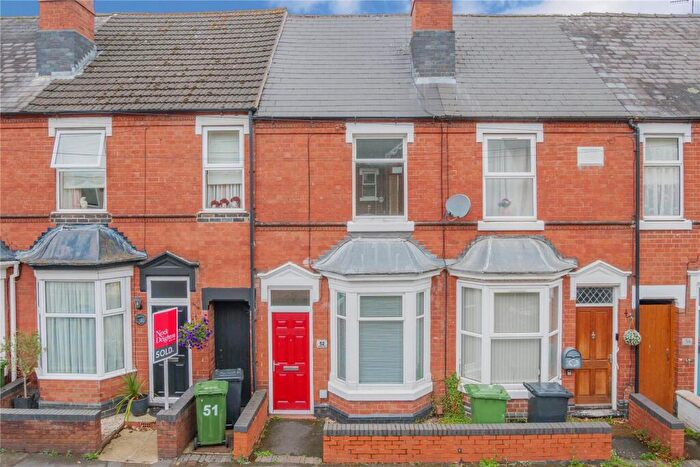
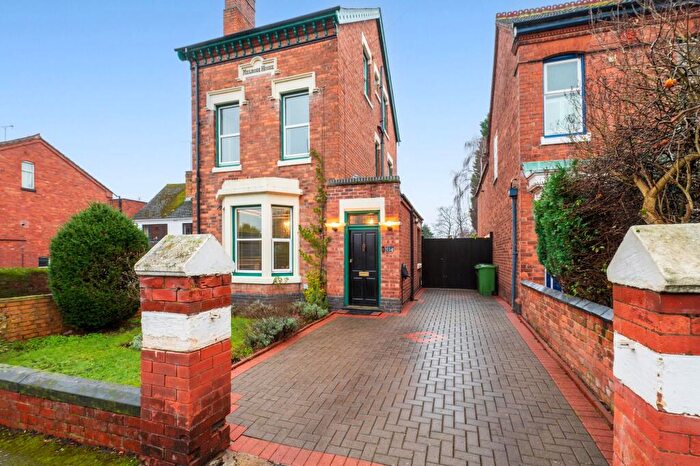
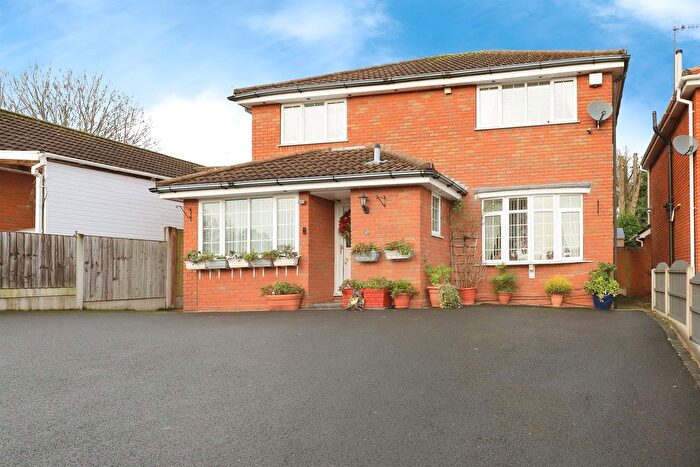
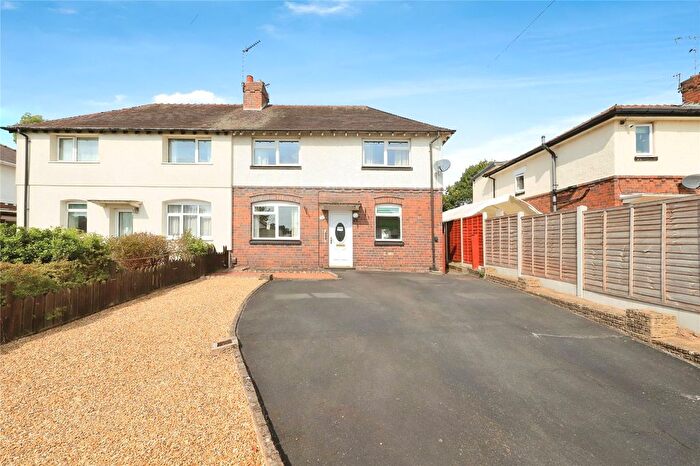
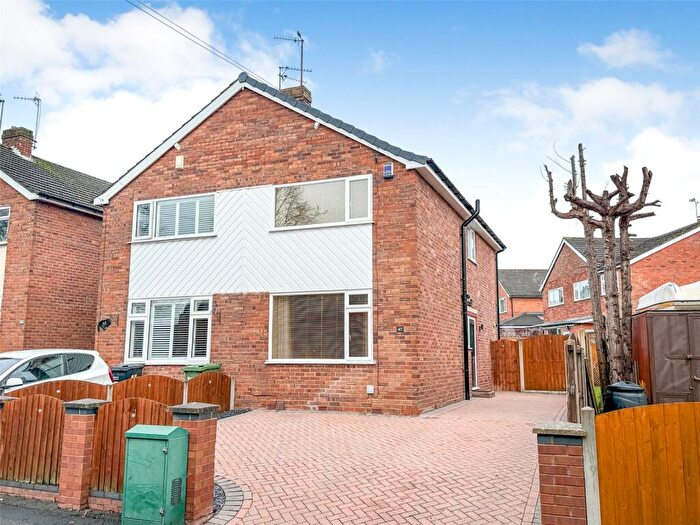
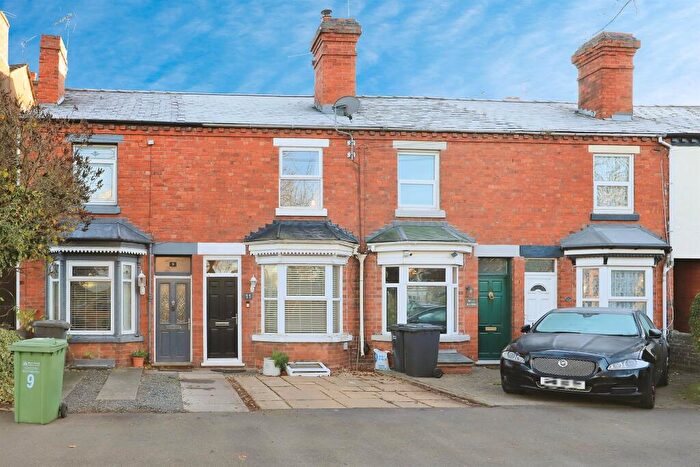
Houses for sale & to rent in Oldington And Foley Park, Kidderminster
House Prices in Oldington And Foley Park
Properties in Oldington And Foley Park have an average house price of £198,941.00 and had 123 Property Transactions within the last 3 years¹.
Oldington And Foley Park is an area in Kidderminster, Worcestershire with 1,777 households², where the most expensive property was sold for £418,000.00.
Properties for sale in Oldington And Foley Park
Roads and Postcodes in Oldington And Foley Park
Navigate through our locations to find the location of your next house in Oldington And Foley Park, Kidderminster for sale or to rent.
| Streets | Postcodes |
|---|---|
| Addenbrooke Crescent | DY11 7HF DY11 7HQ |
| Arley Close | DY11 7NX |
| Avon Road | DY11 7PE |
| Beauchamp Avenue | DY11 7AG DY11 7AH DY11 7AQ |
| Beauchamp Heights | DY11 7AD |
| Blount Terrace | DY11 7AE DY11 7AF |
| Bredon Avenue | DY11 7EP |
| Clee Avenue | DY11 7BS |
| Clent Avenue | DY11 7EH |
| Clifton Road | DY11 7ES |
| Coppice Heights | DY11 7EQ |
| Coppice Trading Estate | DY11 7QY |
| Corndon Close | DY11 7EF |
| Dowles Road | DY11 7NU DY11 7NY |
| Ferguson Drive | DY11 7HE |
| Godson Crescent | DY11 7JT |
| Godson Place | DY11 7JU |
| Goldthorn Road | DY11 7JD DY11 7JN |
| Gould Avenue East | DY11 7HH |
| Gould Avenue West | DY11 7HD |
| Highley Close | DY11 7NZ |
| Jotham Close | DY11 7DQ |
| Jubilee Drive | DY11 7JE DY11 7JG DY11 7JH DY11 7JQ |
| Kinver Avenue | DY11 7HA DY11 7HB |
| Lawrence Grove | DY11 7DR |
| Lisle Avenue | DY11 7DE |
| Meredith Green | DY11 7EJ DY11 7EL |
| Neville Avenue | DY11 7AJ DY11 7AL |
| Reservoir Road | DY11 7AP |
| Shrawley Avenue | DY11 7NP |
| Spring Grove Crescent | DY11 7JB |
| Spring Grove Road | DY11 7JA |
| Stourport Road | DY11 7BG DY11 7BH DY11 7BQ DY11 7BW |
| Summer Road | DY11 7JR DY11 7JS |
| Sutton Park Road | DY11 6LB DY11 6LD |
| Teme Avenue | DY11 7NR |
| The Chestnuts | DY11 7BN |
| Tolley Road | DY11 7EW |
| Victoria Place | DY11 7JF |
| Walter Nash Road East | DY11 7BT DY11 7BY DY11 7EA DY11 7EE |
| Walter Nash Road West | DY11 7BZ DY11 7ER DY11 7EU |
| Walton Close | DY11 7EB |
| Whittall Drive East | DY11 7EG |
| Whittall Drive West | DY11 7EN DY11 7ET |
| Witley Close | DY11 7PA |
| Woodbury Road | DY11 7JJ DY11 7JL DY11 7JP |
| Young Close | DY11 7DG |
Transport near Oldington And Foley Park
- FAQ
- Price Paid By Year
- Property Type Price
Frequently asked questions about Oldington And Foley Park
What is the average price for a property for sale in Oldington And Foley Park?
The average price for a property for sale in Oldington And Foley Park is £198,941. This amount is 23% lower than the average price in Kidderminster. There are 657 property listings for sale in Oldington And Foley Park.
What streets have the most expensive properties for sale in Oldington And Foley Park?
The streets with the most expensive properties for sale in Oldington And Foley Park are Reservoir Road at an average of £288,000, Lawrence Grove at an average of £287,000 and Jotham Close at an average of £285,000.
What streets have the most affordable properties for sale in Oldington And Foley Park?
The streets with the most affordable properties for sale in Oldington And Foley Park are Woodbury Road at an average of £133,000, Jubilee Drive at an average of £136,500 and Goldthorn Road at an average of £152,500.
Which train stations are available in or near Oldington And Foley Park?
Some of the train stations available in or near Oldington And Foley Park are Kidderminster, Hartlebury and Blakedown.
Property Price Paid in Oldington And Foley Park by Year
The average sold property price by year was:
| Year | Average Sold Price | Price Change |
Sold Properties
|
|---|---|---|---|
| 2025 | £208,150 | 7% |
30 Properties |
| 2024 | £194,490 | -2% |
53 Properties |
| 2023 | £197,933 | -7% |
40 Properties |
| 2022 | £210,836 | 13% |
51 Properties |
| 2021 | £184,008 | 7% |
60 Properties |
| 2020 | £170,747 | 11% |
48 Properties |
| 2019 | £151,514 | 1% |
50 Properties |
| 2018 | £150,347 | 4% |
47 Properties |
| 2017 | £144,043 | -1% |
49 Properties |
| 2016 | £145,253 | 3% |
49 Properties |
| 2015 | £140,303 | -2% |
65 Properties |
| 2014 | £143,260 | 25% |
55 Properties |
| 2013 | £106,863 | -8% |
29 Properties |
| 2012 | £115,780 | -1% |
29 Properties |
| 2011 | £117,247 | 8% |
30 Properties |
| 2010 | £107,851 | -1% |
31 Properties |
| 2009 | £109,137 | -11% |
20 Properties |
| 2008 | £121,034 | -7% |
33 Properties |
| 2007 | £129,470 | 5% |
76 Properties |
| 2006 | £122,904 | 3% |
78 Properties |
| 2005 | £119,589 | 5% |
52 Properties |
| 2004 | £113,737 | 17% |
53 Properties |
| 2003 | £94,592 | 16% |
81 Properties |
| 2002 | £79,266 | 21% |
65 Properties |
| 2001 | £62,969 | 8% |
46 Properties |
| 2000 | £57,951 | 9% |
55 Properties |
| 1999 | £52,817 | 8% |
62 Properties |
| 1998 | £48,447 | 1% |
37 Properties |
| 1997 | £48,148 | 8% |
40 Properties |
| 1996 | £44,422 | 14% |
53 Properties |
| 1995 | £37,998 | - |
29 Properties |
Property Price per Property Type in Oldington And Foley Park
Here you can find historic sold price data in order to help with your property search.
The average Property Paid Price for specific property types in the last three years are:
| Property Type | Average Sold Price | Sold Properties |
|---|---|---|
| Semi Detached House | £197,322.00 | 79 Semi Detached Houses |
| Detached House | £332,833.00 | 6 Detached Houses |
| Terraced House | £181,167.00 | 38 Terraced Houses |

