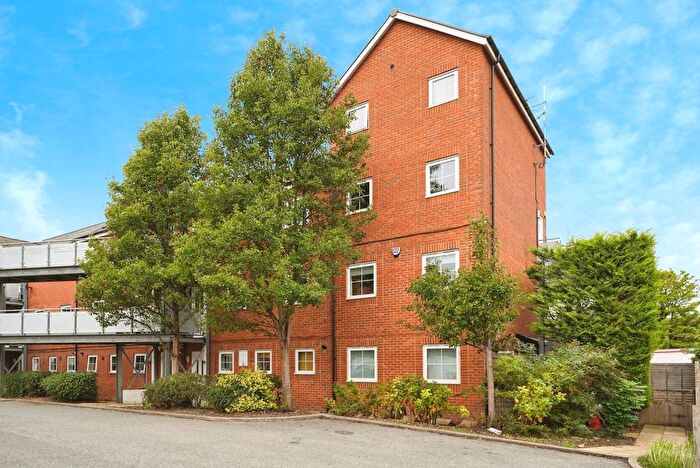
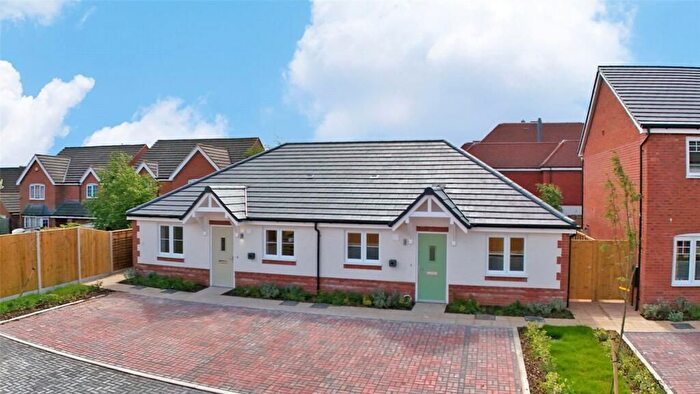
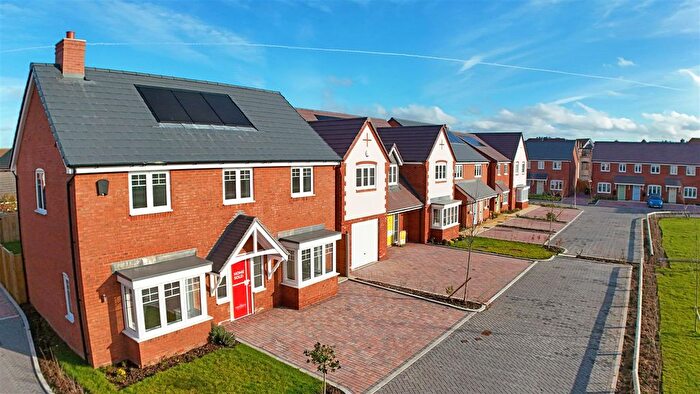
Houses for sale & to rent in Bengeworth, Evesham
House Prices in Bengeworth
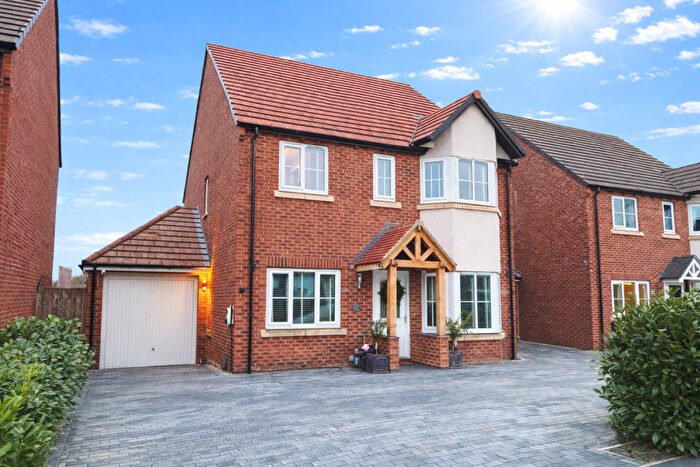
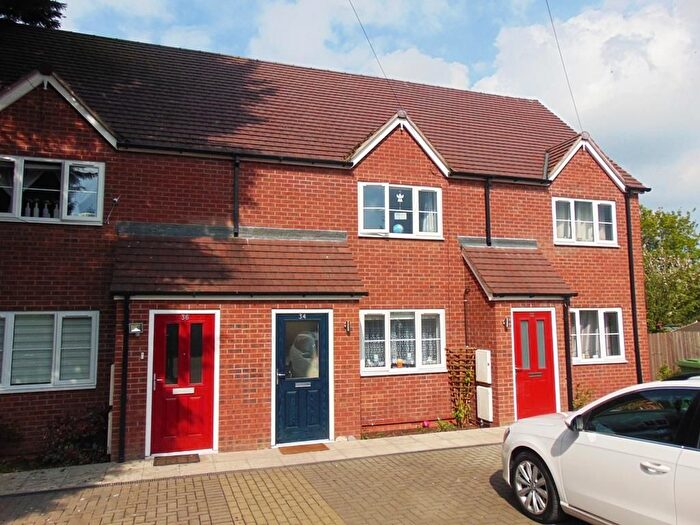
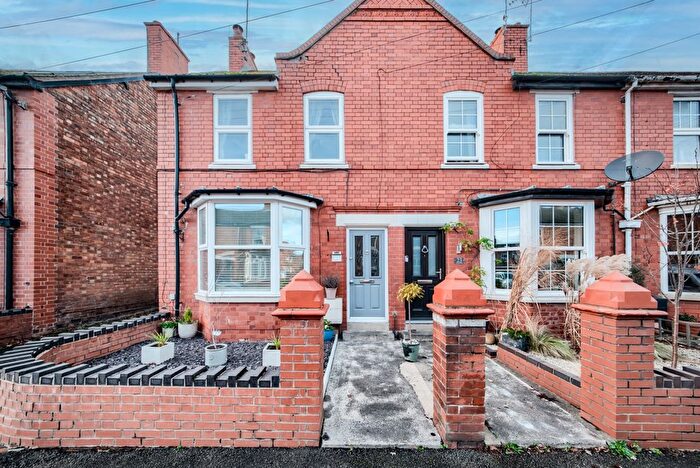
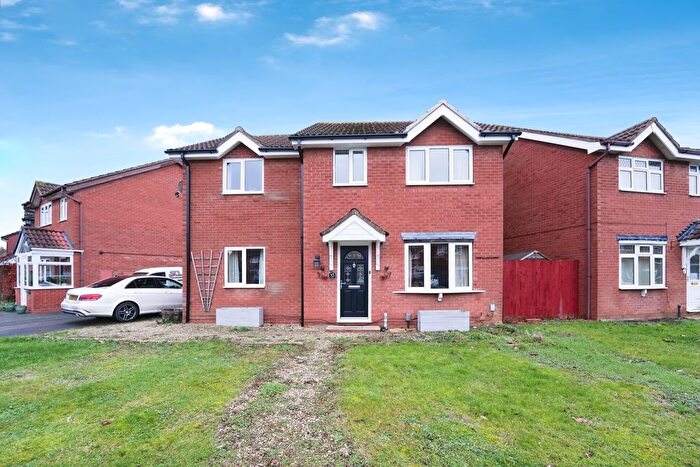
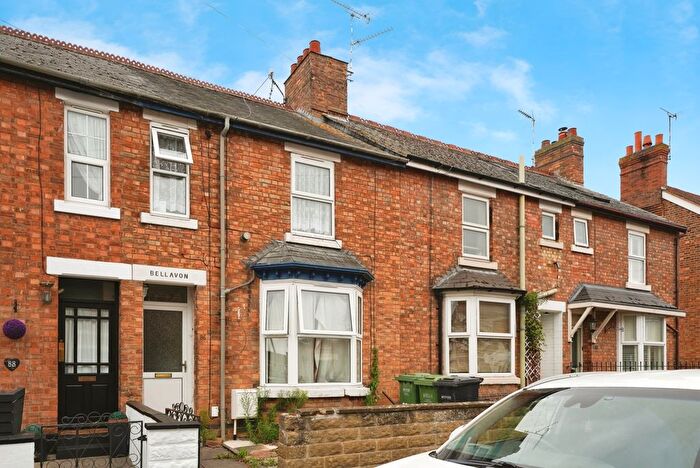
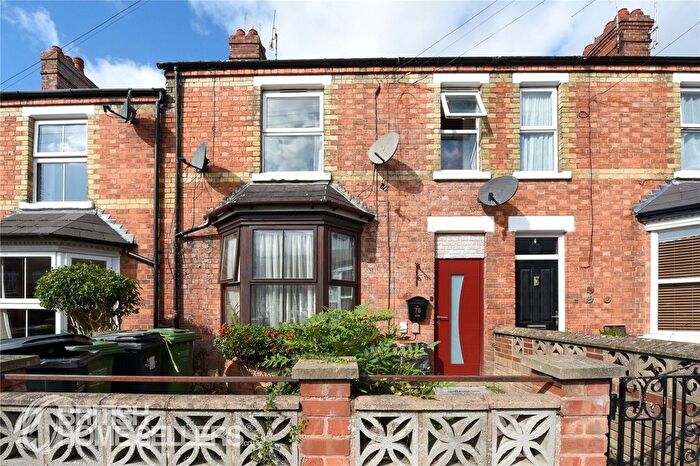
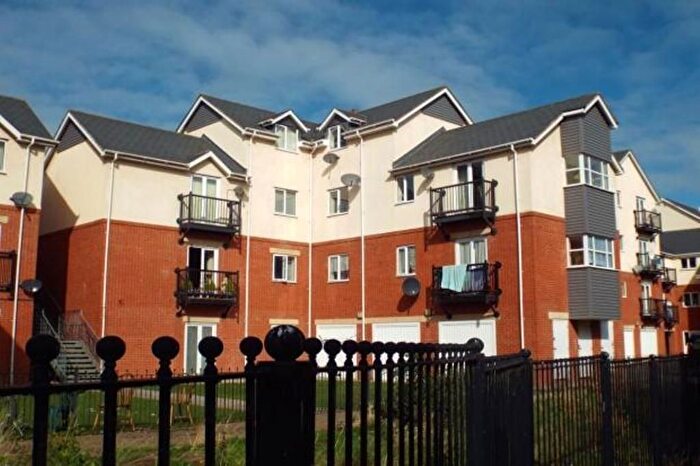
Properties in Bengeworth have an average house price of £269,721.00 and had 326 Property Transactions within the last 3 years¹.
Bengeworth is an area in Evesham, Worcestershire with 2,341 households², where the most expensive property was sold for £1,606,600.00.
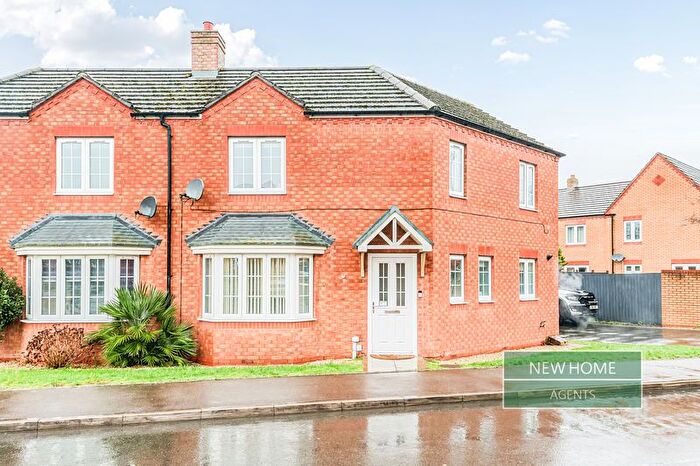
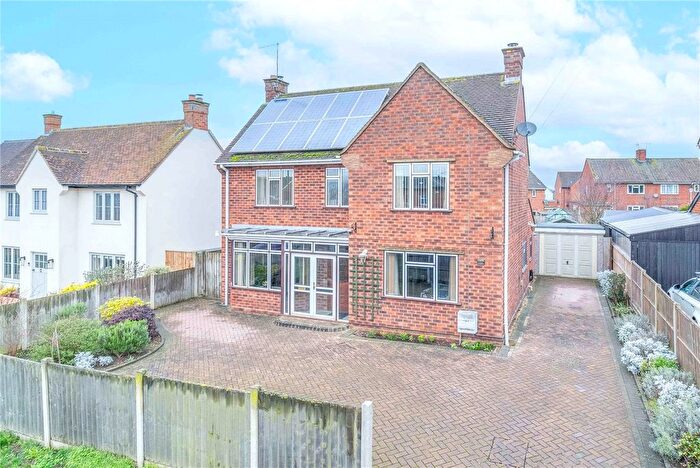
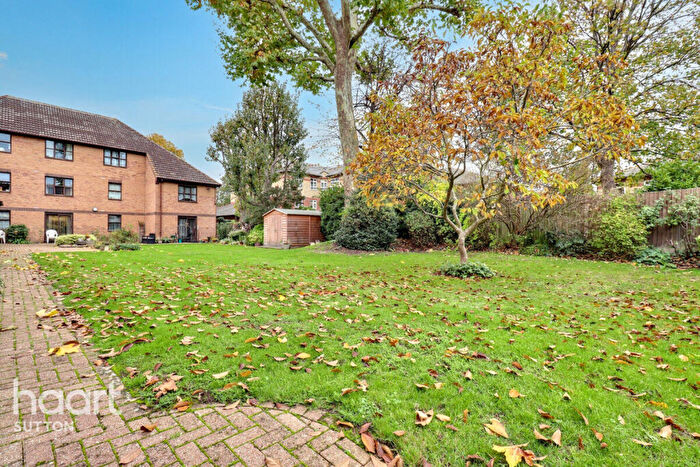
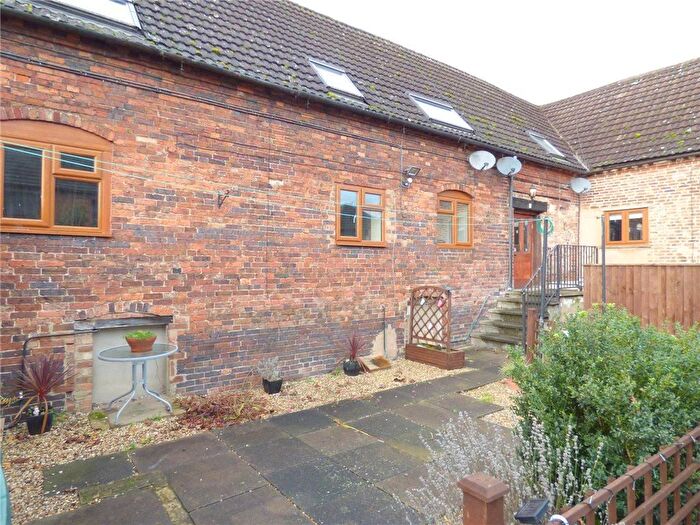
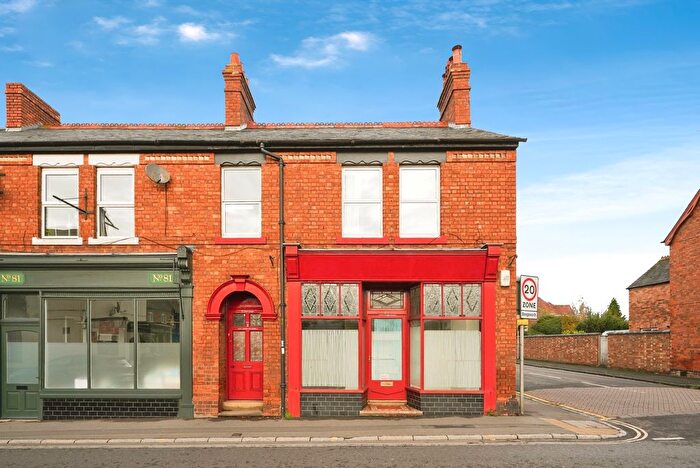
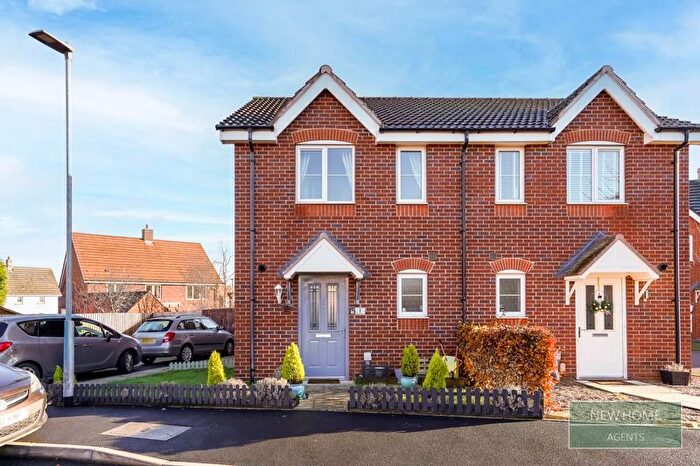
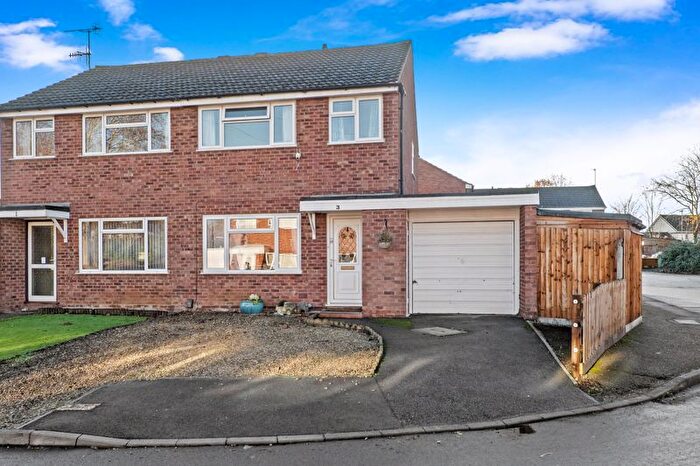
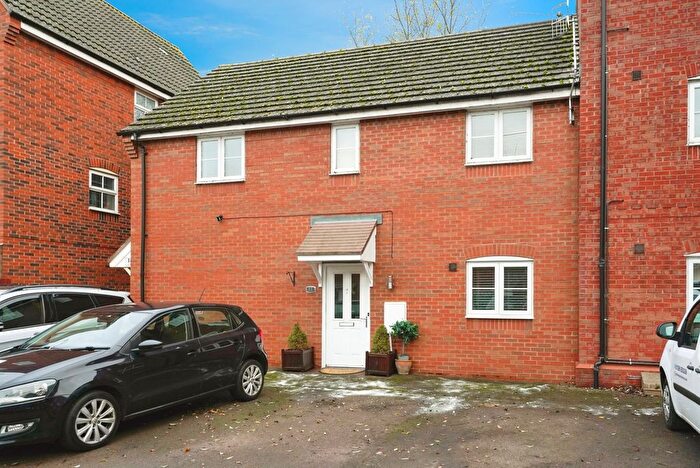
Properties for sale in Bengeworth
Previously listed properties in Bengeworth
Roads and Postcodes in Bengeworth
Navigate through our locations to find the location of your next house in Bengeworth, Evesham for sale or to rent.
| Streets | Postcodes |
|---|---|
| Abbey Gardens | WR11 4SP |
| Abbey Gate | WR11 4BQ |
| Abbey Road | WR11 4SR WR11 4SB WR11 4SS |
| Allardene | WR11 1EA |
| Badsey Lane | WR11 3BA WR11 3EX WR11 3EY WR11 3EZ WR11 7EL |
| Badsey Road | WR11 3DS WR11 3DT WR11 7PA |
| Beauty Bank | WR11 3JA |
| Biffin Close | WR11 3JB |
| Bridge Street | WR11 4RR WR11 4RY WR11 4RS WR11 4RU WR11 4SF WR11 4SG WR11 4SQ |
| Broadway Road | WR11 3NB WR11 3ND WR11 3NE WR11 7RN |
| Burford Gardens | WR11 3AJ |
| Burford Road | WR11 3AF WR11 3AG WR11 3AQ WR11 3HB WR11 3HD |
| Burlingham Avenue | WR11 3EE WR11 3EF |
| Buttercup Close | WR11 3ED |
| Castle Street | WR11 3AA WR11 3HA WR11 3HF |
| Castle Terrace | WR11 3AB |
| Cedarwood Gardens | WR11 3BN |
| Cestrum Crescent | WR11 3EG |
| Cestrum Walk | WR11 3EH |
| Chapel Street | WR11 4QJ |
| Church Street | WR11 1DS WR11 1DY WR11 1ES |
| Clementi Court | WR11 3QZ |
| Clyde Avenue | WR11 3FE |
| Codling Road | WR11 3JD WR11 3JE |
| Common Road | WR11 4PU |
| Conduit Hill | WR11 4PR |
| Conwy Drive | WR11 3FH |
| Cornflower Drive | WR11 3ES |
| Coronation Street | WR11 3DA WR11 3DB WR11 3DF |
| Costard Lane | WR11 3JF |
| Cotswold View | WR11 4PS |
| Cowl Street | WR11 4PL WR11 4RB |
| Craven Court | WR11 1FB |
| Crump Way | WR11 3JG WR11 3JH |
| Daisy Close | WR11 3EJ |
| Deacle Place | WR11 3DD WR11 3DE |
| Discovery Lane | WR11 3JJ |
| Drakes Lea | WR11 3BJ |
| Egremont Close | WR11 3JL |
| Ellison Close | WR11 3JN |
| Elm Road | WR11 3DJ WR11 3DL WR11 3DN WR11 3DR WR11 3DW |
| Elmside | WR11 3DZ |
| Fleming Drive | WR11 3FS |
| Freesia Close | WR11 3EN |
| Gardeners Square | WR11 1DZ |
| Gas Works Wharf | WR11 4BX |
| Gladstone Avenue | WR11 3JP |
| Glencoe Road | WR11 3BX |
| Harvey Road | WR11 3BQ |
| High Street | WR11 4HJ WR11 4HG WR11 4XL |
| Hillcrest | WR11 3HG |
| Hollyhocks Close | WR11 3EQ |
| Hyacinth Close | WR11 3EP |
| Jenner Drive | WR11 3FQ |
| Jonagold Place | WR11 3JQ |
| Jupiter Road | WR11 3FJ |
| Kings Road | WR11 3BB WR11 3BF WR11 3BH WR11 3BL WR11 3BP WR11 3BS WR11 3BT WR11 3BU WR11 3BW WR11 3EL WR11 3EU WR11 3BE WR11 3FL WR11 3GX WR11 3XZ |
| Knowle Hill | WR11 7EN |
| Lansdowne Mews | WR11 1WY |
| Laxton Crescent | WR11 3JS WR11 3JT |
| Leys Walk | WR11 3AD |
| Lichfield Avenue | WR11 3EA WR11 3EB |
| Lily Walk | WR11 3ER |
| Lime Street | WR11 3AH WR11 3AW WR11 3BZ |
| Lock View | WR11 4PH |
| Lower Leys | WR11 3DP WR11 3AE |
| Lupin Walk | WR11 3ET |
| Marigold Close | WR11 3EW |
| Market Place | WR11 4RW |
| Mason Court | WR11 3DG |
| Medway Road | WR11 3FA |
| Mill Bank | WR11 4PT |
| Mill Street | WR11 4HB WR11 4HD WR11 4HE WR11 4HF WR11 4HH WR11 4HL WR11 4HN WR11 4HP WR11 4HT WR11 4HU WR11 4HW WR11 4HX WR11 4LH WR11 4PP |
| Monks Walk | WR11 4SL |
| Montfort Street | WR11 3BY |
| Mortimers Quay | WR11 3AS |
| Mount Road | WR11 3HE |
| New Street | WR11 3AX |
| North Road | WR11 3AY |
| Northwick Road | WR11 3AL WR11 3AN |
| Oat Street | WR11 4PJ |
| Offenham Road | WR11 3DU WR11 3DX WR11 3DY |
| Pearmain Drive | WR11 3JU |
| Philipscote | WR11 3AZ |
| Poppy Close | WR11 3GA |
| Port Street | WR11 1AN WR11 1AP WR11 1AS WR11 1AT WR11 1AW WR11 1GJ WR11 3LD WR11 3LF WR11 3LQ WR11 1AU WR11 3LA WR11 3LH |
| Prospect Court | WR11 3PY |
| Prospect Gardens | WR11 3PX |
| Riverside Centre | WR11 4BG WR11 4RD |
| Robins Corner | WR11 4RJ |
| Robins Meadow | WR11 4RN |
| Robins Walk | WR11 4RP |
| Rose Bank | WR11 3BG |
| Russet Close | WR11 3JW |
| Seward Close | WR11 4PN |
| Shannon Way | WR11 3FF |
| Shor Street | WR11 3AT |
| Solent Place | WR11 3FB |
| Sunset Way | WR11 3JX |
| Swan Lane | WR11 4PG WR11 4PA WR11 4PB |
| Tamar Place | WR11 3FD |
| The Leys | WR11 3AP WR11 3AR |
| Tulip Drive | WR11 3GB |
| Tyne Drive | WR11 3FG |
| Viburnum Walk | WR11 3GF |
| Vine Street | WR11 4RL |
| Violet Walk | WR11 3GE |
| Wards Close | WR11 3DH |
| Waterside | WR11 1BS WR11 1BT |
| Wickhamford Lane | WR11 7RW |
| Wisteria Drive | WR11 3GD |
| Wych Elm Grove | WR11 3FT |
Transport near Bengeworth
- FAQ
- Price Paid By Year
- Property Type Price
Frequently asked questions about Bengeworth
What is the average price for a property for sale in Bengeworth?
The average price for a property for sale in Bengeworth is £269,721. This amount is 16% lower than the average price in Evesham. There are 517 property listings for sale in Bengeworth.
What streets have the most expensive properties for sale in Bengeworth?
The streets with the most expensive properties for sale in Bengeworth are Prospect Gardens at an average of £725,000, Broadway Road at an average of £560,693 and Ellison Close at an average of £510,000.
What streets have the most affordable properties for sale in Bengeworth?
The streets with the most affordable properties for sale in Bengeworth are Lower Leys at an average of £85,000, Burford Gardens at an average of £110,788 and Oat Street at an average of £119,500.
Which train stations are available in or near Bengeworth?
Some of the train stations available in or near Bengeworth are Evesham, Honeybourne and Pershore.
Property Price Paid in Bengeworth by Year
The average sold property price by year was:
| Year | Average Sold Price | Price Change |
Sold Properties
|
|---|---|---|---|
| 2025 | £278,853 | 3% |
109 Properties |
| 2024 | £271,172 | 5% |
122 Properties |
| 2023 | £257,380 | -2% |
95 Properties |
| 2022 | £261,815 | 5% |
148 Properties |
| 2021 | £248,473 | 6% |
178 Properties |
| 2020 | £232,653 | 4% |
120 Properties |
| 2019 | £224,264 | 5% |
126 Properties |
| 2018 | £213,972 | 6% |
147 Properties |
| 2017 | £202,024 | -5% |
157 Properties |
| 2016 | £212,825 | 3% |
227 Properties |
| 2015 | £207,318 | 3% |
336 Properties |
| 2014 | £200,598 | 4% |
304 Properties |
| 2013 | £192,031 | 1% |
150 Properties |
| 2012 | £190,265 | 11% |
118 Properties |
| 2011 | £169,661 | -9% |
83 Properties |
| 2010 | £184,450 | 10% |
83 Properties |
| 2009 | £166,757 | -6% |
83 Properties |
| 2008 | £177,135 | -0,5% |
63 Properties |
| 2007 | £177,947 | -7% |
124 Properties |
| 2006 | £190,146 | 10% |
144 Properties |
| 2005 | £170,976 | 10% |
102 Properties |
| 2004 | £154,523 | 12% |
163 Properties |
| 2003 | £135,238 | 16% |
183 Properties |
| 2002 | £113,776 | 12% |
182 Properties |
| 2001 | £99,787 | 1% |
143 Properties |
| 2000 | £98,672 | 13% |
164 Properties |
| 1999 | £85,400 | 2% |
190 Properties |
| 1998 | £84,031 | 22% |
170 Properties |
| 1997 | £65,869 | 10% |
144 Properties |
| 1996 | £59,456 | 16% |
117 Properties |
| 1995 | £50,102 | - |
91 Properties |
Property Price per Property Type in Bengeworth
Here you can find historic sold price data in order to help with your property search.
The average Property Paid Price for specific property types in the last three years are:
| Property Type | Average Sold Price | Sold Properties |
|---|---|---|
| Flat | £183,139.00 | 49 Flats |
| Semi Detached House | £271,899.00 | 87 Semi Detached Houses |
| Detached House | £408,571.00 | 77 Detached Houses |
| Terraced House | £210,975.00 | 113 Terraced Houses |

