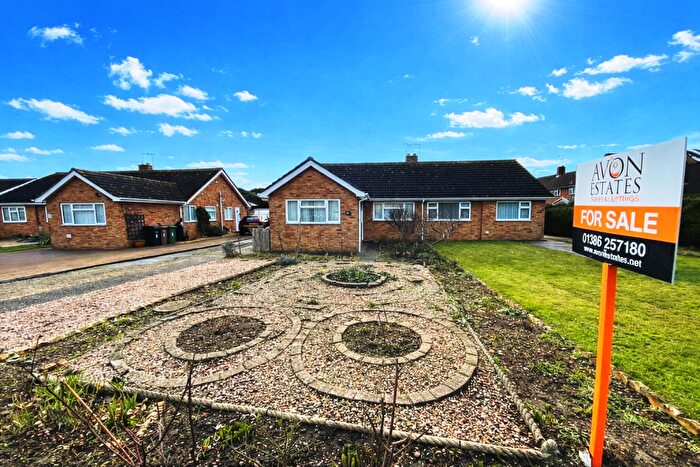
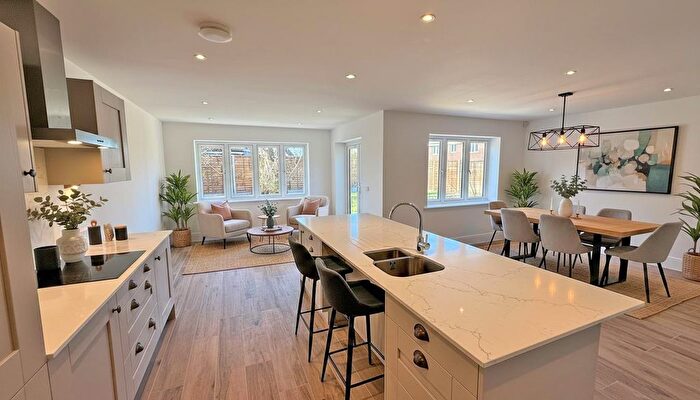
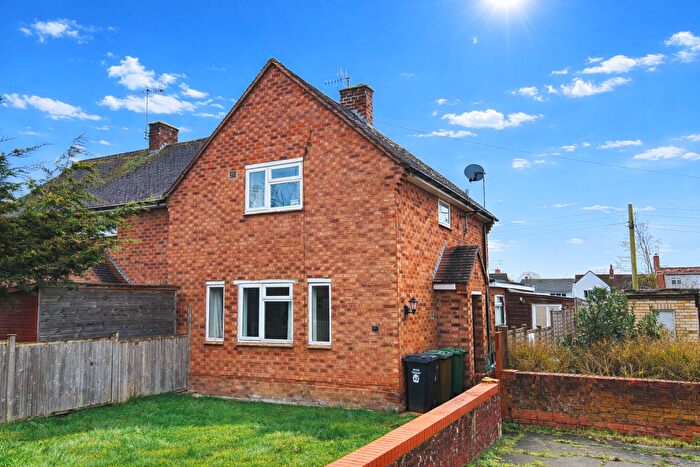
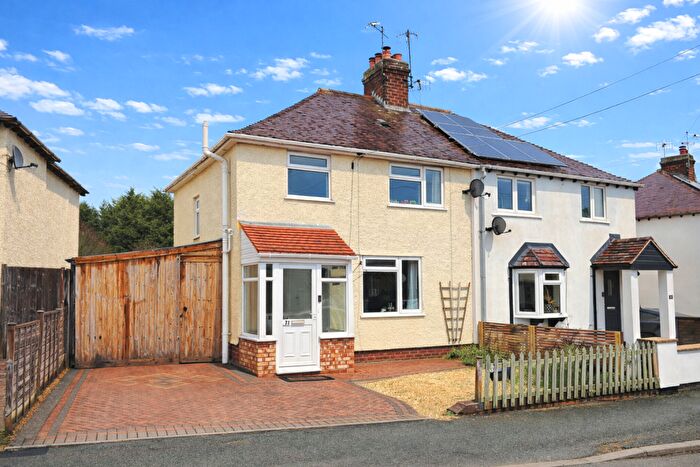
Houses for sale & to rent in Badsey, Evesham
House Prices in Badsey
Properties in Badsey have an average house price of £363,699.00 and had 138 Property Transactions within the last 3 years¹.
Badsey is an area in Evesham, Worcestershire with 1,107 households², where the most expensive property was sold for £1,175,000.00.
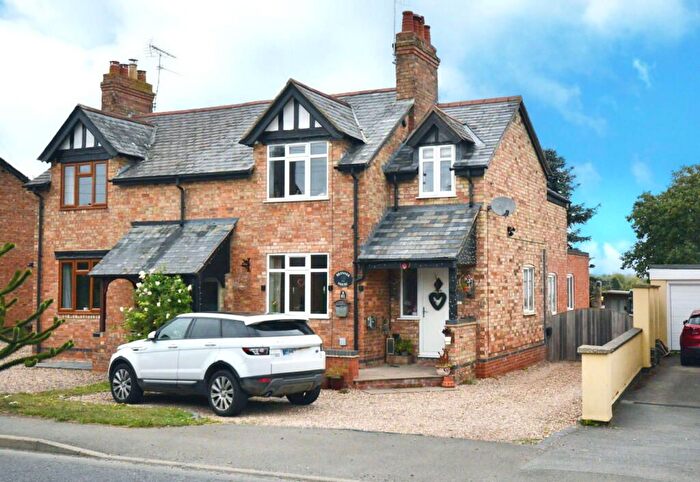
Properties for sale in Badsey
Previously listed properties in Badsey
Roads and Postcodes in Badsey
Navigate through our locations to find the location of your next house in Badsey, Evesham for sale or to rent.
| Streets | Postcodes |
|---|---|
| Allsebrook Gardens | WR11 7HJ |
| Badsey Fields Lane | WR11 7EX WR11 7ED |
| Banks Road | WR11 7TB |
| Binyon Close | WR11 7EY |
| Birmingham Road | WR11 7TW |
| Bowers Hill | WR11 7HG |
| Bretforton Road | WR11 7XG WR11 7XQ WR11 7YG WR11 7YH |
| Brewers Lane | WR11 7EU |
| Cedar Court | WR11 7EE |
| Chapel Lane | WR11 7YF |
| Chapel Street | WR11 7HA |
| Chestnut Close | WR11 7XW |
| Church End | WR11 7JZ |
| Evesham Bypass | WR11 7DY WR11 8UB |
| Fields Close | WR11 7JN |
| Fothersway Close | WR11 7FA |
| Green Leys | WR11 7XE |
| High Street | WR11 7EJ WR11 7XH |
| Hillside | WR11 7YB |
| Hither Green | WR11 7XY |
| Horsebridge Avenue | WR11 7XD |
| Kingshurst Drive | WR11 7ZF |
| Kingshurst Gardens | WR11 7AR |
| Lambourne Close | WR11 3JR |
| Lodge Park Drive | WR11 3JY |
| Main Street | WR11 7XB |
| Manor Close | WR11 7HH |
| Manor Gardens | WR11 7YA |
| Manorside | WR11 7EQ |
| Maybush Gardens | WR11 7YL |
| Mill Lane | WR11 7EP WR11 7YQ |
| Oak Close | WR11 7TN |
| Offenham Road | WR11 7QQ WR11 8DX |
| Offenham View | WR11 3JZ |
| Old Post Office Lane | WR11 7XF |
| Orchard Way | WR11 7EW |
| Packs Close | WR11 7SF |
| Pear Tree Lane | WR11 7JT |
| Pitwell Lane | WR11 7AB |
| Poplar Court | WR11 7EF |
| Sands Lane | WR11 7EZ |
| School Lane | WR11 7ES |
| Seward Close | WR11 7FW |
| Seward Road | WR11 7HQ |
| Sidings Lane | WR11 7ZN |
| Sladden Close | WR11 7AQ |
| St James Close | WR11 7ET |
| Stone Pippin Orchard | WR11 7AA |
| Synehurst | WR11 7XJ |
| Synehurst Avenue | WR11 7XL |
| Synehurst Crescent | WR11 7XX |
| The Drift | WR11 7XZ |
| The Hopgardens | WR11 7YD |
| The Knapp | WR11 7JL |
| The Lankets | WR11 7EH |
| The Parks | WR11 8JP |
| The Poplars | WR11 7ER |
| Trails Orchard | WR11 7YJ |
| Turnpike Drive | WR11 3LB |
| Village Street | WR11 7YE |
| Willersey Road | WR11 7HB WR11 7HD WR11 7HE |
| WR11 7XA |
Transport near Badsey
- FAQ
- Price Paid By Year
- Property Type Price
Frequently asked questions about Badsey
What is the average price for a property for sale in Badsey?
The average price for a property for sale in Badsey is £363,699. This amount is 13% higher than the average price in Evesham. There are 330 property listings for sale in Badsey.
What streets have the most expensive properties for sale in Badsey?
The streets with the most expensive properties for sale in Badsey are Village Street at an average of £786,333, Offenham View at an average of £725,000 and Mill Lane at an average of £650,000.
What streets have the most affordable properties for sale in Badsey?
The streets with the most affordable properties for sale in Badsey are Cedar Court at an average of £140,000, Poplar Court at an average of £171,285 and The Parks at an average of £191,172.
Which train stations are available in or near Badsey?
Some of the train stations available in or near Badsey are Evesham, Honeybourne and Pershore.
Property Price Paid in Badsey by Year
The average sold property price by year was:
| Year | Average Sold Price | Price Change |
Sold Properties
|
|---|---|---|---|
| 2025 | £359,680 | -7% |
63 Properties |
| 2024 | £383,470 | 11% |
45 Properties |
| 2023 | £342,483 | -3% |
30 Properties |
| 2022 | £354,292 | -3% |
50 Properties |
| 2021 | £363,238 | 5% |
56 Properties |
| 2020 | £344,932 | 18% |
39 Properties |
| 2019 | £282,022 | -9% |
51 Properties |
| 2018 | £306,344 | -1% |
119 Properties |
| 2017 | £309,545 | 15% |
77 Properties |
| 2016 | £263,766 | 4% |
65 Properties |
| 2015 | £253,574 | 4% |
64 Properties |
| 2014 | £243,271 | -11% |
49 Properties |
| 2013 | £269,585 | 18% |
53 Properties |
| 2012 | £219,932 | -31% |
31 Properties |
| 2011 | £287,589 | 11% |
36 Properties |
| 2010 | £257,290 | 19% |
36 Properties |
| 2009 | £208,446 | -9% |
25 Properties |
| 2008 | £227,325 | -10% |
26 Properties |
| 2007 | £249,135 | 18% |
45 Properties |
| 2006 | £205,116 | -18% |
40 Properties |
| 2005 | £242,500 | 10% |
33 Properties |
| 2004 | £217,285 | -8% |
28 Properties |
| 2003 | £234,632 | 36% |
32 Properties |
| 2002 | £149,960 | 17% |
50 Properties |
| 2001 | £124,702 | -3% |
46 Properties |
| 2000 | £128,290 | 22% |
49 Properties |
| 1999 | £100,520 | 17% |
44 Properties |
| 1998 | £83,217 | 7% |
54 Properties |
| 1997 | £77,654 | 13% |
56 Properties |
| 1996 | £67,733 | -3% |
37 Properties |
| 1995 | £69,982 | - |
36 Properties |
Property Price per Property Type in Badsey
Here you can find historic sold price data in order to help with your property search.
The average Property Paid Price for specific property types in the last three years are:
| Property Type | Average Sold Price | Sold Properties |
|---|---|---|
| Semi Detached House | £286,383.00 | 56 Semi Detached Houses |
| Detached House | £480,731.00 | 63 Detached Houses |
| Terraced House | £211,735.00 | 17 Terraced Houses |
| Flat | £133,750.00 | 2 Flats |

