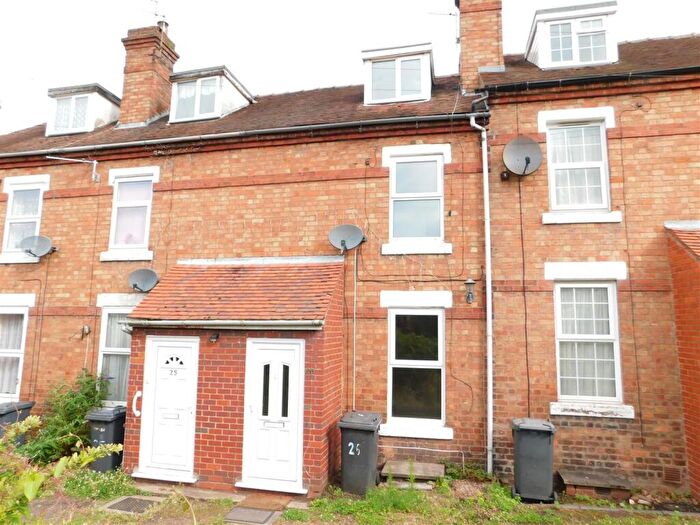
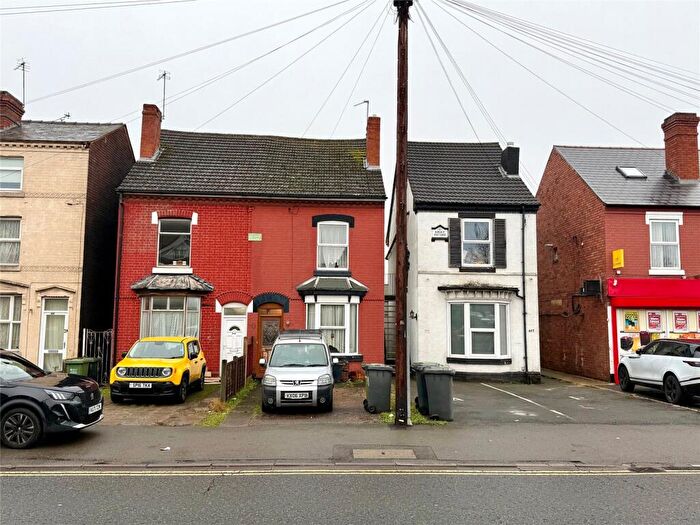
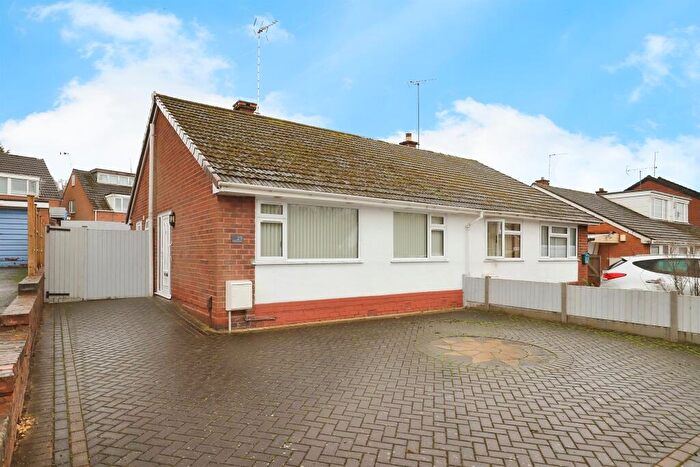
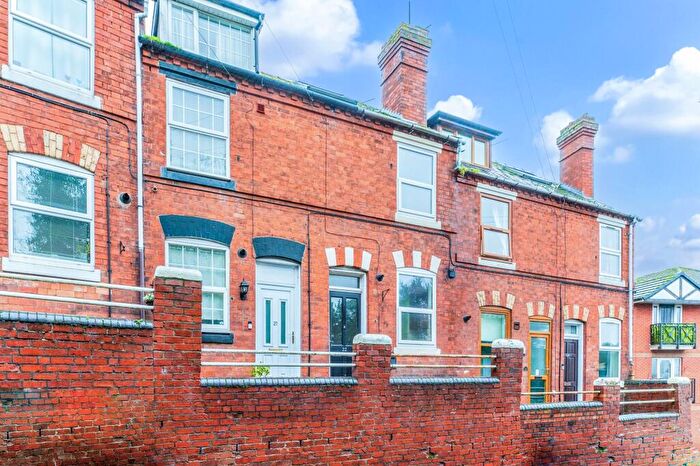
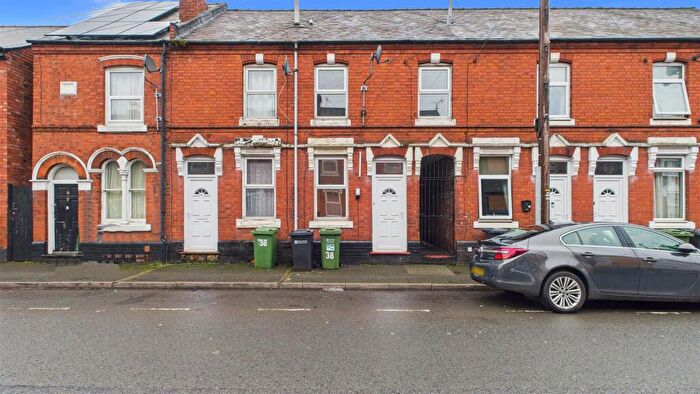
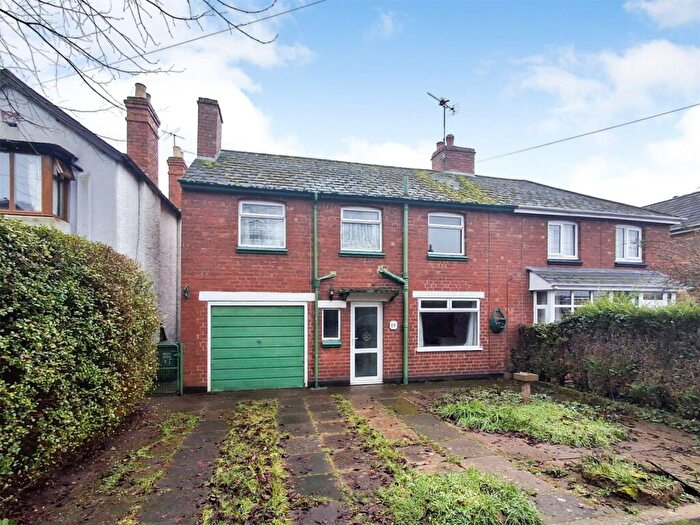
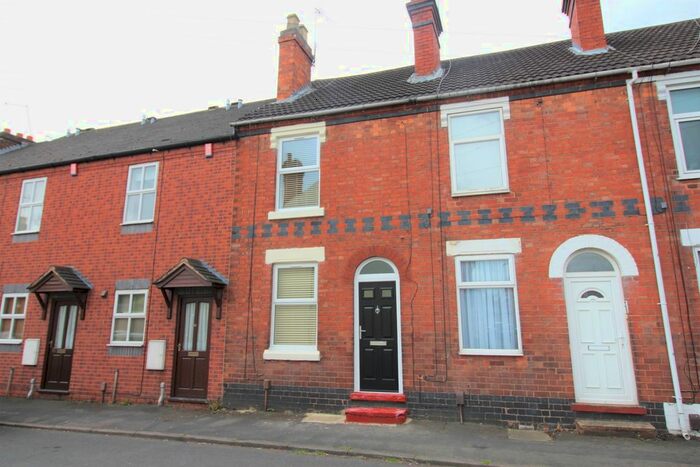
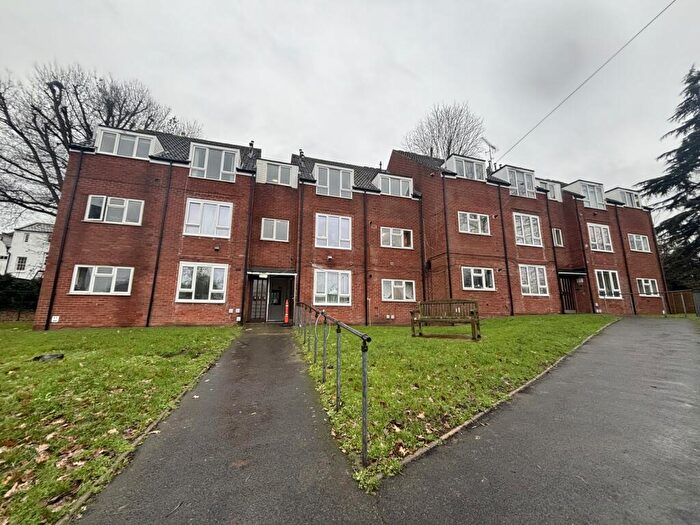
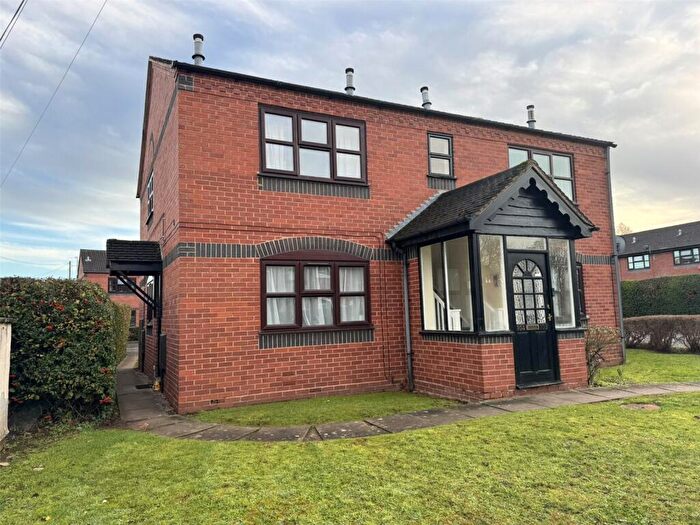
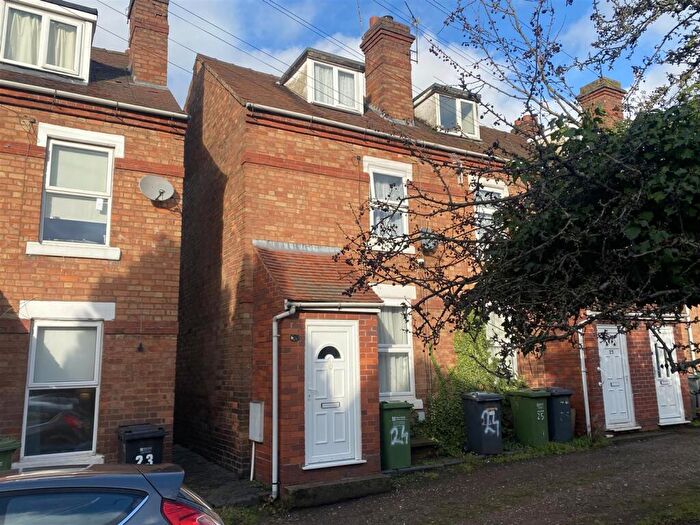
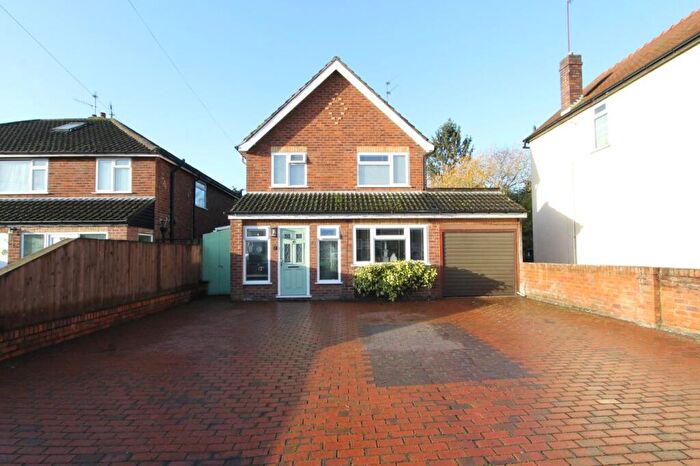
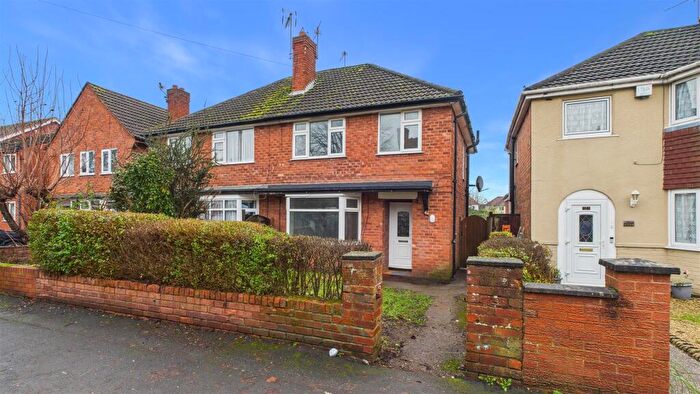
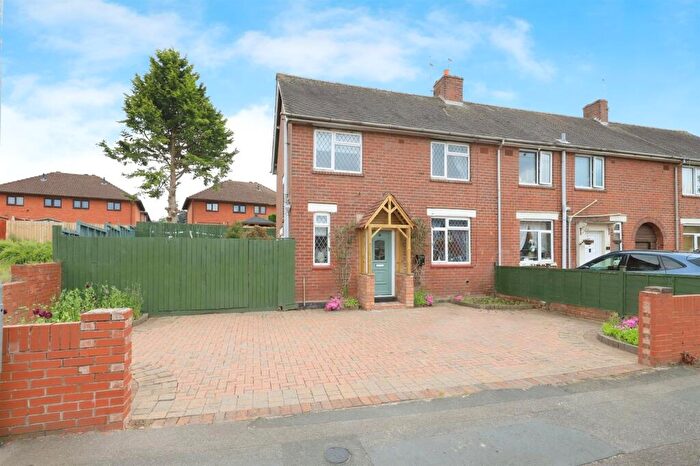
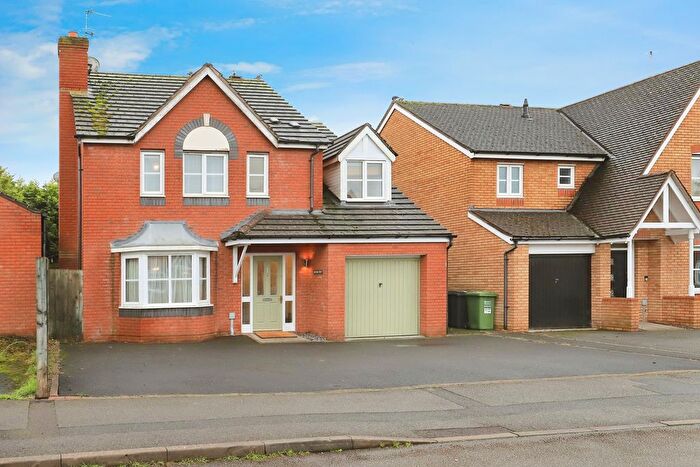
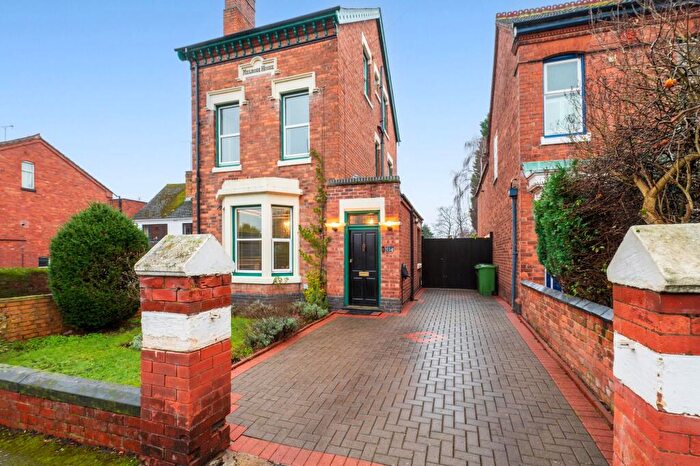
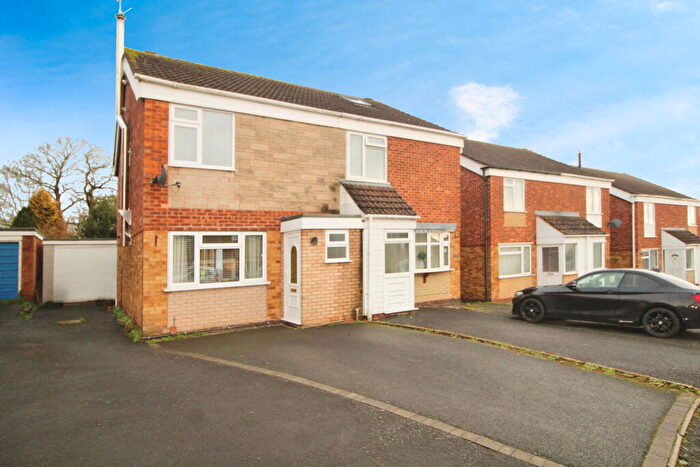
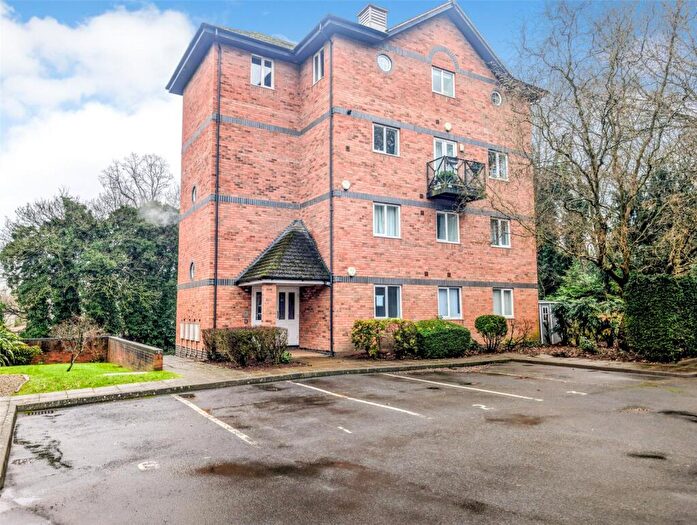
Houses for sale & to rent in Blakebrook & Habberley South, Kidderminster
House Prices in Blakebrook & Habberley South
Properties in Blakebrook & Habberley South have an average house price of £157,214.00 and had 7 Property Transactions within the last 3 years¹.
Blakebrook & Habberley South is an area in Kidderminster, Worcestershire with 378 households², where the most expensive property was sold for £315,000.00.
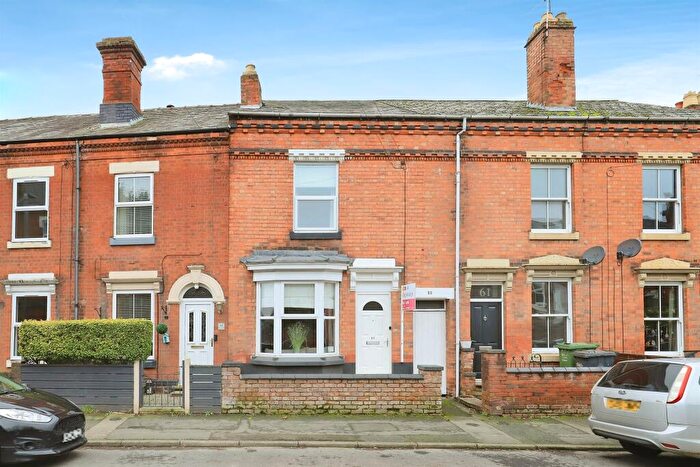
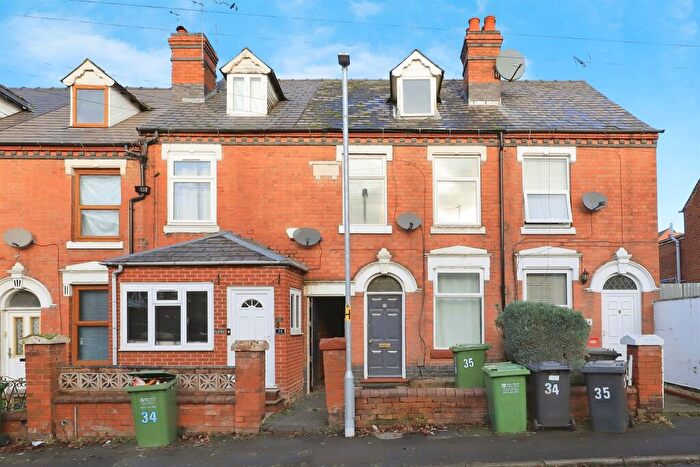
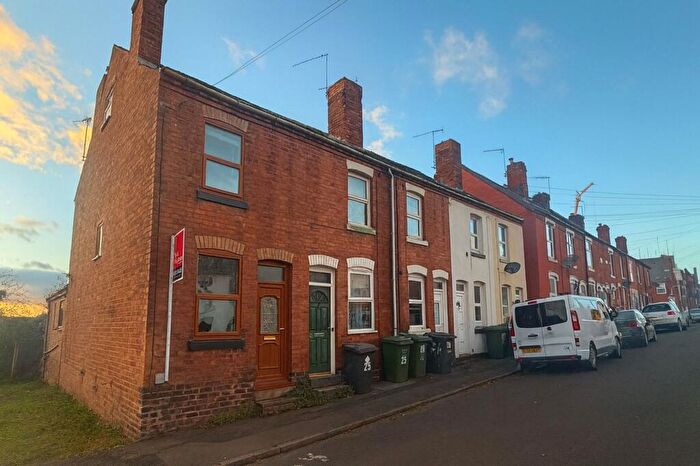
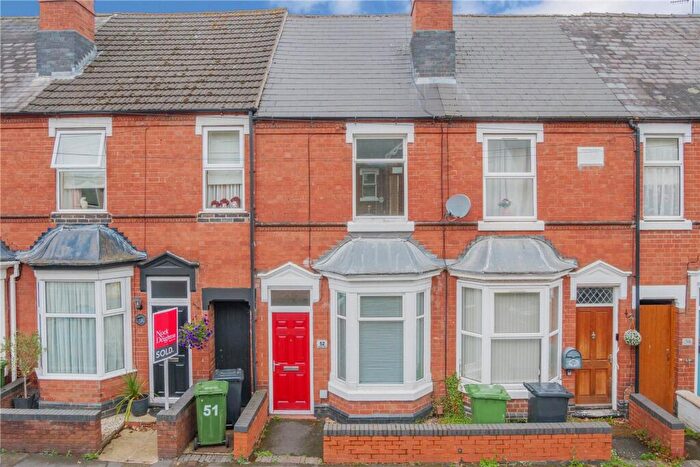
Properties for sale in Blakebrook & Habberley South
Roads and Postcodes in Blakebrook & Habberley South
Navigate through our locations to find the location of your next house in Blakebrook & Habberley South, Kidderminster for sale or to rent.
| Streets | Postcodes |
|---|---|
| Bewdley Road | DY11 6RJ DY11 6RQ DY11 6RS DY11 6RX |
| Blackwell Street | DY10 2DP DY10 2DU DY10 2DZ DY10 2EA |
| Bridge Street | DY10 1BN |
| Bromsgrove Street | DY10 1PE DY10 1PF DY10 1PG DY10 1PW |
| Broomfield Green | DY11 6AJ |
| Callows Lane | DY10 2JG |
| Canterbury Road | DY11 6DH DY11 6FD |
| Carter Avenue | DY11 6PT |
| Castle Road | DY11 6SW |
| Chapel Place | DY11 6AS |
| Church Street | DY10 2AD DY10 2AH DY10 2AR DY10 2AT DY10 2AU DY10 2AX DY10 2AY |
| Coley Close | DY11 6FF |
| Coventry Street | DY10 2BG DY10 2DG |
| Crowther Street | DY11 6YD |
| Derrick Burchers Mall | DY10 2DN |
| Dixon Street | DY10 1RD |
| Exchange Street | DY10 1BT DY10 1BY |
| Green Street | DY10 1AX DY10 1AZ DY10 1HA DY10 1HR DY10 1JF |
| Green Street Trading Estate | DY10 1HN |
| Guildford Close | DY11 6DW |
| Habberley Road | DY11 5PG DY11 5PQ DY11 6AN DY11 6FA |
| Hereford Close | DY11 6DP |
| High Street | DY10 2DJ DY10 2DL DY10 2DQ |
| Hume Street | DY11 6SF |
| Island Drive | DY10 1EZ |
| Jordan Close | DY11 6DU |
| Josiah Mason Mall | DY10 1EJ |
| King Charles Close | DY11 6SB |
| King Charles Square | DY10 2BA |
| Lion Square | DY10 1PD |
| Lion Street | DY10 1PT |
| Lower Mill Street | DY11 6TT DY11 6UT DY11 6UU DY11 6UX |
| Market Street | DY10 1AB DY10 1LX |
| Marlborough Street | DY10 1AY |
| Mason Road | DY11 6AE |
| Masons Yard | DY11 6UY |
| Meadow Mill Industrial Estate | DY10 1HH |
| Mill Lane | DY11 6YN |
| Mill Street | DY11 6XD |
| New Road | DY10 1AL DY10 1AQ DY10 1HG |
| Orchard Street | DY10 2JA DY10 2JE |
| Oxford Street | DY10 1AR DY10 1AU DY10 1BB DY10 1BJ DY10 1BL DY10 1BQ |
| Park Lane | DY11 6SE DY11 6SG DY11 6SH DY11 6TL DY11 6TQ |
| Park Lane Industrial Estate | DY11 6TJ |
| Paternoster Row | DY11 6RU |
| Prospect Hill | DY10 1PA |
| Proud Cross | DY11 6XR |
| Shrewsbury Road | DY11 6DR |
| Steve Roberts Court | DY11 6DT |
| Stourport Road | DY10 1HE |
| Sutton Road | DY11 6GD |
| Tintern Close | DY11 6HF |
| Towers Buildings | DY10 2DY |
| Tram Street | DY10 1AS |
| Venture Court | DY11 6XE |
| Vicar Street | DY10 1DA DY10 1DB DY10 1DD DY10 1DE |
| Waterloo Street | DY10 2ED DY11 7FQ |
| Weavers Wharf | DY10 1AA |
| Westminster Road | DY11 6HQ |
| Willis Street | DY11 6QD |
| Wood Street | DY11 6UH |
| Woodfield Street | DY11 6YA |
| Worcester Street | DY10 1EA DY10 1EH DY10 1EL DY10 1EQ DY10 1ER DY10 1EW |
| DY10 2AA DY10 2AZ DY10 2DS DY11 6FE |
Transport near Blakebrook & Habberley South
- FAQ
- Price Paid By Year
- Property Type Price
Frequently asked questions about Blakebrook & Habberley South
What is the average price for a property for sale in Blakebrook & Habberley South?
The average price for a property for sale in Blakebrook & Habberley South is £157,214. This amount is 39% lower than the average price in Kidderminster. There are 1,493 property listings for sale in Blakebrook & Habberley South.
Which train stations are available in or near Blakebrook & Habberley South?
Some of the train stations available in or near Blakebrook & Habberley South are Kidderminster, Blakedown and Hartlebury.
Property Price Paid in Blakebrook & Habberley South by Year
The average sold property price by year was:
| Year | Average Sold Price | Price Change |
Sold Properties
|
|---|---|---|---|
| 2024 | £183,750 | 20% |
2 Properties |
| 2023 | £146,600 | -53% |
5 Properties |
| 2022 | £224,765 | 46% |
10 Properties |
| 2021 | £120,583 | -62% |
6 Properties |
| 2020 | £195,500 | 40% |
14 Properties |
| 2019 | £117,305 | 9% |
9 Properties |
| 2018 | £106,458 | -11% |
17 Properties |
| 2017 | £117,991 | 32% |
17 Properties |
| 2016 | £80,429 | -329% |
16 Properties |
| 2014 | £345,000 | 67% |
1 Property |
| 2011 | £112,500 | -136% |
1 Property |
| 2008 | £265,000 | 17% |
1 Property |
| 2007 | £220,000 | -51% |
1 Property |
| 2006 | £331,650 | 74% |
3 Properties |
| 2003 | £85,000 | -6% |
1 Property |
| 2000 | £90,000 | - |
1 Property |
Property Price per Property Type in Blakebrook & Habberley South
Here you can find historic sold price data in order to help with your property search.
The average Property Paid Price for specific property types in the last three years are:
| Property Type | Average Sold Price | Sold Properties |
|---|---|---|
| Semi Detached House | £203,125.00 | 4 Semi Detached Houses |
| Flat | £96,500.00 | 2 Flats |
| Terraced House | £95,000.00 | 1 Terraced House |

