
Houses for sale in Kidderminster, Worcestershire
House Prices in Kidderminster
Properties in Kidderminster have an average house price of £260k and had 2,757 Property Transactions within the last 3 years.¹
Kidderminster is an area in Worcestershire with 31,758 households², where the most expensive property was sold for £2M.
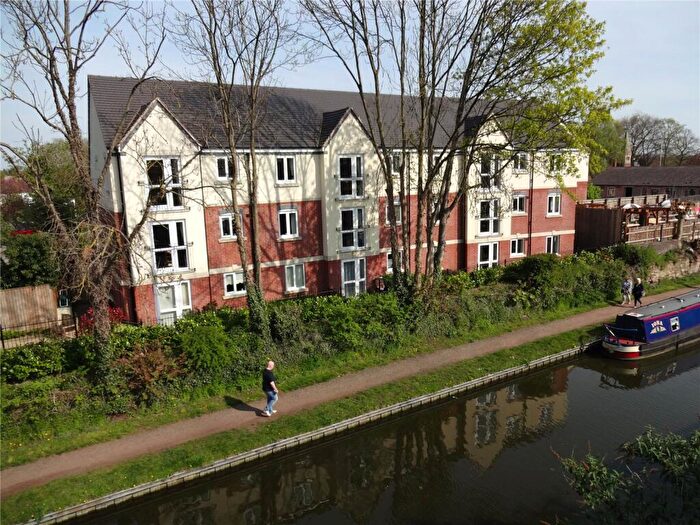
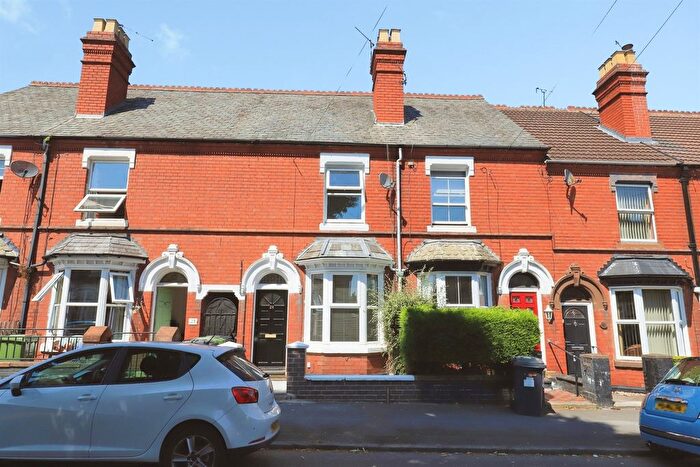
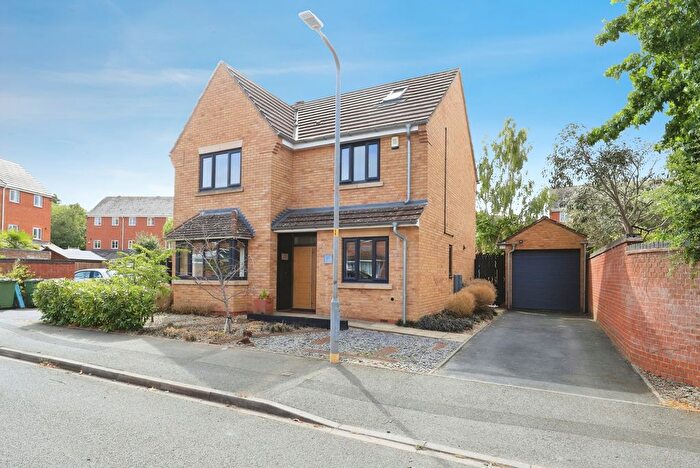
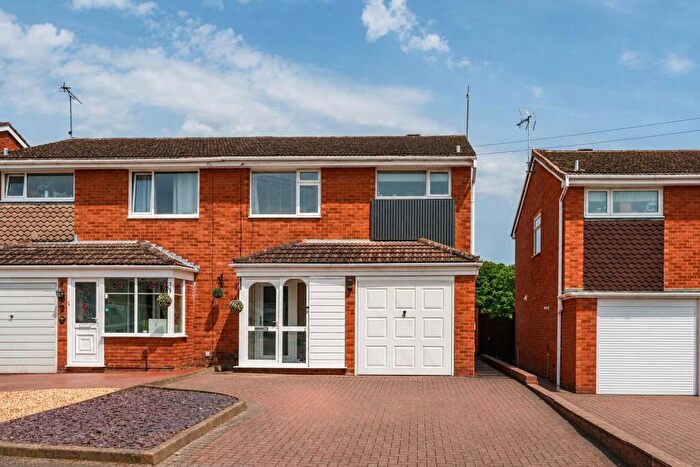
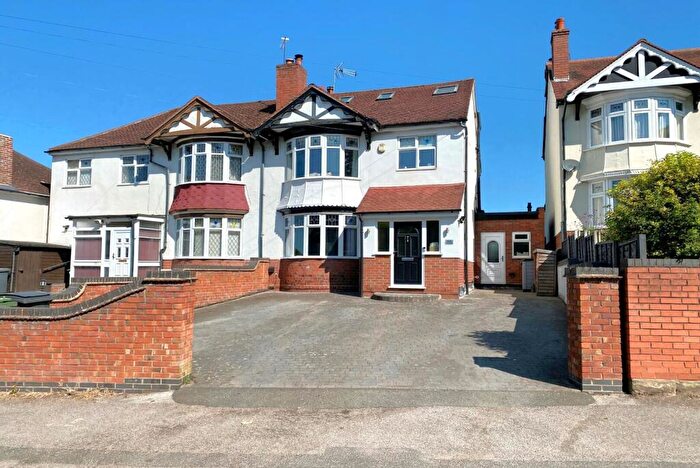
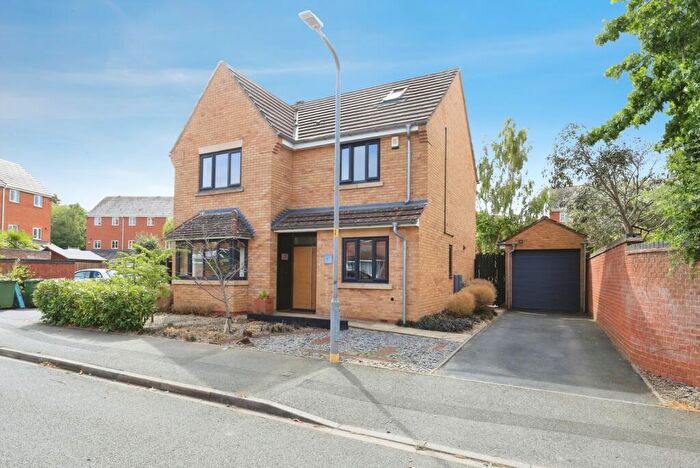
Properties for sale in Kidderminster
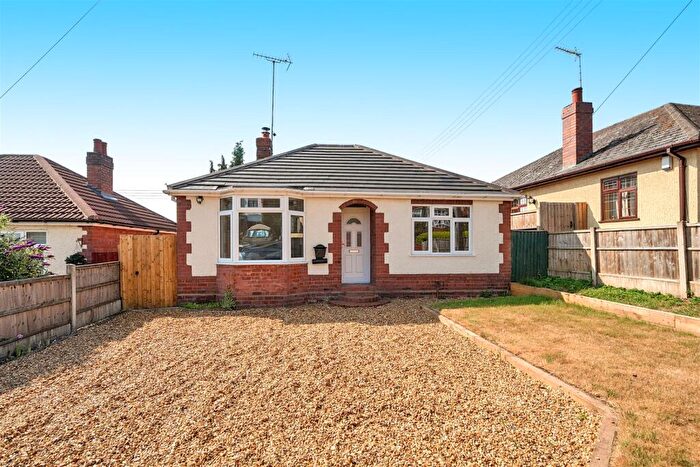

![]()
If you are looking to sell your house, let it out, or receive a property valuation, an expert can help you.
Click the button below to get started.


Neighbourhoods in Kidderminster
Navigate through our locations to find the location of your next house in Kidderminster, Worcestershire for sale or to rent.
- Aggborough And Spennells
- Blakedown And Chaddesley
- Broadwaters
- Cookley
- Franche
- Furlongs
- Greenhill
- Habberley And Blakebrook
- Hartlebury
- Lindridge
- Offmore And Comberton
- Oldington And Foley Park
- Rock
- Sutton Park
- Wolverley
- Wribbenhall
- Wribbenhall & Arley
- Blakebrook & Habberley South
- Aggborough & Spennells
- Foley Park & Hoobrook
- Offmore & Comberton
- Franche & Habberley North
- Wyre Forest Rural
- Bewdley & Rock
Property price trends in Kidderminster
According to the latest Land Registry data, the average home in Kidderminster sold for £261,729 in 2026. That figure comes from a substantial record of 34,536 sales logged over the past 31 years.
Prices have moved up over the last three years. Compared with 2023, when the typical sale came in around £252,091, that's a rise of roughly 3.8%.
Looking back five years, average prices are up about 8.1% since 2021, a gain of around £19,647 in cash terms.
Zoom out to the past decade for the fuller picture. Back in 2016, homes here averaged £194,427, so the typical sold price has climbed about 34.6% since then, roughly 3% a year. Stretch the view to fifteen years and that annual pace eases back to about 2.7%.
Frequently asked questions about Kidderminster
What is the average price for a property for sale in Kidderminster?
The average price for a property for sale in Kidderminster is £260,313. This amount is 19% lower than the average price in Worcestershire. There are more than 10,000 property listings for sale in Kidderminster.
What locations have the most expensive properties for sale in Kidderminster?
The locations with the most expensive properties for sale in Kidderminster are Bewdley & Rock at an average of £640,000, Blakedown And Chaddesley at an average of £544,228 and Wribbenhall & Arley at an average of £517,500.
What locations have the most affordable properties for sale in Kidderminster?
The locations with the most affordable properties for sale in Kidderminster are Aggborough & Spennells at an average of £120,785, Blakebrook & Habberley South at an average of £143,944 and Oldington And Foley Park at an average of £198,601.
Which train stations are available in or near Kidderminster?
Some of the train stations available in or near Kidderminster are Kidderminster, Hartlebury and Blakedown.
Property Price Paid in Kidderminster by Year
The average sold property price by year was:
| Year | Average Sold Price | Price Change |
Sold Properties
|
|---|---|---|---|
| 2026 | £261,729 | -4% |
63 Properties |
| 2025 | £272,200 | 6% |
937 Properties |
| 2024 | £255,532 | 1% |
935 Properties |
| 2023 | £252,091 | -6% |
822 Properties |
| 2022 | £267,247 | 9% |
1,023 Properties |
| 2021 | £242,082 | 4% |
1,237 Properties |
| 2020 | £232,585 | 11% |
969 Properties |
| 2019 | £206,804 | -1% |
1,104 Properties |
| 2018 | £208,883 | 1% |
1,160 Properties |
| 2017 | £207,291 | 6% |
1,217 Properties |
Property Price per Property Type in Kidderminster
Here you can find historic sold price data in order to help with your property search.
The average Property Paid Price for specific property types in the last three years are:
| Property Type | Average Sold Price | Sold Properties |
|---|---|---|
| Semi Detached House | £245,387.00 | 981 Semi Detached Houses |
| Terraced House | £186,261.00 | 779 Terraced Houses |
| Detached House | £401,223.00 | 759 Detached Houses |
| Flat | £114,838.00 | 238 Flats |
Transport in Kidderminster
Please see below transportation links in this area:
