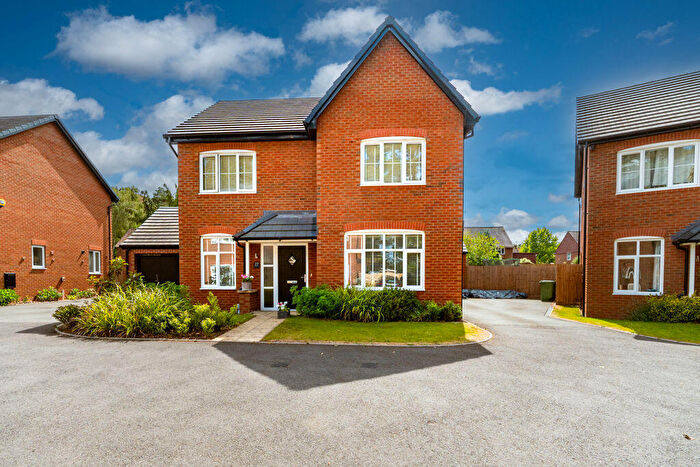
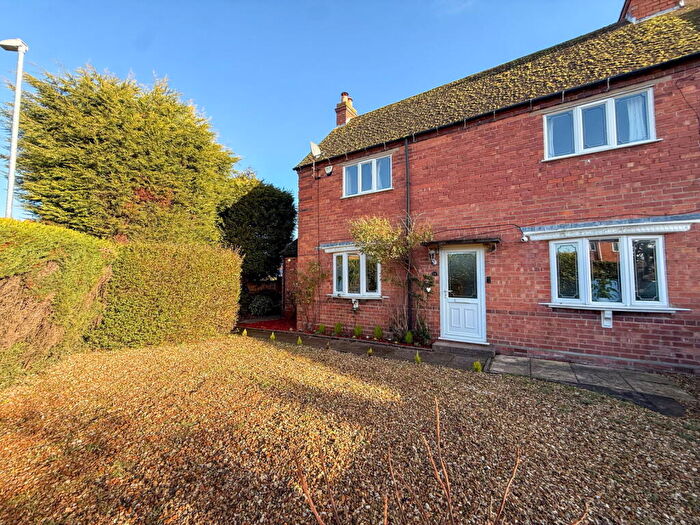
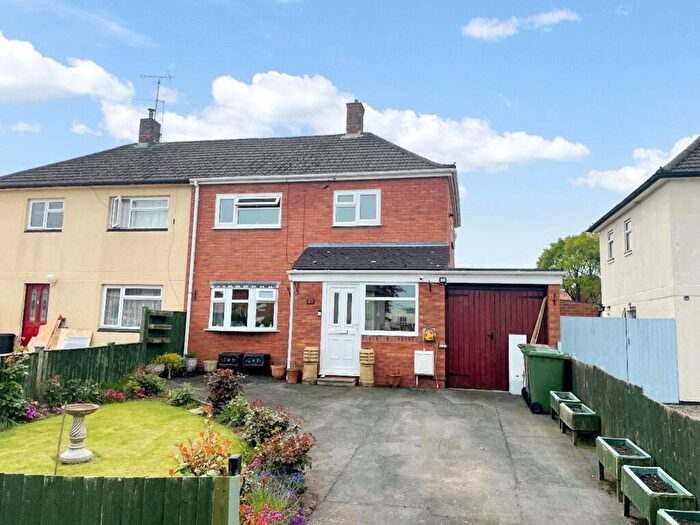
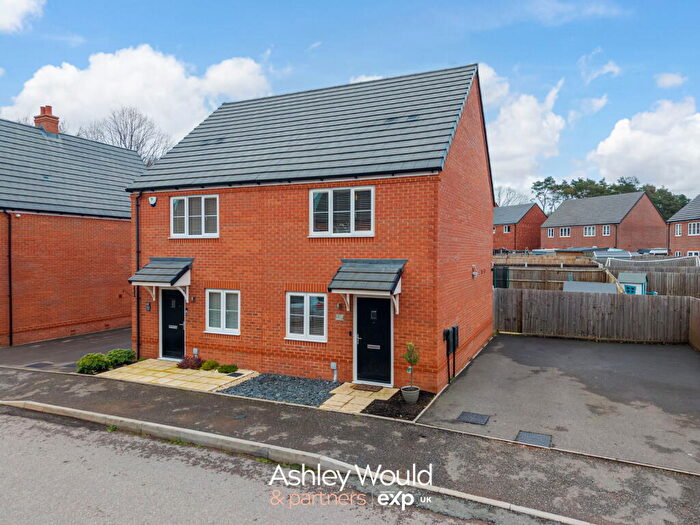
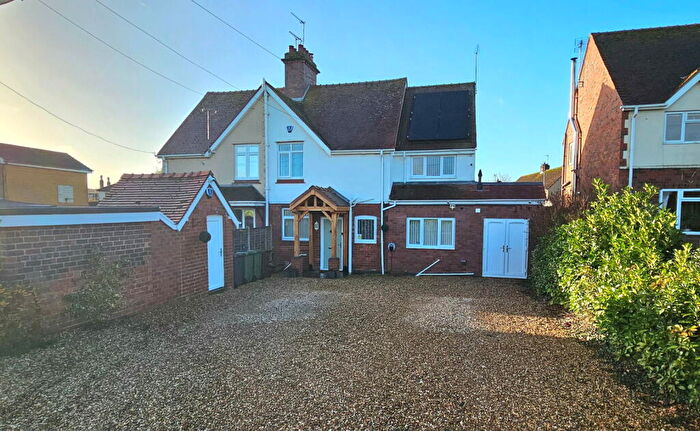
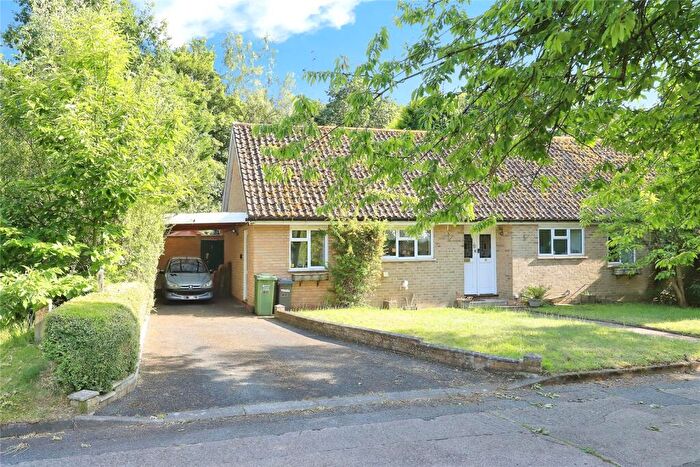
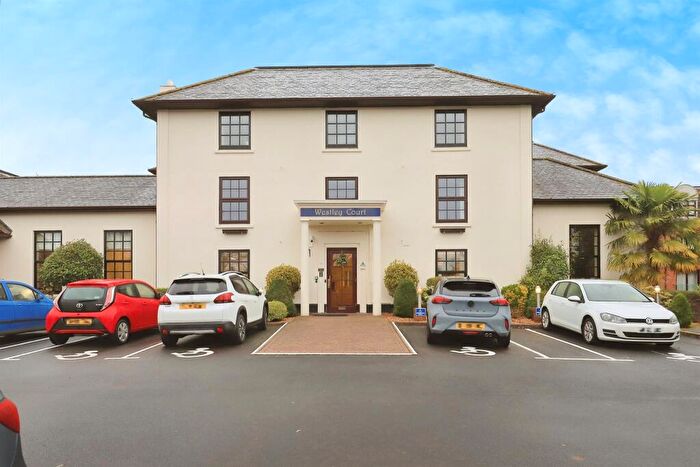
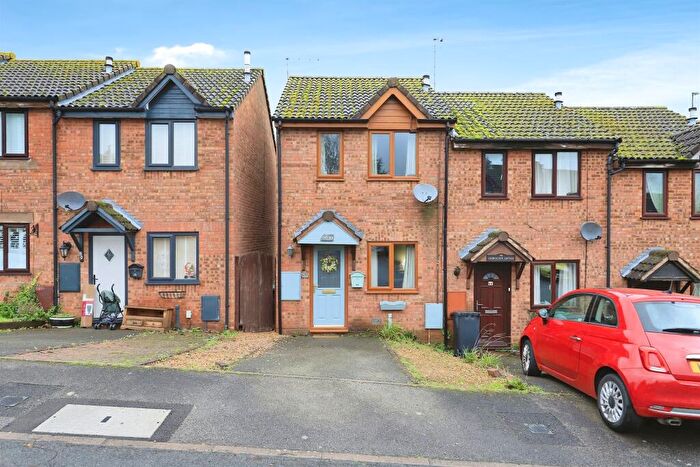
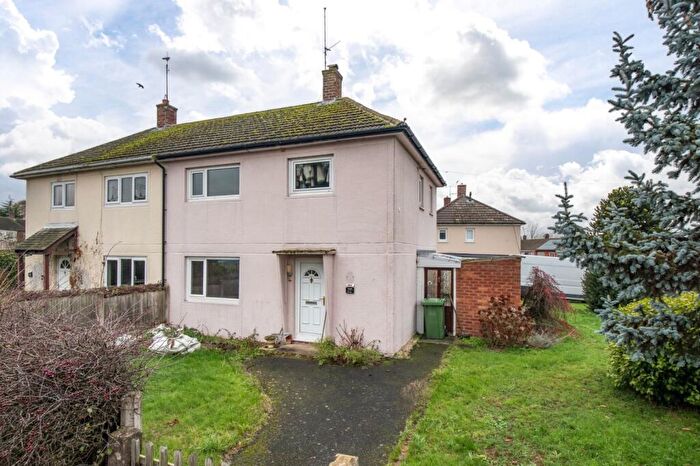
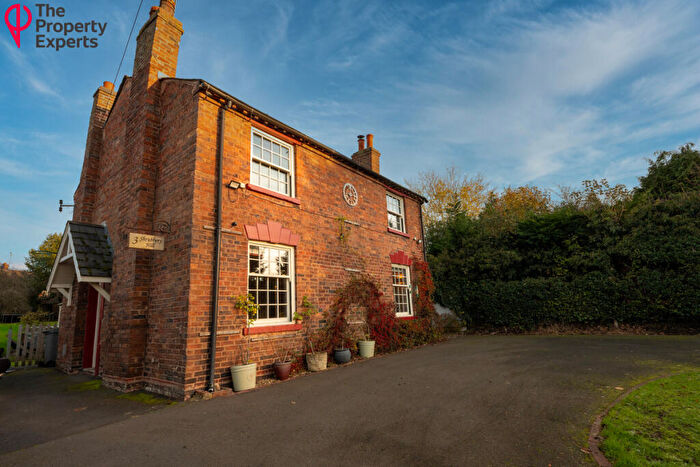
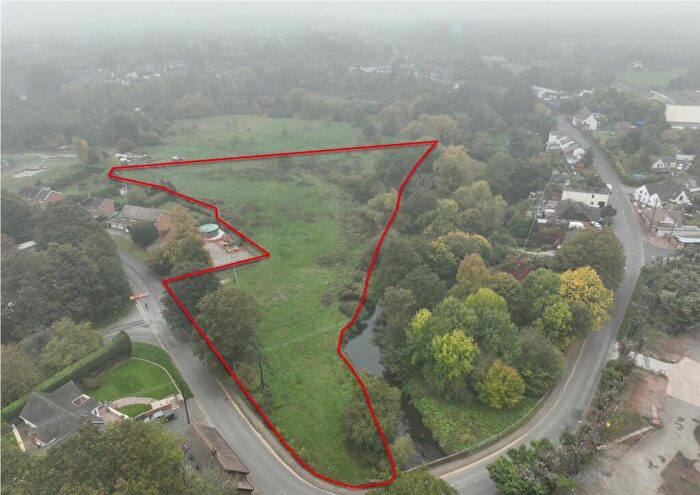
Houses for sale & to rent in Cookley, Kidderminster
House Prices in Cookley
Properties in Cookley have an average house price of £259,040.00 and had 95 Property Transactions within the last 3 years¹.
Cookley is an area in Kidderminster, Worcestershire with 1,095 households², where the most expensive property was sold for £600,000.00.
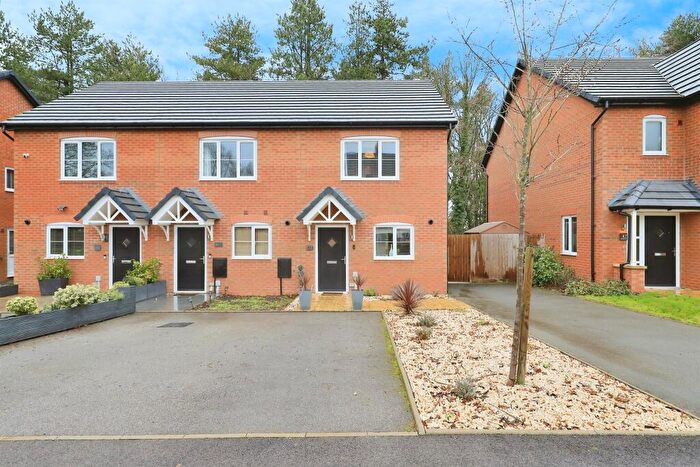
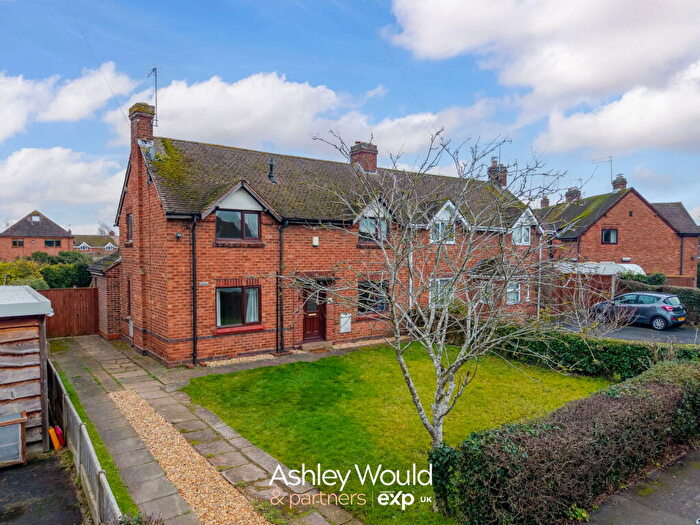
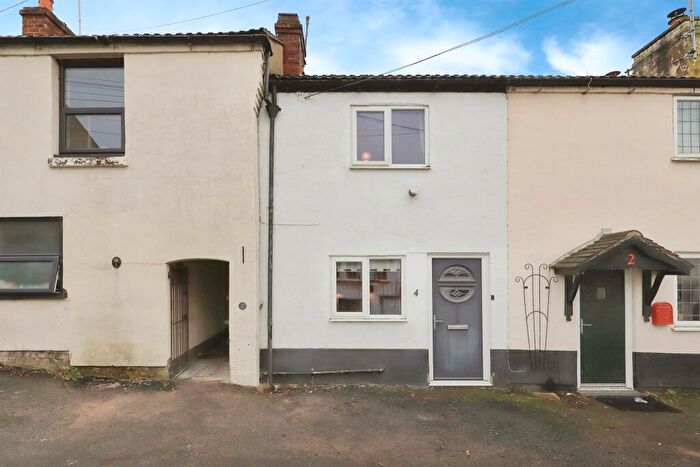
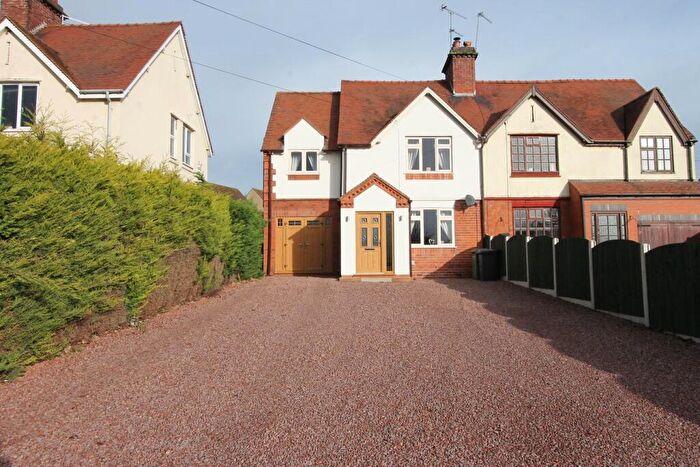
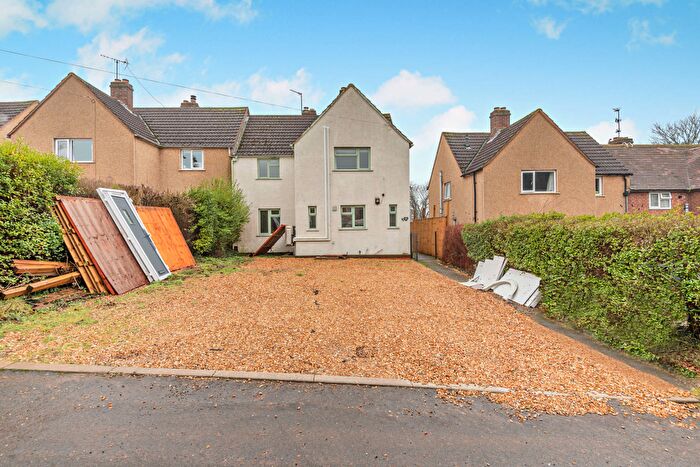
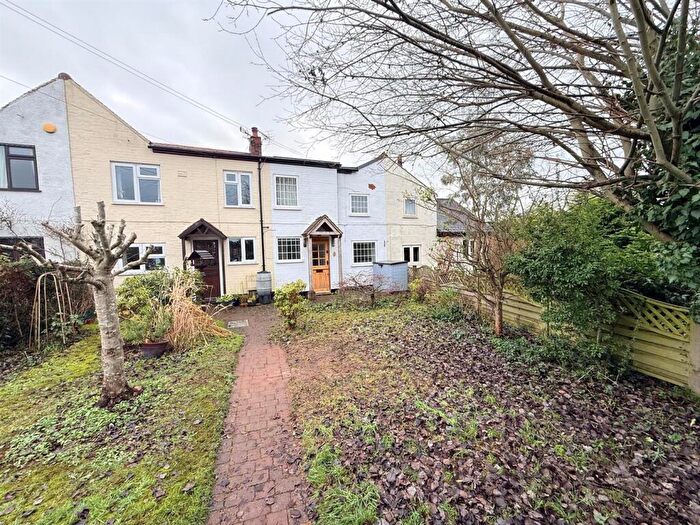
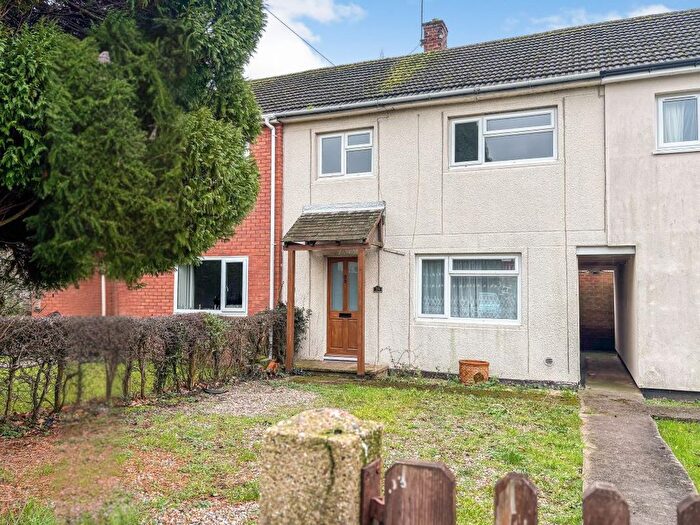
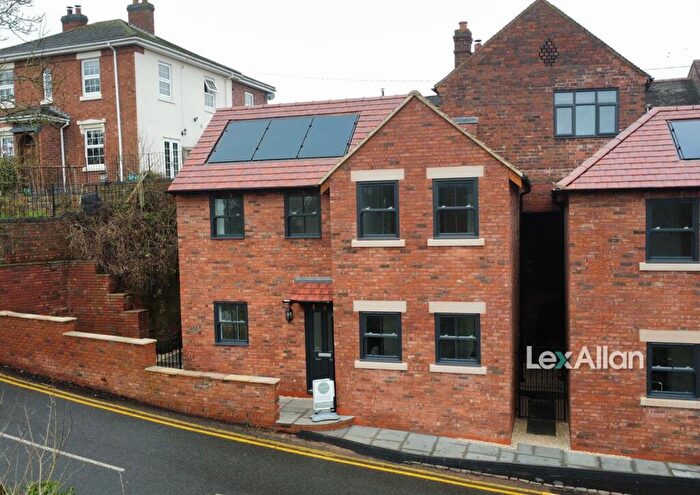
Properties for sale in Cookley
Roads and Postcodes in Cookley
Navigate through our locations to find the location of your next house in Cookley, Kidderminster for sale or to rent.
| Streets | Postcodes |
|---|---|
| Austcliffe Gardens | DY10 3US |
| Austcliffe Lane | DY10 3RT |
| Austcliffe Road | DY10 3UP DY10 3UR |
| Axborough Lane | DY10 3PL |
| Beeston Road | DY10 3UE DY10 3UF |
| Brampton Close | DY10 3TW |
| Bridge Road | DY10 3SA DY10 3SB DY11 5YA |
| Castle Road | DY10 3TB DY10 3TD DY10 3TE DY10 3TF DY10 3TH |
| Caunsall Road | DY11 5YB DY11 5YD DY11 5YH DY11 5YL DY11 5YW |
| Clee Road | DY10 3UD |
| Elan Close | DY10 3TP |
| Eleanor Harrison Drive | DY10 3TY |
| Elm Place | DY10 3TS |
| Gaymore Road | DY10 3TT DY10 3TU |
| Highfield Road | DY10 3UB |
| Holly Cottages | DY11 5YJ |
| Kimberlee Avenue | DY10 3TN |
| Lea Lane | DY10 3RH DY10 3TA |
| Lionfields Close | DY10 3UQ |
| Lionfields Road | DY10 3UG |
| New Road | DY11 5YN |
| Orchard Grove | DY11 5YE |
| Parkgate Road | DY10 3PU |
| Portway Place | DY10 3UJ |
| Shrubbery Close | DY10 3UH |
| Shrubbery Hill | DY10 3UN DY10 3UW |
| Staite Drive | DY10 3UA |
| The Crescent | DY10 3RY |
| West Head Road North | DY10 3TJ DY10 3TQ |
| Westhead Road | DY10 3TG |
| Winston Road | DY11 5YF |
| Wolverhampton Road | DY10 3RX DY10 3RZ |
| Woodlands Road | DY10 3TL |
| DY10 3SJ |
Transport near Cookley
-
Blakedown Station
-
Kidderminster Station
-
Hagley Station
-
Stourbridge Town Station
-
Stourbridge Junction Station
- FAQ
- Price Paid By Year
- Property Type Price
Frequently asked questions about Cookley
What is the average price for a property for sale in Cookley?
The average price for a property for sale in Cookley is £259,040. This amount is 0.24% lower than the average price in Kidderminster. There are 330 property listings for sale in Cookley.
What streets have the most expensive properties for sale in Cookley?
The streets with the most expensive properties for sale in Cookley are New Road at an average of £472,500, Caunsall Road at an average of £461,083 and Orchard Grove at an average of £381,000.
What streets have the most affordable properties for sale in Cookley?
The streets with the most affordable properties for sale in Cookley are Austcliffe Lane at an average of £110,800, Beeston Road at an average of £158,000 and Staite Drive at an average of £164,930.
Which train stations are available in or near Cookley?
Some of the train stations available in or near Cookley are Blakedown, Kidderminster and Hagley.
Property Price Paid in Cookley by Year
The average sold property price by year was:
| Year | Average Sold Price | Price Change |
Sold Properties
|
|---|---|---|---|
| 2025 | £249,389 | -8% |
24 Properties |
| 2024 | £270,065 | 6% |
38 Properties |
| 2023 | £253,362 | 0,4% |
33 Properties |
| 2022 | £252,240 | 7% |
33 Properties |
| 2021 | £235,611 | 1% |
39 Properties |
| 2020 | £233,258 | 5% |
31 Properties |
| 2019 | £222,649 | 4% |
41 Properties |
| 2018 | £214,254 | 23% |
37 Properties |
| 2017 | £165,543 | -24% |
44 Properties |
| 2016 | £205,311 | 33% |
35 Properties |
| 2015 | £138,072 | -21% |
36 Properties |
| 2014 | £166,581 | 1% |
30 Properties |
| 2013 | £165,209 | 9% |
26 Properties |
| 2012 | £150,357 | -38% |
34 Properties |
| 2011 | £207,954 | 27% |
25 Properties |
| 2010 | £152,164 | -8% |
27 Properties |
| 2009 | £164,482 | -30% |
22 Properties |
| 2008 | £214,500 | 6% |
19 Properties |
| 2007 | £201,527 | 3% |
56 Properties |
| 2006 | £195,899 | 21% |
49 Properties |
| 2005 | £154,659 | -4% |
46 Properties |
| 2004 | £160,092 | 6% |
51 Properties |
| 2003 | £149,687 | 29% |
37 Properties |
| 2002 | £105,817 | 10% |
64 Properties |
| 2001 | £95,182 | 15% |
39 Properties |
| 2000 | £80,624 | 14% |
40 Properties |
| 1999 | £69,466 | 5% |
50 Properties |
| 1998 | £66,056 | 6% |
41 Properties |
| 1997 | £61,788 | -4% |
52 Properties |
| 1996 | £64,049 | 14% |
34 Properties |
| 1995 | £55,310 | - |
37 Properties |
Property Price per Property Type in Cookley
Here you can find historic sold price data in order to help with your property search.
The average Property Paid Price for specific property types in the last three years are:
| Property Type | Average Sold Price | Sold Properties |
|---|---|---|
| Semi Detached House | £279,779.00 | 43 Semi Detached Houses |
| Detached House | £428,966.00 | 15 Detached Houses |
| Terraced House | £206,804.00 | 21 Terraced Houses |
| Flat | £112,556.00 | 16 Flats |

