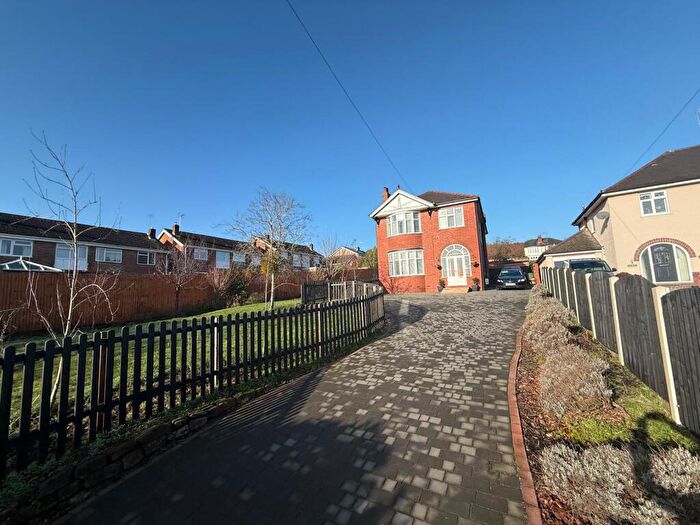
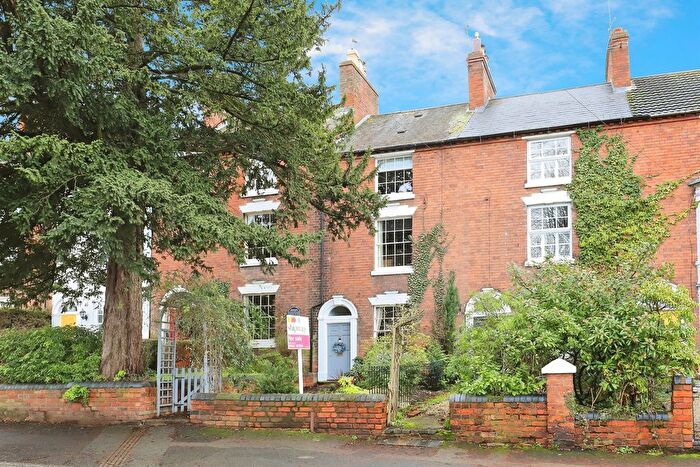
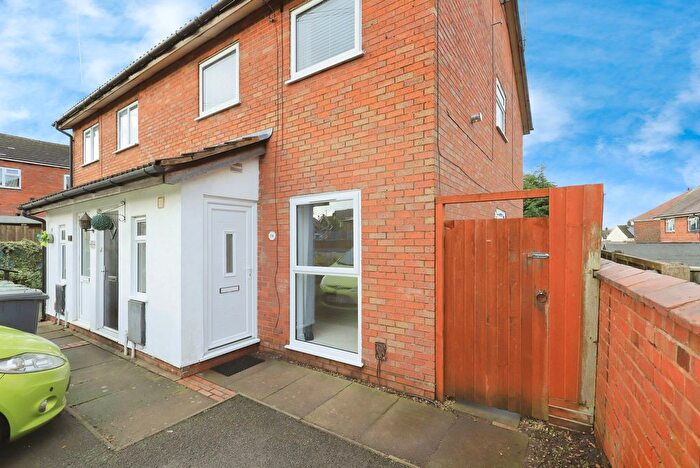
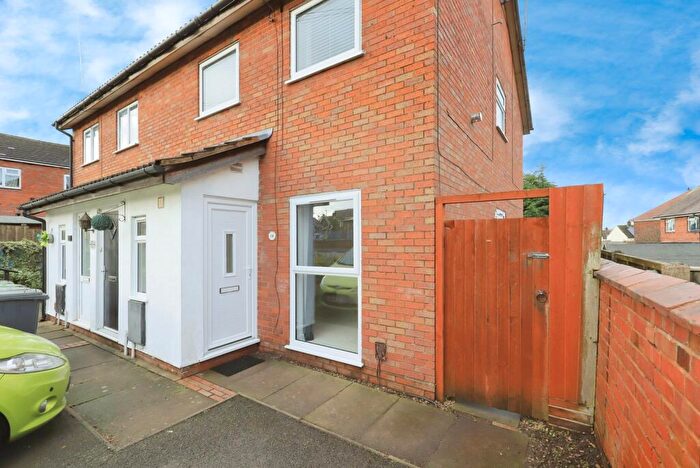
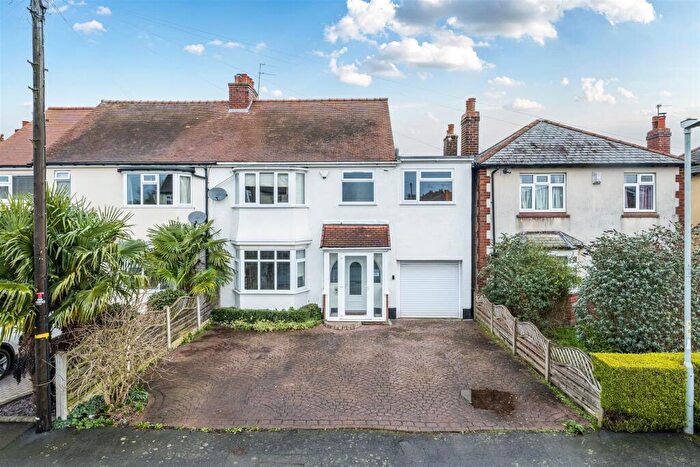
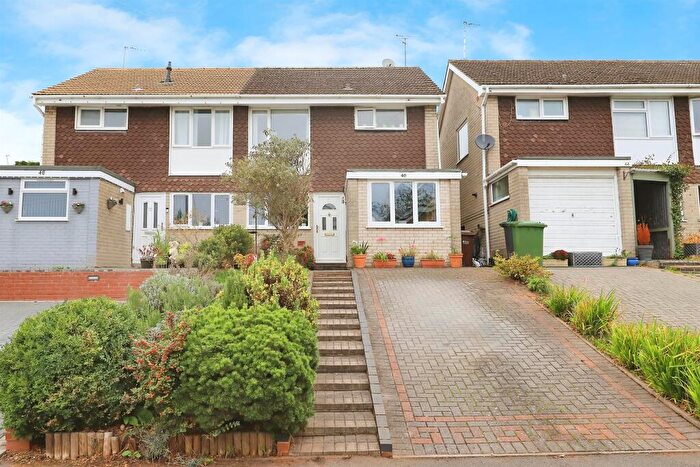
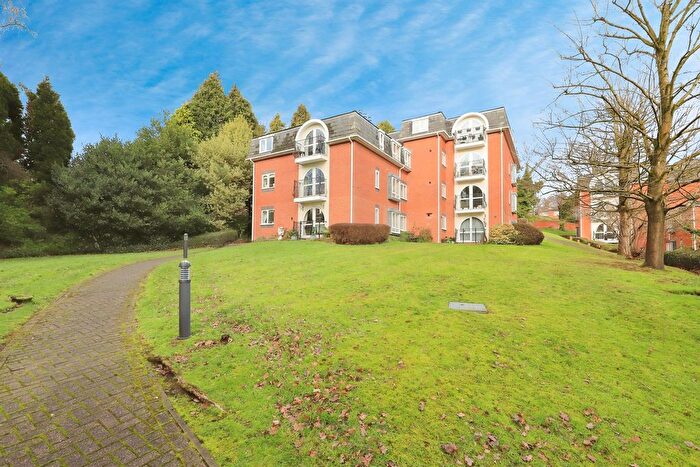
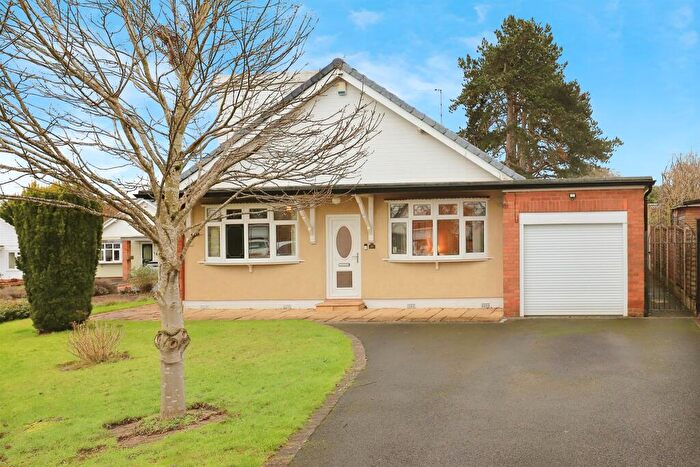
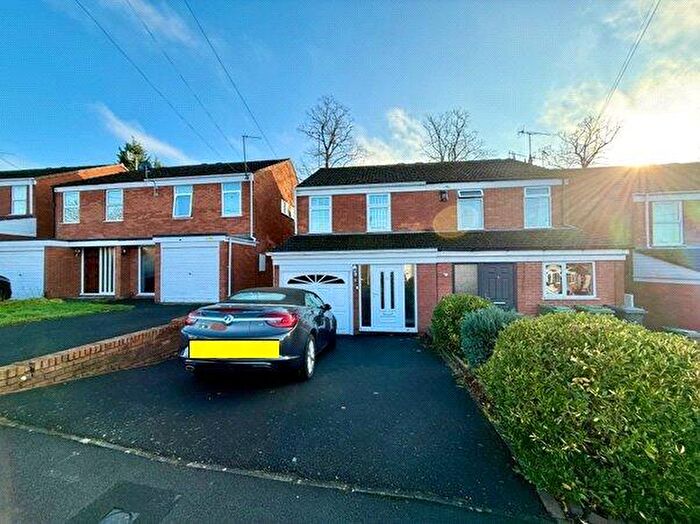
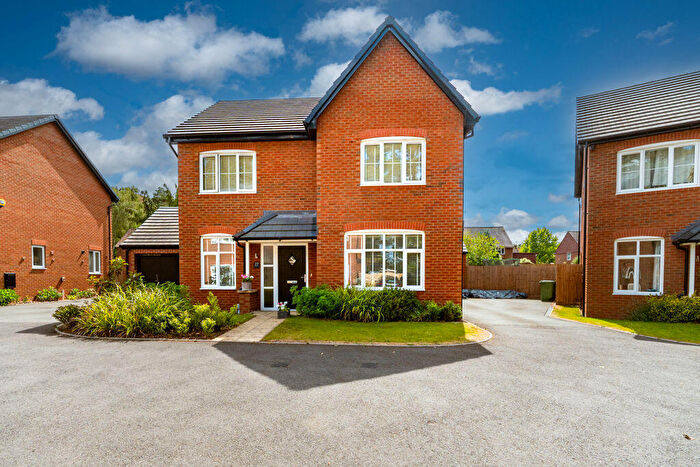
Houses for sale & to rent in Wolverley, Kidderminster
House Prices in Wolverley
Properties in Wolverley have an average house price of £419,546.00 and had 38 Property Transactions within the last 3 years¹.
Wolverley is an area in Kidderminster, Worcestershire with 773 households², where the most expensive property was sold for £975,000.00.
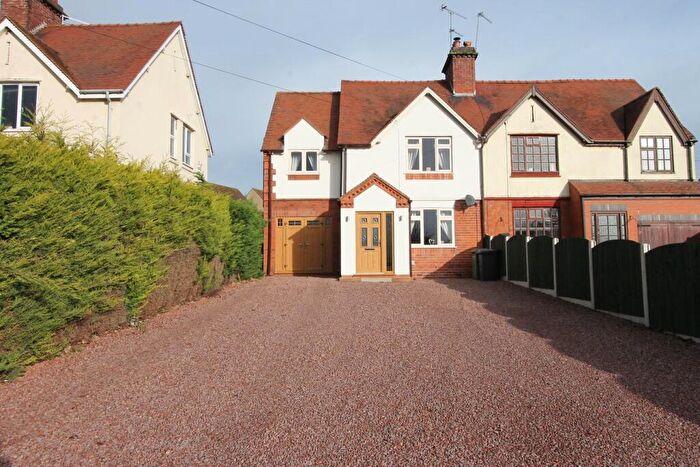
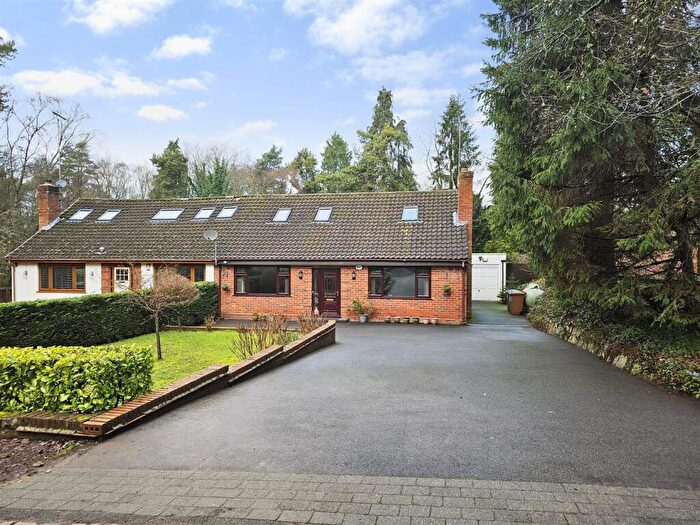
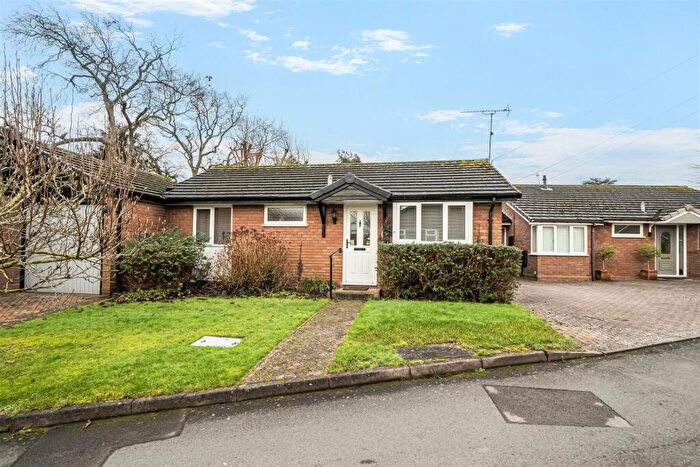
Properties for sale in Wolverley
Roads and Postcodes in Wolverley
Navigate through our locations to find the location of your next house in Wolverley, Kidderminster for sale or to rent.
| Streets | Postcodes |
|---|---|
| Beechcote Avenue | DY11 5TS |
| Birds Barn Lane | DY11 5SG |
| Blakeshall | DY11 5XP DY11 5XR DY11 5XW |
| Blakeshall Lane | DY11 5XJ |
| Bridgnorth Road | DY11 5RT |
| Brown Westhead Park | DY10 3PX |
| Castle Barns | DY10 3RE |
| Castle Hill | DY11 5SH |
| Court Cottages | DY10 3RP |
| Drakelow Lane | DY11 5RU DY11 5RY |
| Evans Close | DY11 5UH |
| Fairfield Lane | DY11 5QH DY11 5QJ |
| Franche Road | DY11 5TP DY11 5TU |
| Hayes Road | DY11 5TY DY11 5UF DY11 5UL |
| Hobro | DY11 5SU DY11 5SZ DY11 5TB |
| Honeybrook Close | DY11 5TT |
| Horseley Hill | DY11 5TD |
| Kingsford Lane | DY11 5SL DY11 5SN DY11 5SW |
| Knight Road | DY11 5UD |
| Lea Lane | DY10 3RL |
| Lowe Lane | DY11 5QP DY11 5QR |
| Mill Lane | DY11 5TR |
| Sebright Green | DY11 5UB |
| Sebright Road | DY11 5TZ DY11 5UA DY11 5UE |
| Shatterford Lane | DY11 5TG |
| Sheepwash Lane | DY11 5SE DY11 5SF |
| Sion Hill | DY10 2YX DY10 2YY |
| Sladd Lane | DY11 5SP DY11 5TE DY11 5TF |
| Stourbridge Road | DY10 3PT |
| The Shortyard | DY11 5XF |
| Wardle Way | DY11 5UJ |
| Wolverley Road | DY10 3QA DY10 3QD DY10 3QE DY10 3RN |
| Wolverley Village | DY11 5XA DY11 5XD DY11 5XE DY11 5XZ |
| DY11 5TH DY11 5TQ |
Transport near Wolverley
- FAQ
- Price Paid By Year
- Property Type Price
Frequently asked questions about Wolverley
What is the average price for a property for sale in Wolverley?
The average price for a property for sale in Wolverley is £419,546. This amount is 62% higher than the average price in Kidderminster. There are 3,694 property listings for sale in Wolverley.
What streets have the most expensive properties for sale in Wolverley?
The streets with the most expensive properties for sale in Wolverley are Sheepwash Lane at an average of £864,000, Kingsford Lane at an average of £663,500 and Drakelow Lane at an average of £625,000.
What streets have the most affordable properties for sale in Wolverley?
The streets with the most affordable properties for sale in Wolverley are Beechcote Avenue at an average of £242,800, Wardle Way at an average of £250,000 and Honeybrook Close at an average of £270,000.
Which train stations are available in or near Wolverley?
Some of the train stations available in or near Wolverley are Kidderminster, Blakedown and Hagley.
Property Price Paid in Wolverley by Year
The average sold property price by year was:
| Year | Average Sold Price | Price Change |
Sold Properties
|
|---|---|---|---|
| 2025 | £488,545 | 19% |
11 Properties |
| 2024 | £395,236 | 3% |
18 Properties |
| 2023 | £383,833 | -4% |
9 Properties |
| 2022 | £398,358 | 3% |
18 Properties |
| 2021 | £385,595 | 15% |
32 Properties |
| 2020 | £328,552 | 6% |
19 Properties |
| 2019 | £308,631 | -5% |
24 Properties |
| 2018 | £323,171 | 7% |
26 Properties |
| 2017 | £299,289 | -1% |
24 Properties |
| 2016 | £303,018 | 20% |
33 Properties |
| 2015 | £241,086 | -12% |
29 Properties |
| 2014 | £270,566 | 1% |
30 Properties |
| 2013 | £267,643 | 19% |
22 Properties |
| 2012 | £217,018 | -9% |
24 Properties |
| 2011 | £236,868 | -92% |
19 Properties |
| 2010 | £453,618 | 38% |
15 Properties |
| 2009 | £280,676 | 18% |
13 Properties |
| 2008 | £229,409 | -14% |
11 Properties |
| 2007 | £262,296 | -15% |
18 Properties |
| 2006 | £302,196 | 21% |
29 Properties |
| 2005 | £237,402 | 2% |
21 Properties |
| 2004 | £232,974 | -8% |
24 Properties |
| 2003 | £252,031 | 15% |
30 Properties |
| 2002 | £214,104 | -4% |
24 Properties |
| 2001 | £222,785 | 46% |
21 Properties |
| 2000 | £120,019 | -18% |
26 Properties |
| 1999 | £142,210 | 37% |
23 Properties |
| 1998 | £89,310 | -7% |
24 Properties |
| 1997 | £95,209 | 18% |
16 Properties |
| 1996 | £78,188 | -33% |
17 Properties |
| 1995 | £103,836 | - |
22 Properties |
Property Price per Property Type in Wolverley
Here you can find historic sold price data in order to help with your property search.
The average Property Paid Price for specific property types in the last three years are:
| Property Type | Average Sold Price | Sold Properties |
|---|---|---|
| Semi Detached House | £300,203.00 | 16 Semi Detached Houses |
| Detached House | £572,500.00 | 15 Detached Houses |
| Terraced House | £404,000.00 | 4 Terraced Houses |
| Flat | £312,000.00 | 3 Flats |

