Houses for sale & to rent in Hartlebury, Kidderminster
House Prices in Hartlebury
Properties in Hartlebury have an average house price of £380,418.00 and had 72 Property Transactions within the last 3 years¹.
Hartlebury is an area in Kidderminster, Worcestershire with 905 households², where the most expensive property was sold for £745,000.00.
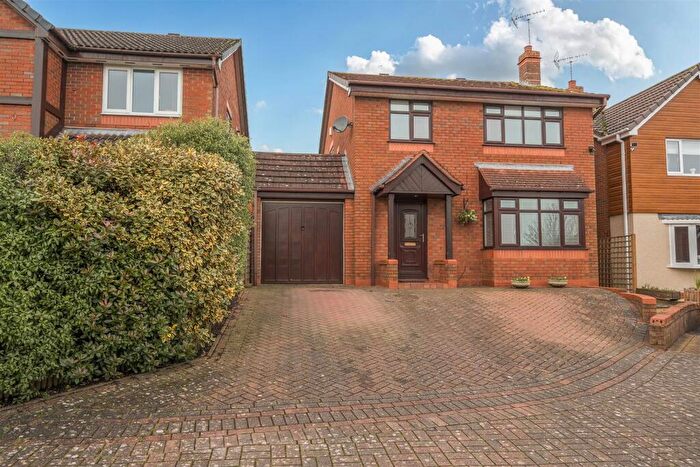
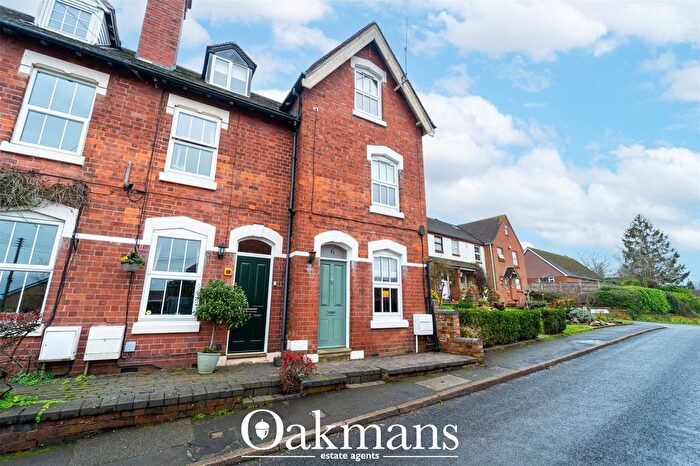
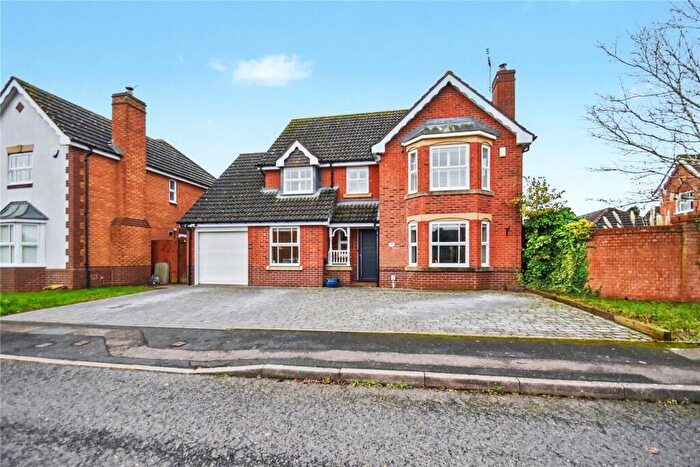
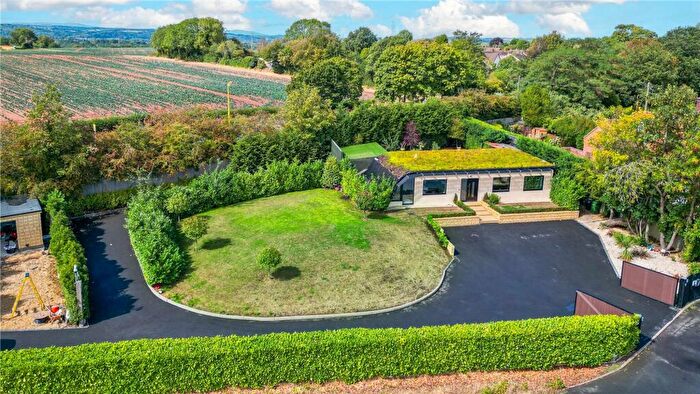
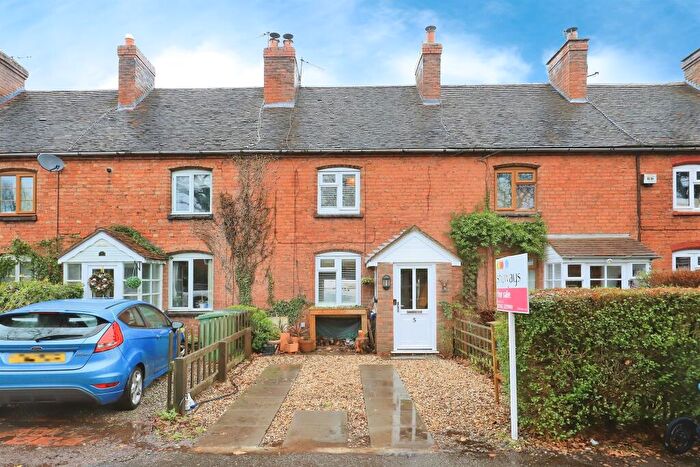
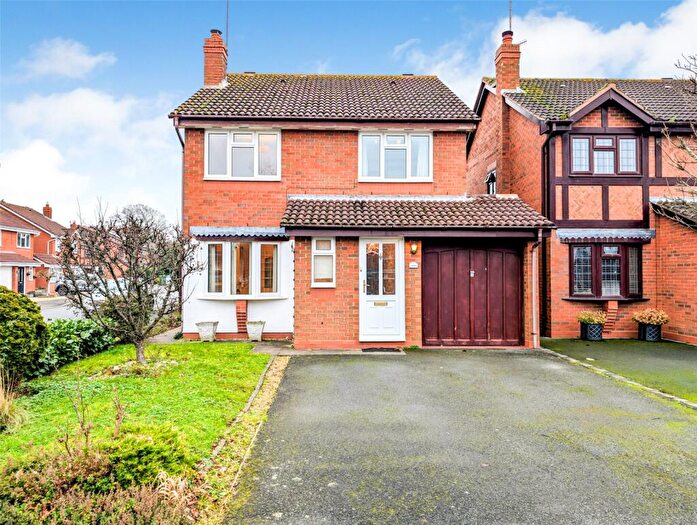
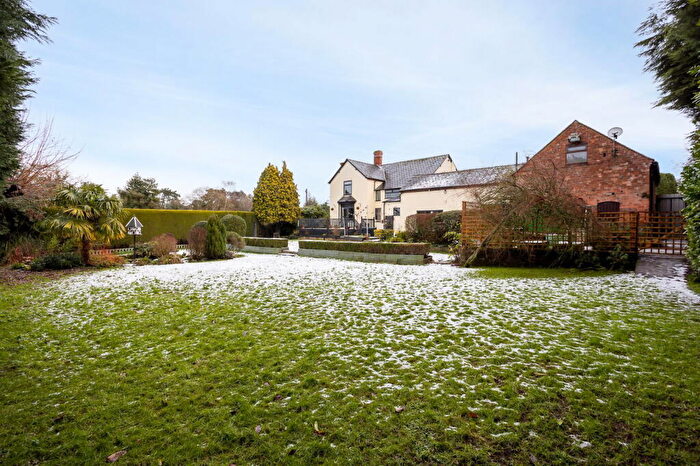
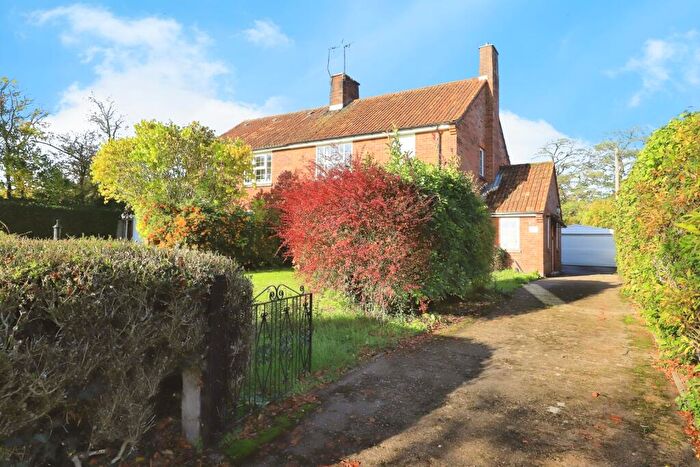
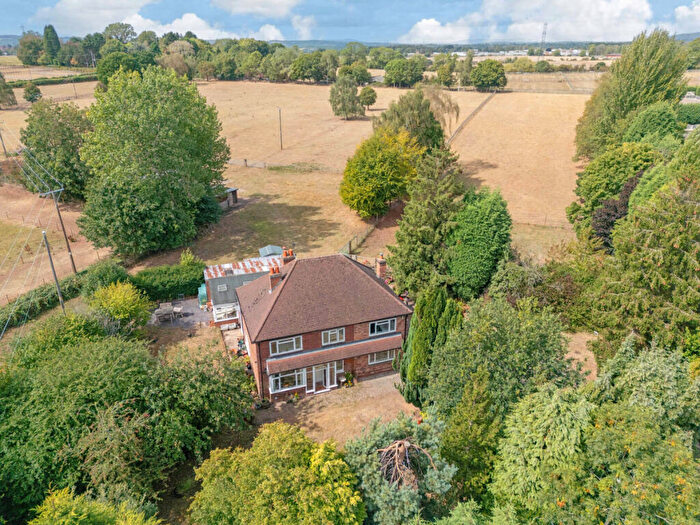
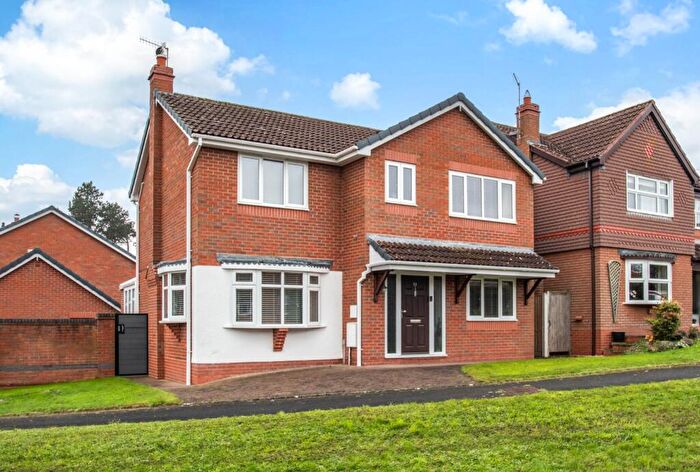
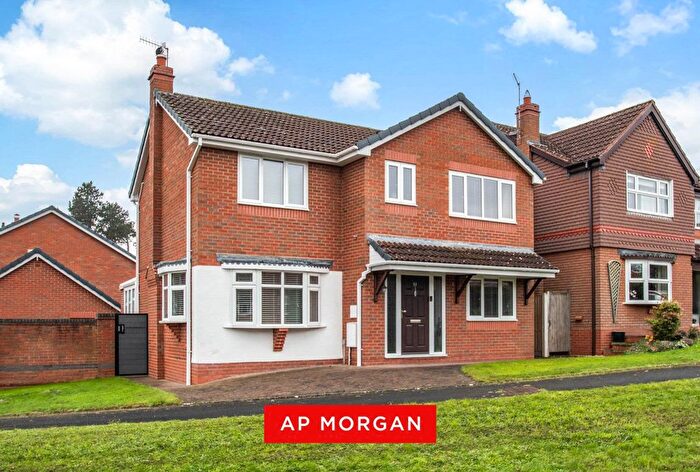
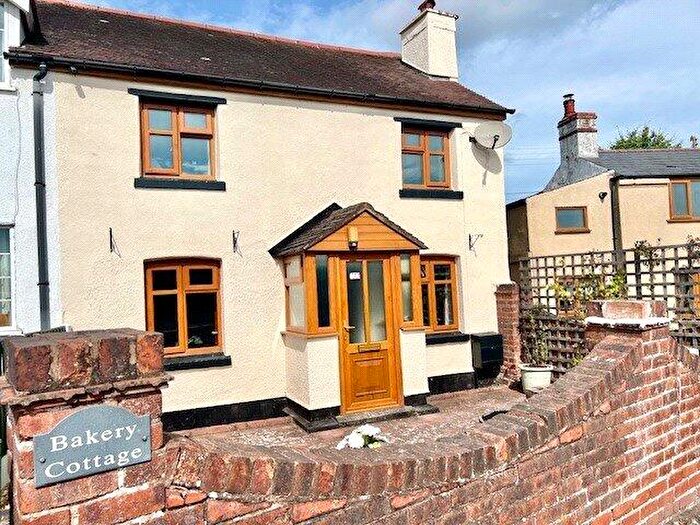
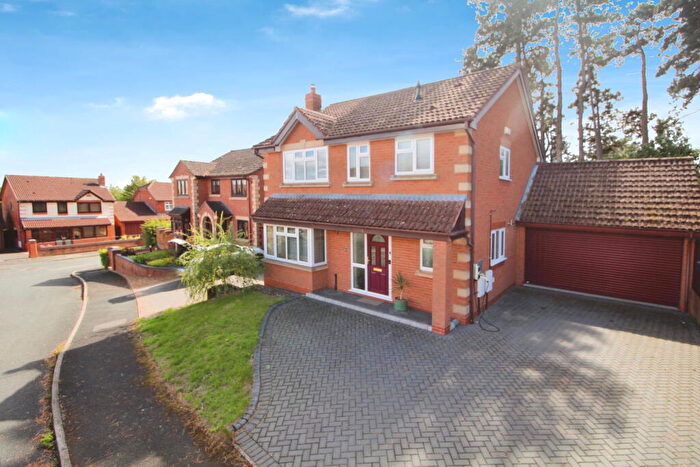
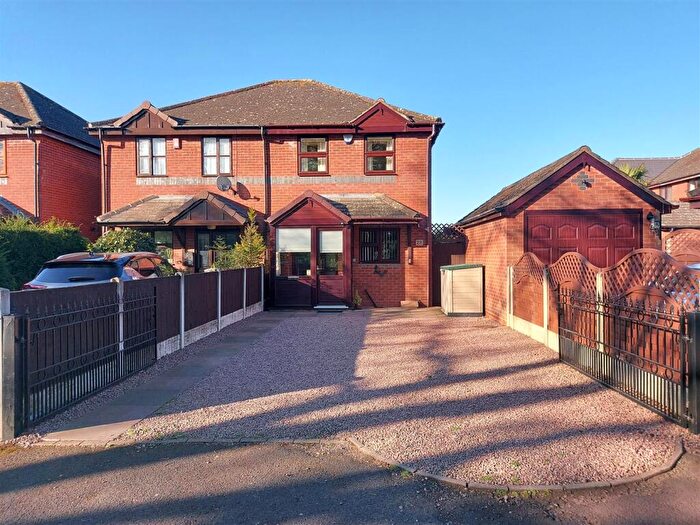
Properties for sale in Hartlebury
Previously listed properties in Hartlebury
Roads and Postcodes in Hartlebury
Navigate through our locations to find the location of your next house in Hartlebury, Kidderminster for sale or to rent.
| Streets | Postcodes |
|---|---|
| Ashdene Close | DY11 7TN |
| Bolas Avenue | DY11 7TX |
| Chadwick Lane | DY11 7YH |
| Charlton | DY11 7YE |
| Crown Lane | DY11 7FP DY11 7XP |
| Droitwich Road | DY10 4EH DY10 4EL DY10 4EW DY10 4HU DY11 7RW DY10 4EJ |
| Elmfield Road | DY11 7LA |
| Fordbrook | DY11 7SD |
| Groves Way | DY11 7TU |
| Hillditch Lane | DY11 7YD |
| Ikon Industrial Estate | DY10 4EU |
| Inn Lane | DY11 7TA DY11 7TB |
| Low Hill | DY10 4HT |
| Manor Lane | DY11 7XN |
| Millridge Way | DY11 7TJ |
| Moors Avenue | DY11 7YL |
| Old Worcester Road | DY11 7XB DY11 7XG DY11 7XL DY11 7XQ DY11 7XS DY11 7XH |
| Parkfield Close | DY11 7TW |
| Parsons Lane | DY11 7YG DY11 7YQ |
| Pleck Gardens | DY11 7FS |
| Rectory Gardens | DY11 7TF |
| Southall Drive | DY11 7LD |
| Stanklyn Lane | DY10 4HP DY11 7RY |
| Station Road | DY11 7YJ DY10 4HA |
| Stourport Road | DY11 7YA DY11 7XX |
| Summerfield Lane | DY11 7SA DY11 7RZ |
| Summerway Lane | DY11 7SE |
| Talbot Close | DY11 7LB |
| The Avenue | DY11 7RH DY11 7XR DY11 7XW |
| The Village | DY11 7TD DY11 7TE |
| Torton Lane | DY10 4HX DY11 7SG |
| Torton Villas | DY11 7RT |
| Walton Lane | DY10 4JE |
| Walton Road | DY10 4JA |
| Waresley Court Road | DY11 7TG DY11 7TH DY11 7TQ |
| Waresley Park | DY11 7XE DY11 7XF |
| Waresley Road | DY11 7XT |
| Waterlaide Close | DY11 7TS |
| Waterlaide Road | DY11 7TP |
| Whitlenge Lane | DY10 4HD DY10 4HB |
| Whitley Close | DY11 7TY |
| Wilson Road | DY11 7XU |
| Woodbury Close | DY11 7TL |
| Woodlands Close | DY11 7TR |
| Worcester Road | DY11 7RF DY11 7RG DY11 7RL DY11 7RR DY11 7XD DY10 4EP DY10 4ER DY11 7RS DY11 7RU DY11 7SB DY11 7XA |
| DY10 4HY DY11 7TT DY11 7XZ |
Transport near Hartlebury
-
Hartlebury Station
-
Kidderminster Station
-
Blakedown Station
-
Droitwich Spa Station
-
Hagley Station
-
Bromsgrove Station
-
Stourbridge Junction Station
-
Stourbridge Town Station
-
Lye Station
-
Worcester Foregate Street Station
- FAQ
- Price Paid By Year
- Property Type Price
Frequently asked questions about Hartlebury
What is the average price for a property for sale in Hartlebury?
The average price for a property for sale in Hartlebury is £380,418. This amount is 47% higher than the average price in Kidderminster. There are 248 property listings for sale in Hartlebury.
What streets have the most expensive properties for sale in Hartlebury?
The streets with the most expensive properties for sale in Hartlebury are Elmfield Road at an average of £530,000, Whitley Close at an average of £524,000 and Bolas Avenue at an average of £490,833.
What streets have the most affordable properties for sale in Hartlebury?
The streets with the most affordable properties for sale in Hartlebury are Moors Avenue at an average of £229,000, Walton Road at an average of £246,250 and Stanklyn Lane at an average of £280,886.
Which train stations are available in or near Hartlebury?
Some of the train stations available in or near Hartlebury are Hartlebury, Kidderminster and Blakedown.
Property Price Paid in Hartlebury by Year
The average sold property price by year was:
| Year | Average Sold Price | Price Change |
Sold Properties
|
|---|---|---|---|
| 2025 | £371,632 | 5% |
29 Properties |
| 2024 | £353,677 | -17% |
20 Properties |
| 2023 | £414,749 | -19% |
23 Properties |
| 2022 | £493,237 | 13% |
34 Properties |
| 2021 | £428,302 | 6% |
36 Properties |
| 2020 | £402,685 | 18% |
32 Properties |
| 2019 | £331,457 | -11% |
34 Properties |
| 2018 | £368,436 | 17% |
45 Properties |
| 2017 | £307,573 | -7% |
64 Properties |
| 2016 | £329,155 | 18% |
48 Properties |
| 2015 | £269,543 | -12% |
33 Properties |
| 2014 | £301,840 | 15% |
38 Properties |
| 2013 | £255,954 | -7% |
23 Properties |
| 2012 | £273,513 | 1% |
19 Properties |
| 2011 | £271,994 | -11% |
28 Properties |
| 2010 | £302,067 | 16% |
25 Properties |
| 2009 | £252,228 | -28% |
24 Properties |
| 2008 | £322,505 | 16% |
29 Properties |
| 2007 | £272,156 | 8% |
39 Properties |
| 2006 | £250,247 | 7% |
36 Properties |
| 2005 | £231,636 | -13% |
29 Properties |
| 2004 | £260,969 | 17% |
39 Properties |
| 2003 | £217,267 | 25% |
32 Properties |
| 2002 | £163,389 | 1% |
51 Properties |
| 2001 | £161,662 | 15% |
50 Properties |
| 2000 | £137,398 | 18% |
42 Properties |
| 1999 | £112,368 | -19% |
44 Properties |
| 1998 | £133,880 | 6% |
60 Properties |
| 1997 | £125,857 | 20% |
79 Properties |
| 1996 | £100,628 | 14% |
49 Properties |
| 1995 | £86,331 | - |
32 Properties |
Property Price per Property Type in Hartlebury
Here you can find historic sold price data in order to help with your property search.
The average Property Paid Price for specific property types in the last three years are:
| Property Type | Average Sold Price | Sold Properties |
|---|---|---|
| Semi Detached House | £327,711.00 | 19 Semi Detached Houses |
| Detached House | £461,897.00 | 38 Detached Houses |
| Terraced House | £279,136.00 | 11 Terraced Houses |
| Flat | £135,261.00 | 4 Flats |

