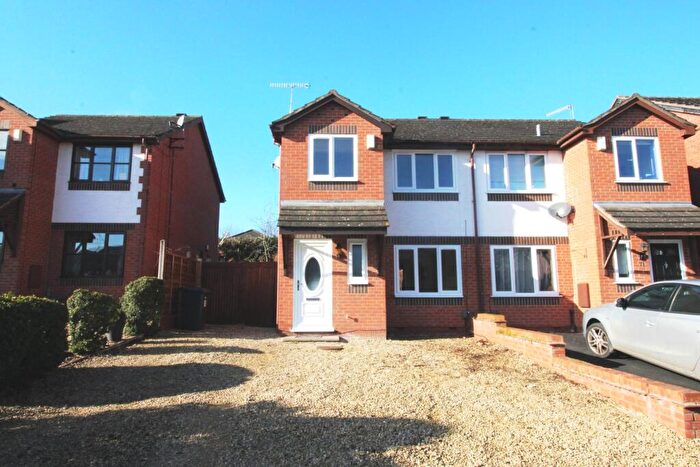
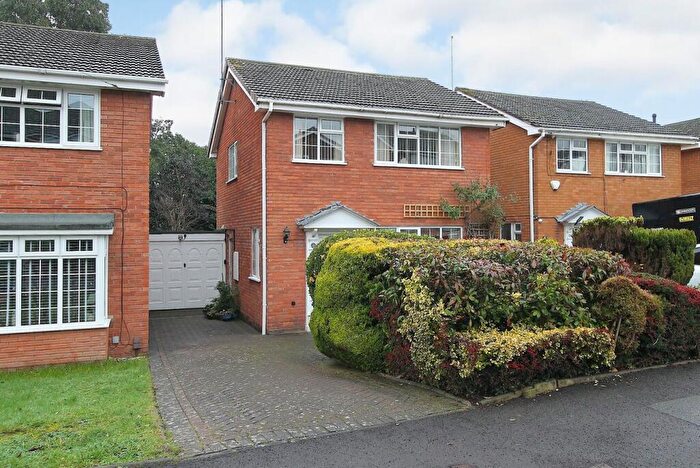
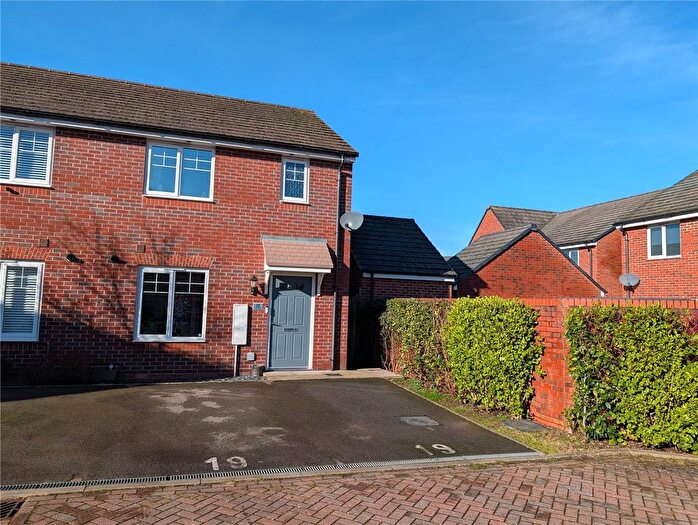
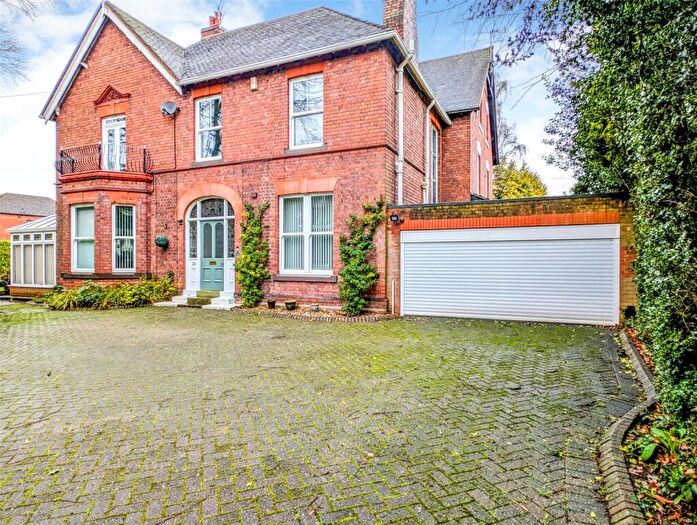
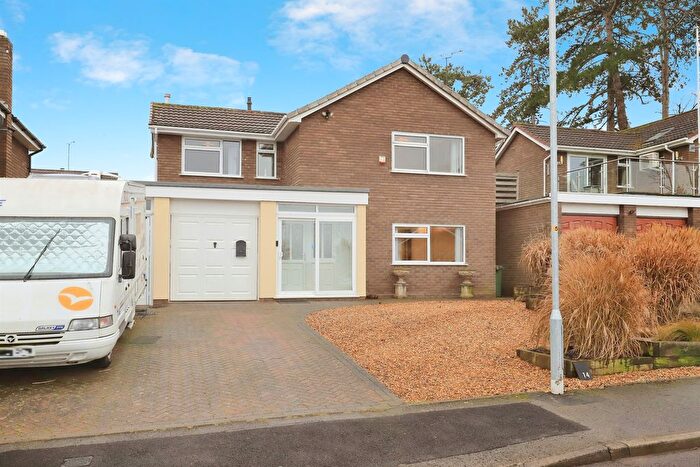
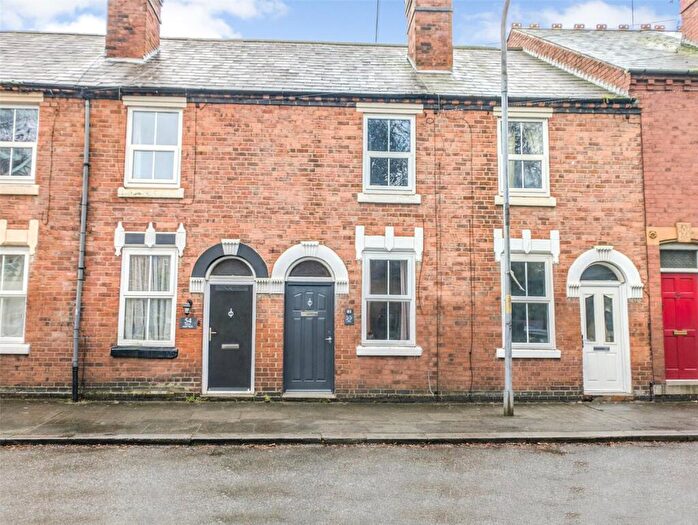
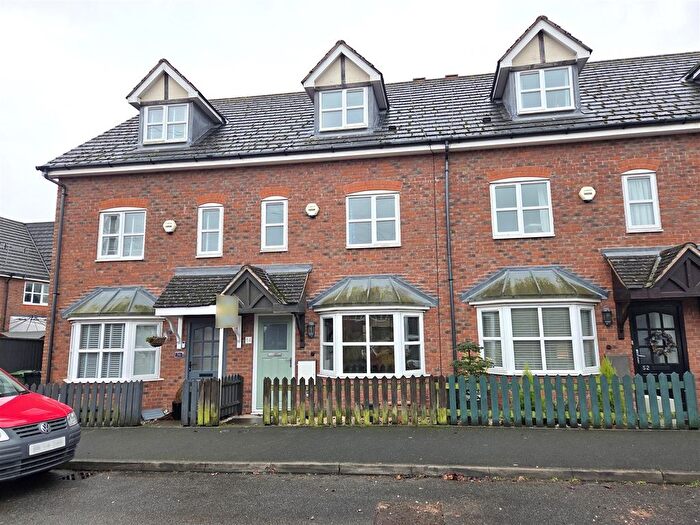
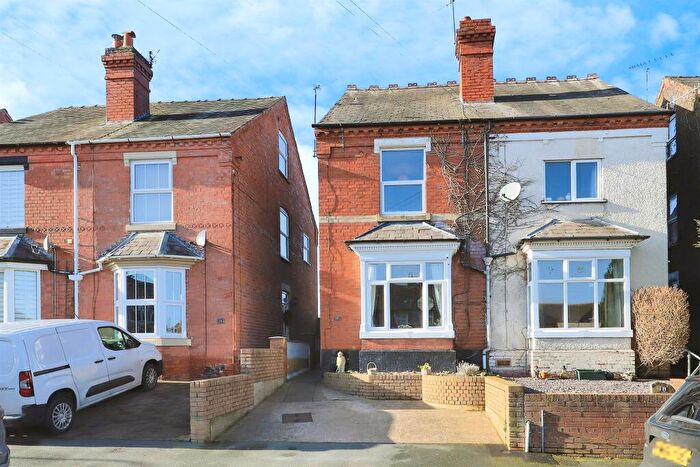
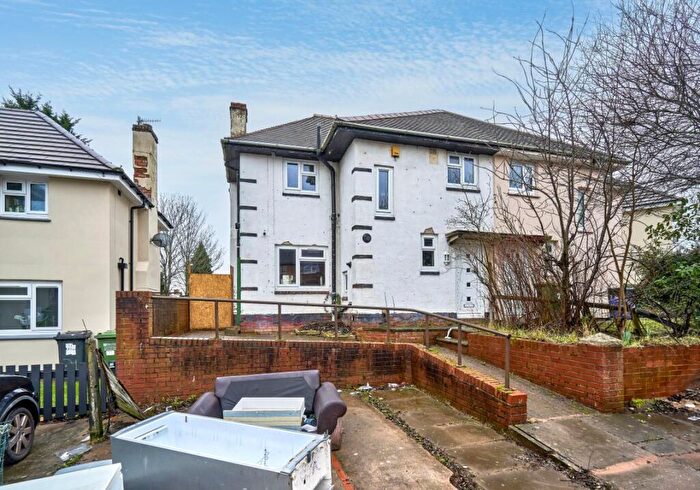
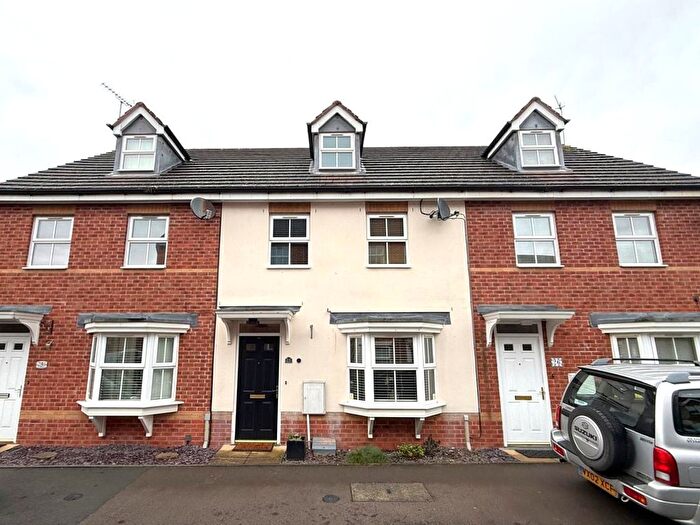
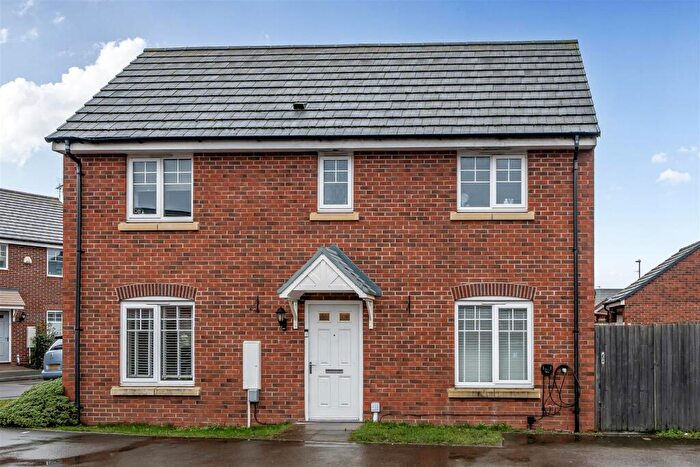
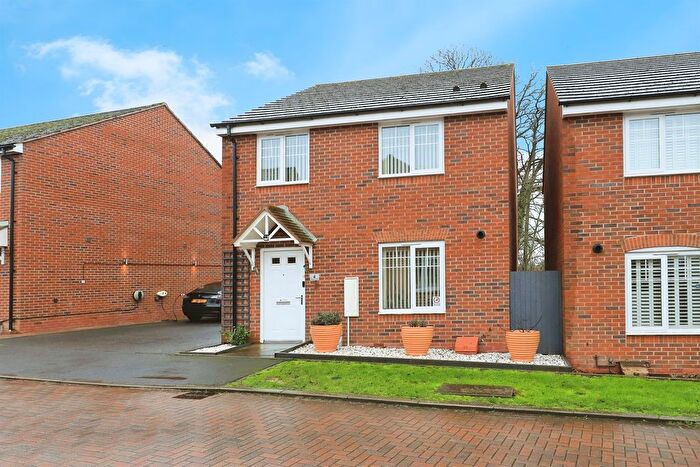
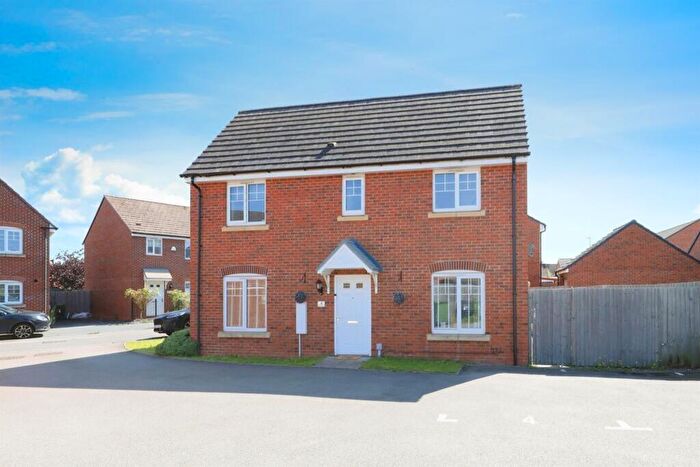
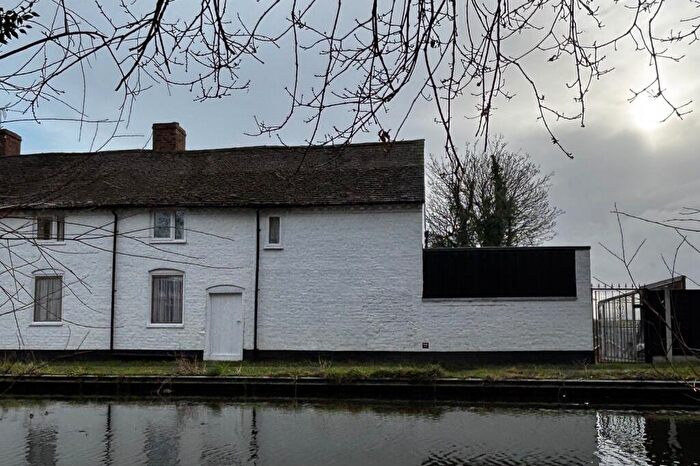
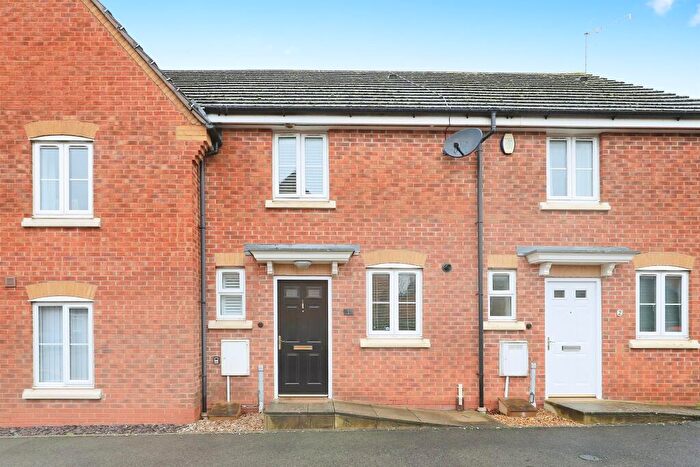
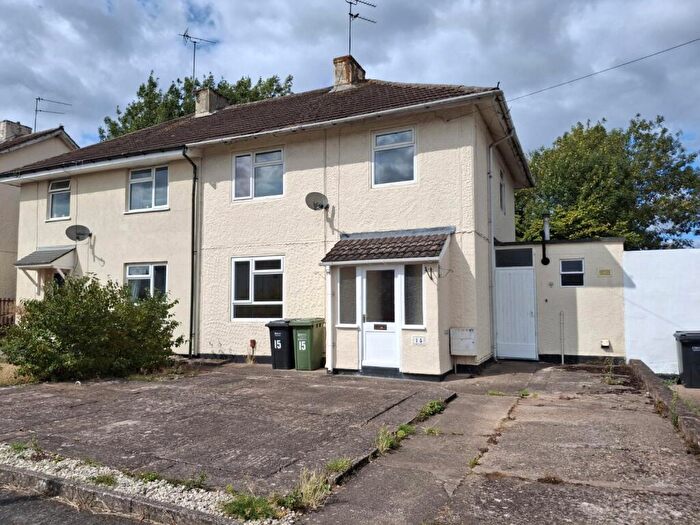
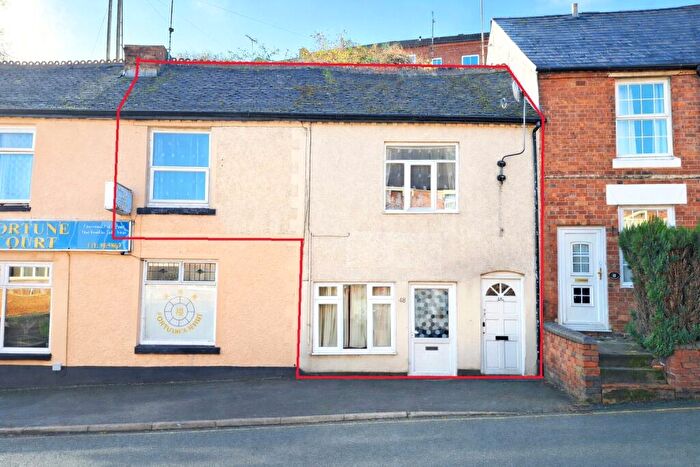
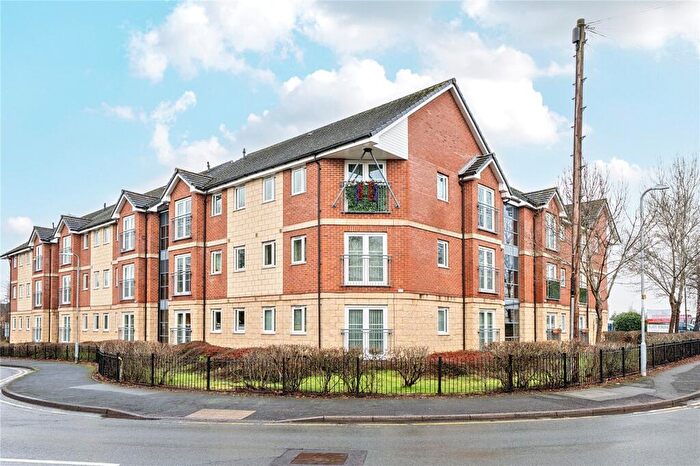
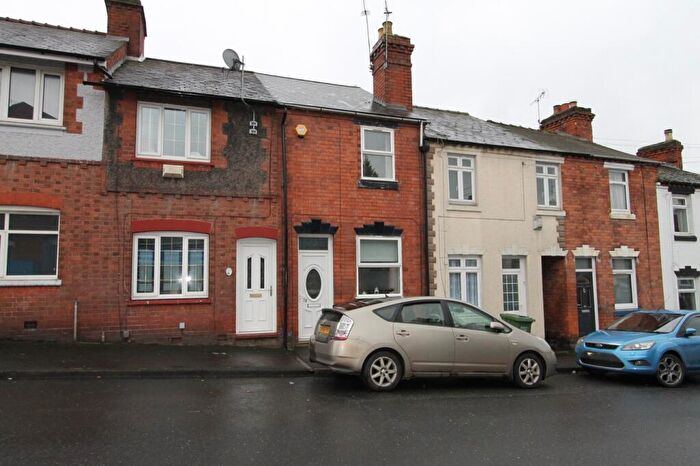
Houses for sale & to rent in Foley Park & Hoobrook, Kidderminster
House Prices in Foley Park & Hoobrook
Properties in Foley Park & Hoobrook have an average house price of £292,948.00 and had 49 Property Transactions within the last 3 years¹.
Foley Park & Hoobrook is an area in Kidderminster, Worcestershire with 341 households², where the most expensive property was sold for £505,000.00.
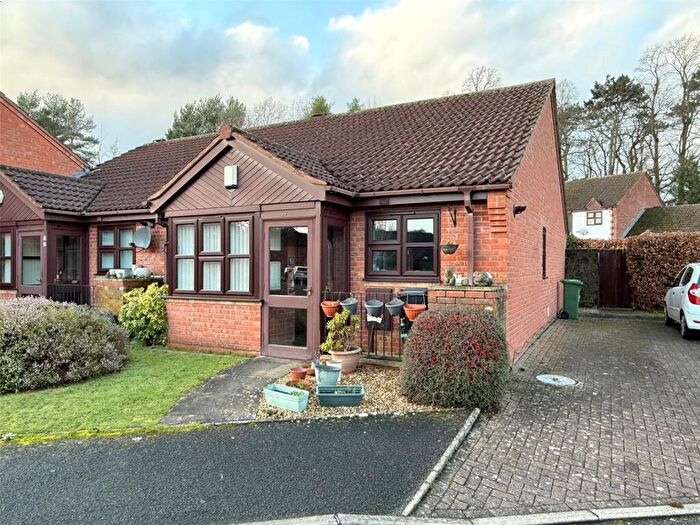
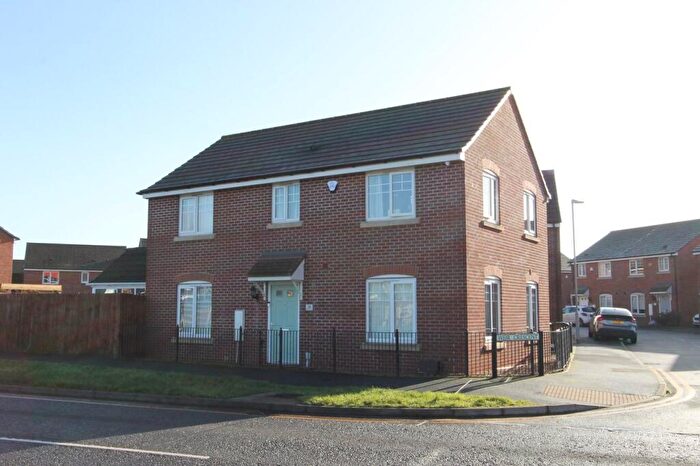
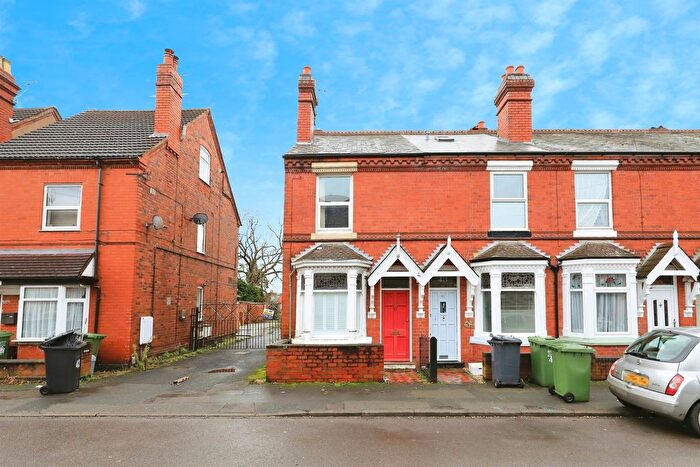
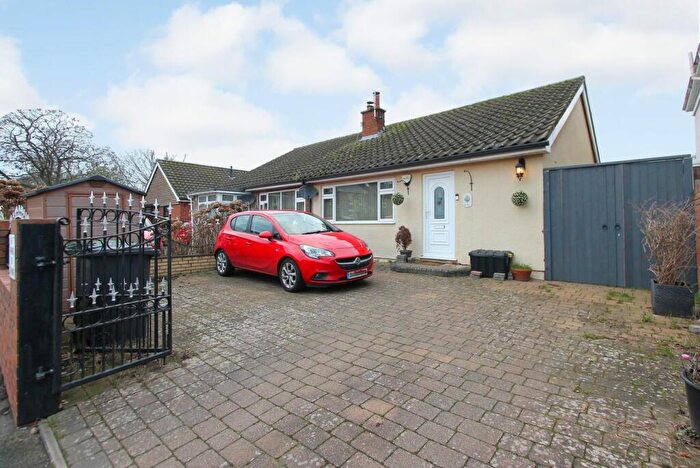
Properties for sale in Foley Park & Hoobrook
Roads and Postcodes in Foley Park & Hoobrook
Navigate through our locations to find the location of your next house in Foley Park & Hoobrook, Kidderminster for sale or to rent.
| Streets | Postcodes |
|---|---|
| Arthur Drive | DY11 7SL |
| Avon Road | DY11 7PB DY11 7PD |
| Blackford Close | DY11 7EZ |
| Bredon Close | DY11 7EX |
| Brinton Close | DY11 6NZ |
| Chester Road South | DY10 1XW |
| Clement Dalley Drive | DY11 7DU |
| Clent Mews | DY11 7AS |
| Collier Close | DY11 7BF |
| Coppice Trading Estate | DY11 7HJ |
| Cotswold Close | DY11 7BU |
| Crosbie Grove | DY11 7DS DY11 7FX |
| Dowles Road | DY11 7FR |
| Easter Park | DY11 7AR |
| Edwin Avenue | DY11 7SY DY11 7SZ |
| Elmley Close | DY11 7NS |
| Falling Sands Close | DY11 7AT |
| Farm Close | DY11 7ED |
| Felix Baxter Drive | DY11 7DP DY11 7FG DY11 7FH DY11 7FJ DY11 7FU |
| Ferguson Drive | DY11 7HG DY11 7HL |
| Firs Industrial Estate | DY11 7QN |
| Foley Avenue | DY11 7PG |
| Foley Drive | DY11 7PS |
| Foley Grove | DY11 7PT |
| Foley Industrial Estate | DY11 7DH |
| Gamson Close | DY10 1LD |
| Goldthorn Court | DY11 7BP |
| Goldthorn Place | DY11 7JW |
| Hoo Farm Industrial Estate | DY11 7RA |
| Hoobrook Enterprise Centre | DY10 1HB |
| Hoobrook Industrial Estate | DY10 1HY |
| Kirkby Drive | DY11 7DW DY11 7DZ |
| Lickey Grove | DY11 7HR |
| Lisle Avenue | DY11 7DF DY11 7DJ DY11 7DL DY11 7DN |
| Logan Place | DY11 7DA |
| Oldington Trading Estate | DY11 7QP |
| Parry Road | DY11 6LY |
| Rifle Range Road | DY11 7NB DY11 7NN |
| Severn Grove | DY11 7NT |
| Silverwoods Way | DY11 7DT |
| Stourport Road | DY11 7DX DY11 7FL DY11 7PZ DY11 7QE DY11 7QH DY11 7QL DY11 7QT |
| Vale Industrial Estate | DY11 7QU |
| Vanneck Close | DY11 7AU |
| Vera Roberts Way | DY11 7NL |
| Weir Crescent | DY11 7AX DY11 7AY |
| Whitegate Drive | DY11 6LQ |
| Whitehouse Road | DY10 1HT |
| Wigse Avenue | DY11 7FA DY11 7FD |
| Worcester Road | DY10 1HS DY10 1HU DY10 1JB DY10 1JR DY10 1JS DY11 7RD DY11 7RE |
| Wrekin Close | DY11 7BX |
| DY11 7EY DY11 7FT DY11 7FW DY10 1DG |
Transport near Foley Park & Hoobrook
- FAQ
- Price Paid By Year
- Property Type Price
Frequently asked questions about Foley Park & Hoobrook
What is the average price for a property for sale in Foley Park & Hoobrook?
The average price for a property for sale in Foley Park & Hoobrook is £292,948. This amount is 13% higher than the average price in Kidderminster. There are 2,525 property listings for sale in Foley Park & Hoobrook.
What streets have the most expensive properties for sale in Foley Park & Hoobrook?
The streets with the most expensive properties for sale in Foley Park & Hoobrook are Vanneck Close at an average of £481,166, Kirkby Drive at an average of £380,000 and Falling Sands Close at an average of £366,000.
What streets have the most affordable properties for sale in Foley Park & Hoobrook?
The streets with the most affordable properties for sale in Foley Park & Hoobrook are Logan Place at an average of £194,500, Silverwoods Way at an average of £227,833 and Felix Baxter Drive at an average of £236,165.
Which train stations are available in or near Foley Park & Hoobrook?
Some of the train stations available in or near Foley Park & Hoobrook are Kidderminster, Hartlebury and Blakedown.
Property Price Paid in Foley Park & Hoobrook by Year
The average sold property price by year was:
| Year | Average Sold Price | Price Change |
Sold Properties
|
|---|---|---|---|
| 2025 | £267,949 | -13% |
20 Properties |
| 2024 | £302,947 | -7% |
19 Properties |
| 2023 | £323,950 | 23% |
10 Properties |
| 2022 | £249,546 | 0,2% |
16 Properties |
| 2021 | £249,026 | -0,4% |
40 Properties |
| 2020 | £250,062 | 19% |
43 Properties |
| 2019 | £202,444 | -26% |
9 Properties |
| 2018 | £254,443 | 2% |
9 Properties |
| 2017 | £248,637 | -8% |
69 Properties |
| 2016 | £269,049 | 24% |
56 Properties |
| 2015 | £204,036 | 9% |
52 Properties |
| 2014 | £184,849 | -62% |
18 Properties |
| 2008 | £300,000 | - |
1 Property |
Property Price per Property Type in Foley Park & Hoobrook
Here you can find historic sold price data in order to help with your property search.
The average Property Paid Price for specific property types in the last three years are:
| Property Type | Average Sold Price | Sold Properties |
|---|---|---|
| Semi Detached House | £233,035.00 | 14 Semi Detached Houses |
| Detached House | £366,565.00 | 23 Detached Houses |
| Terraced House | £221,750.00 | 12 Terraced Houses |

