
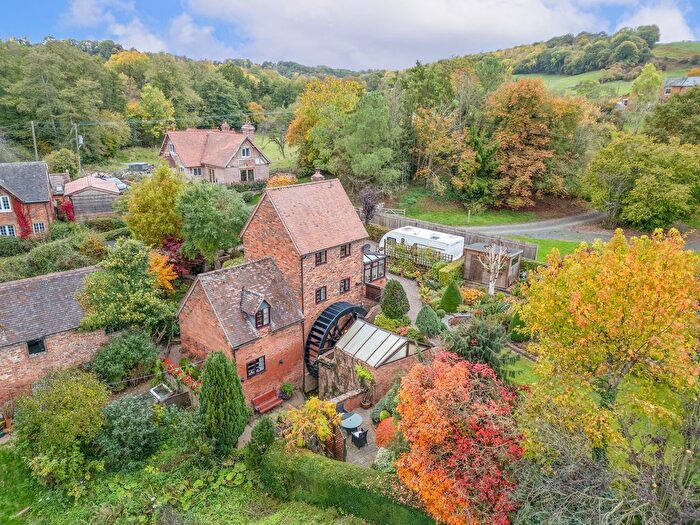
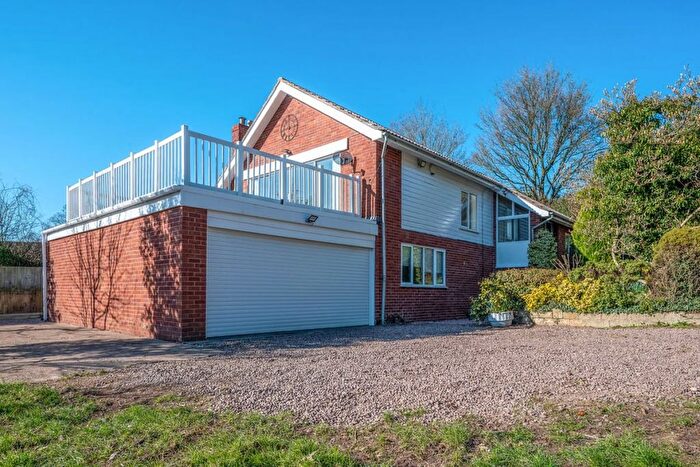
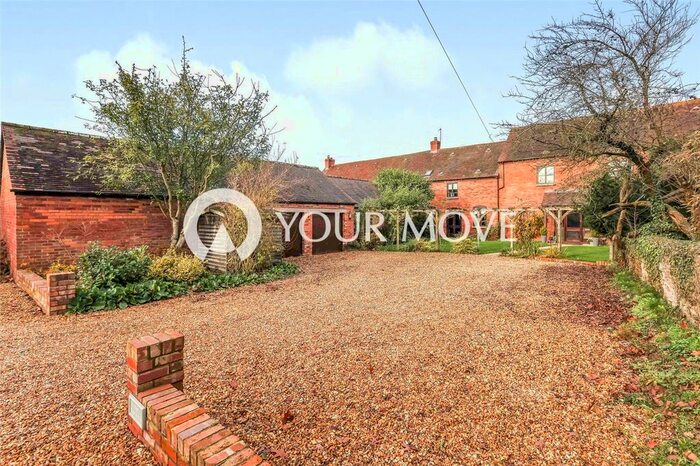
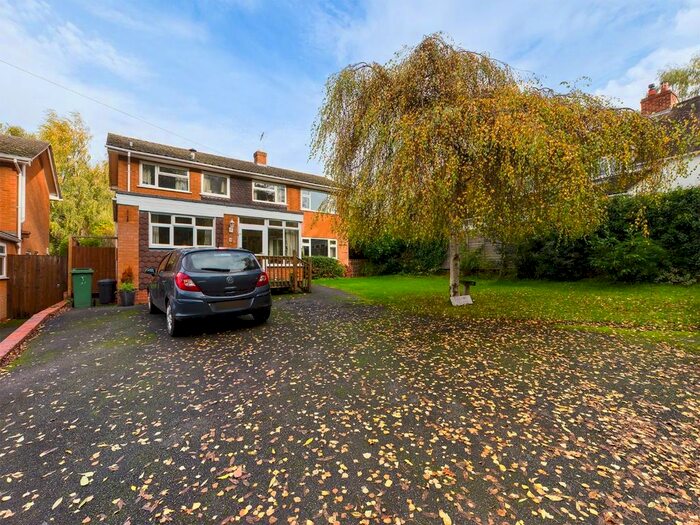
Houses for sale in Lindridge, Worcester
House Prices in Lindridge
Properties in Lindridge have an average house price of £498k and had 7 Property Transactions within the last 3 years¹.
Lindridge is an area in Worcester, Worcestershire with 126 households², where the most expensive property was sold for £650k.
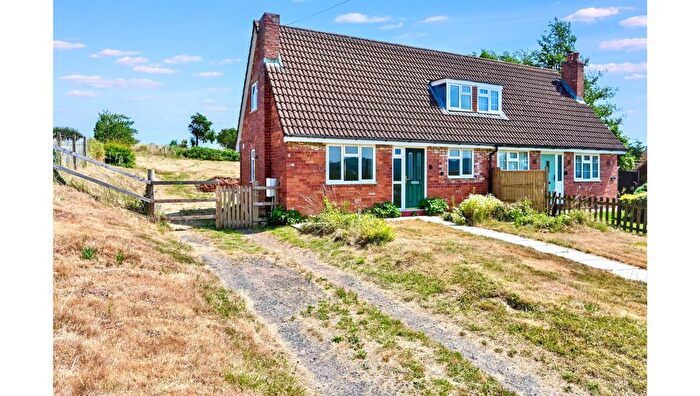
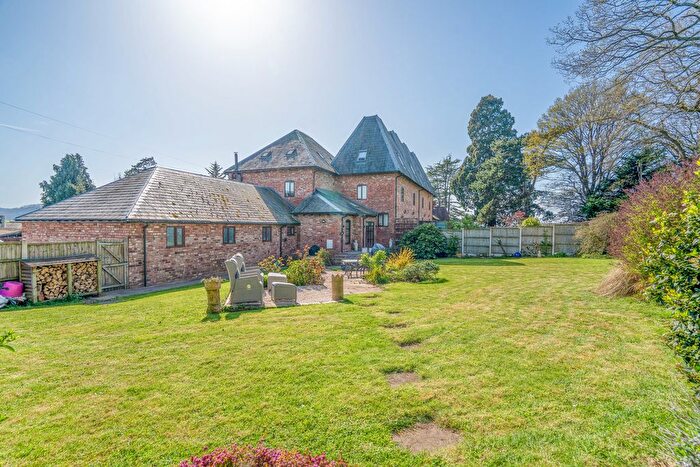
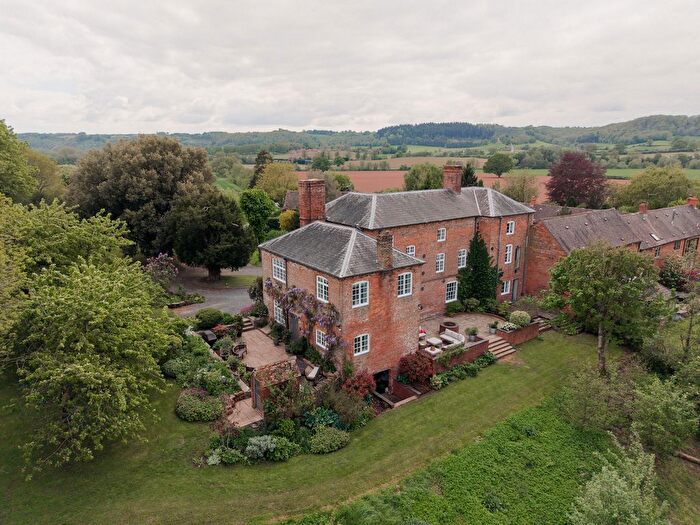
Properties for sale in Lindridge
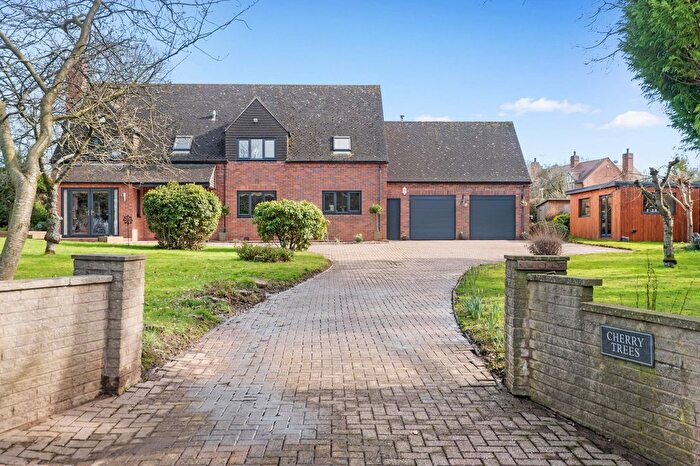
Previously listed properties in Lindridge

![]()
If you are looking to sell your house, let it out, or receive a property valuation, an expert can help you.
Click the button below to get started.


Roads and Postcodes in Lindridge
Navigate through our locations to find the location of your next house in Lindridge, Worcester for sale or to rent.
| Streets | Postcodes |
|---|---|
| Coppice Close | WR6 6UH |
| Lowe Green | WR6 6UA |
| Valley View | WR6 6UU |
| WR6 6UB WR6 6UG WR6 6UT WR6 6UX WR6 6XA WR6 6XB WR6 6XF |
Property price trends in Lindridge
According to the latest Land Registry data, the average home in Lindridge sold for £490,000 in 2025. That figure comes from 116 sales logged over the past 30 years.
Prices have continued to climb over the last three years. Compared with 2022, when the typical sale came in around £314,000, that's a rise of roughly 56.1%.
Looking back five years, average prices are up about 66.4% since 2020, a gain of around £195,500 in cash terms.
Zoom out to the past decade for the fuller picture. Back in 2015, homes here averaged £329,000, so the typical sold price has climbed about 48.9% since then, roughly 4.1% a year. Stretch the view to fifteen years and that annual pace eases back to about 3.3%.
Frequently asked questions about Lindridge
What is the average price for a property for sale in Lindridge?
The average price for a property for sale in Lindridge is £497,500. This amount is 60% higher than the average price in Worcester. There are 12 property listings for sale in Lindridge.
Which train stations are available in or near Lindridge?
Some of the train stations available in or near Lindridge are Hartlebury, Kidderminster and Droitwich Spa.
Property Price Paid in Lindridge by Year
The average sold property price by year was:
| Year | Average Sold Price | Price Change |
Sold Properties
|
|---|---|---|---|
| 2025 | £490,000 | 1% |
1 Property |
| 2024 | £486,875 | -7% |
4 Properties |
| 2023 | £522,500 | 40% |
2 Properties |
| 2022 | £314,000 | -51% |
2 Properties |
| 2021 | £474,997 | 38% |
2 Properties |
| 2020 | £294,500 | -35% |
4 Properties |
| 2019 | £396,666 | -7% |
3 Properties |
| 2018 | £423,200 | 20% |
5 Properties |
| 2017 | £339,500 | 3% |
6 Properties |
| 2016 | £330,916 | 1% |
6 Properties |
Property Price per Property Type in Lindridge
Here you can find historic sold price data in order to help with your property search.
The average Property Paid Price for specific property types in the last three years are:
| Property Type | Average Sold Price | Sold Properties |
|---|---|---|
| Semi Detached House | £541,500.00 | 2 Semi Detached Houses |
| Terraced House | £504,833.00 | 3 Terraced Houses |
| Detached House | £442,500.00 | 2 Detached Houses |
