Houses for sale & to rent in Eckington, Pershore
House Prices in Eckington
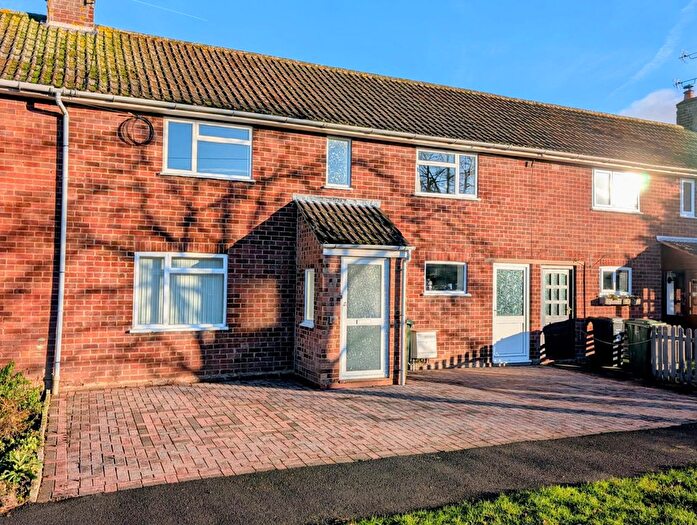
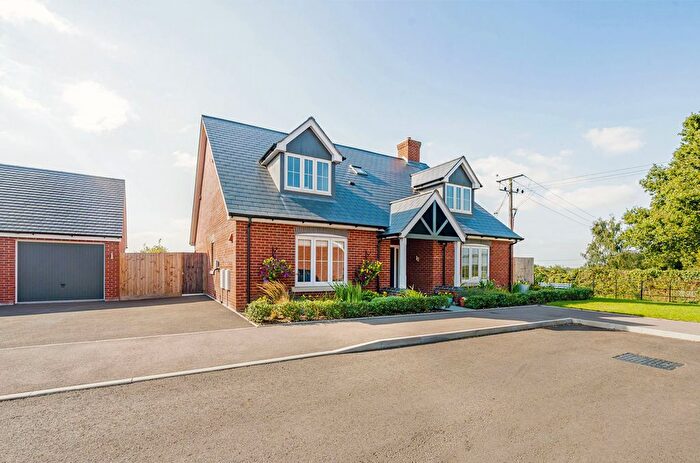
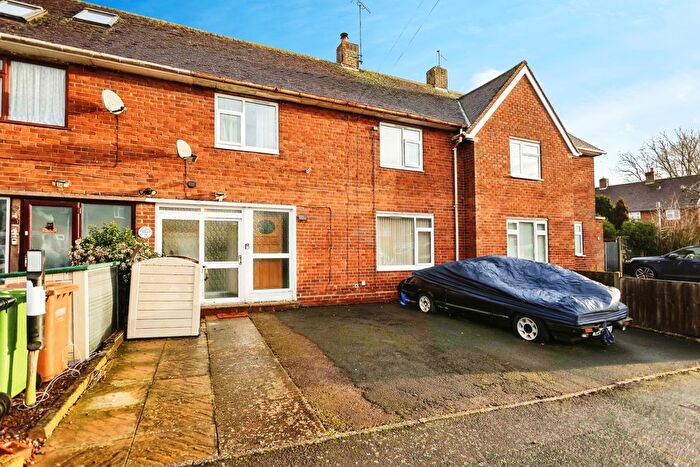
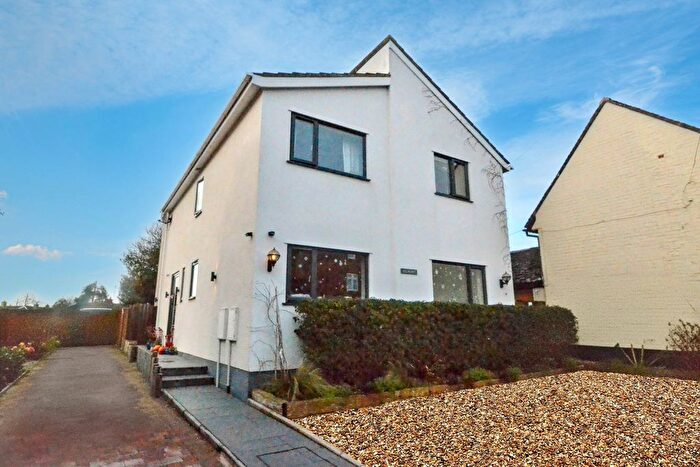
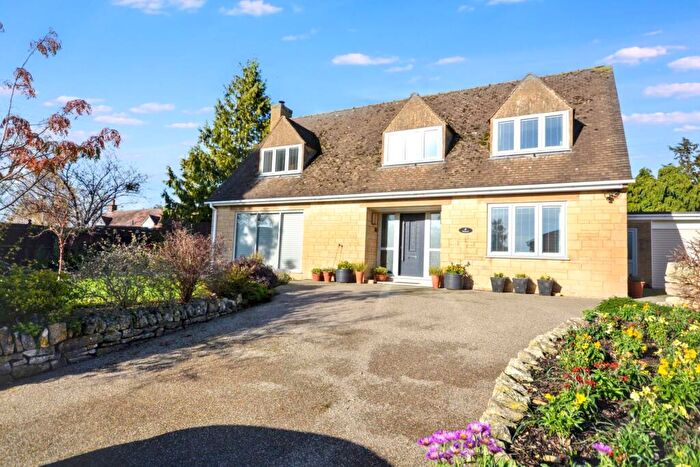
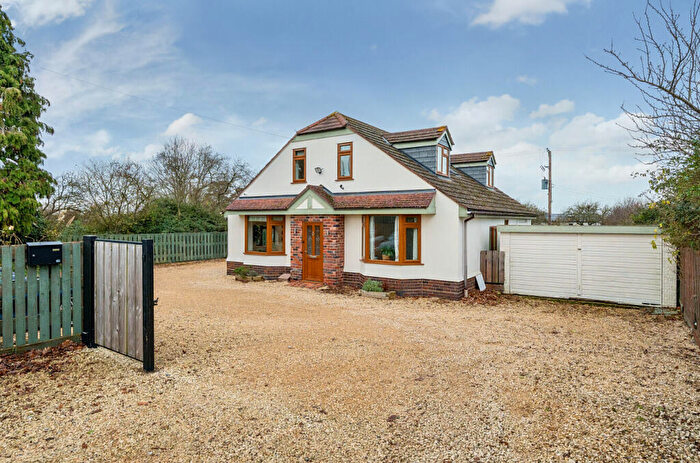
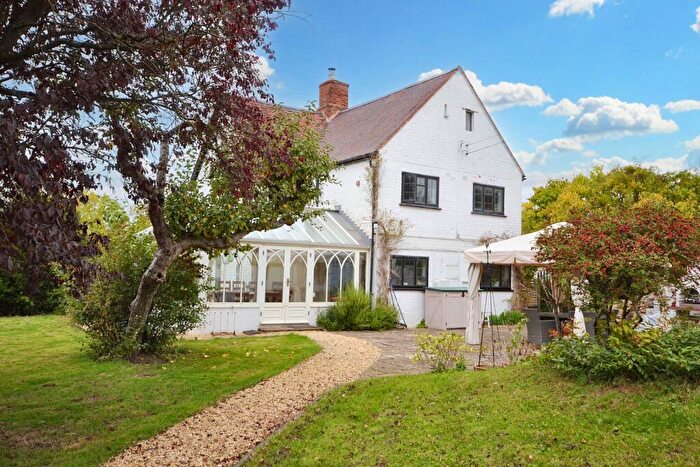
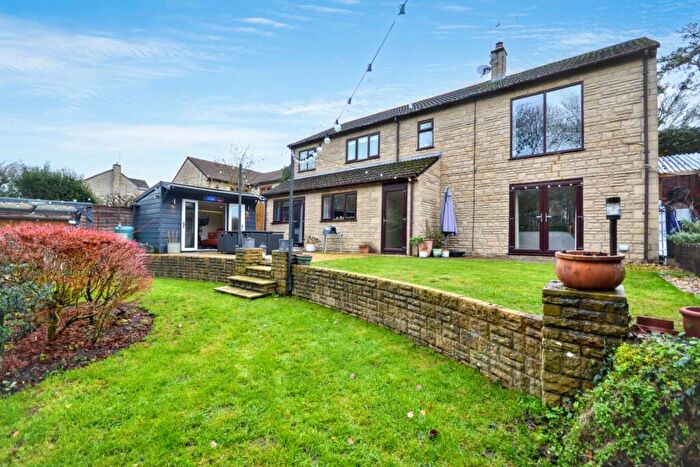
Properties in Eckington have an average house price of £498,555.00 and had 52 Property Transactions within the last 3 years¹.
Eckington is an area in Pershore, Worcestershire with 682 households², where the most expensive property was sold for £1,750,000.00.
Properties for sale in Eckington
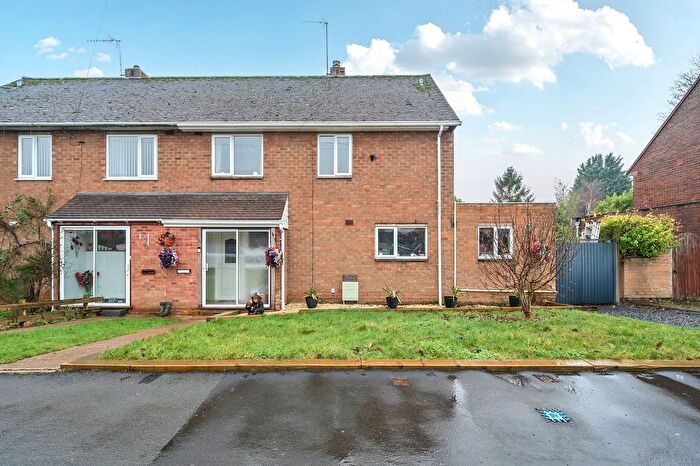
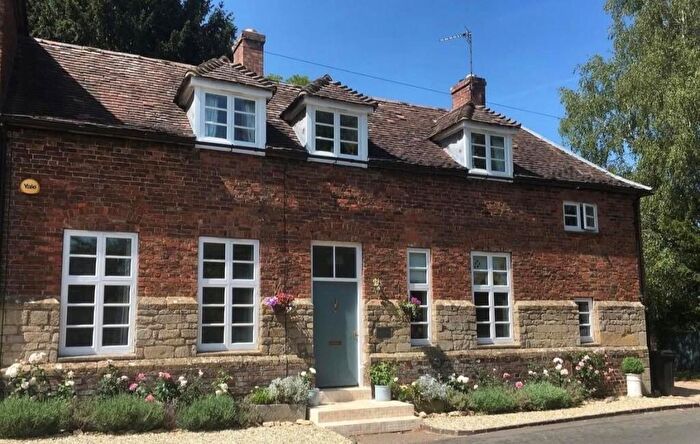
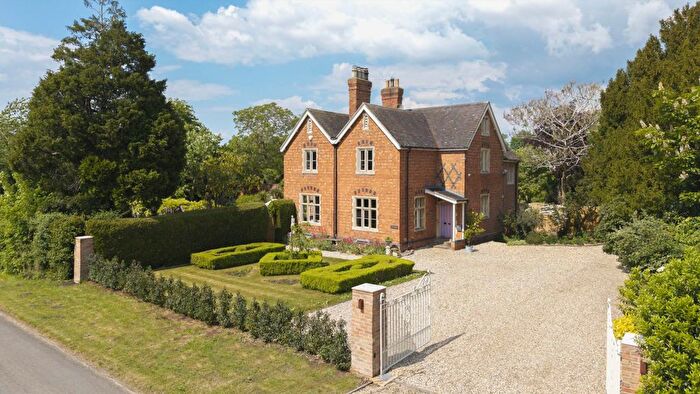
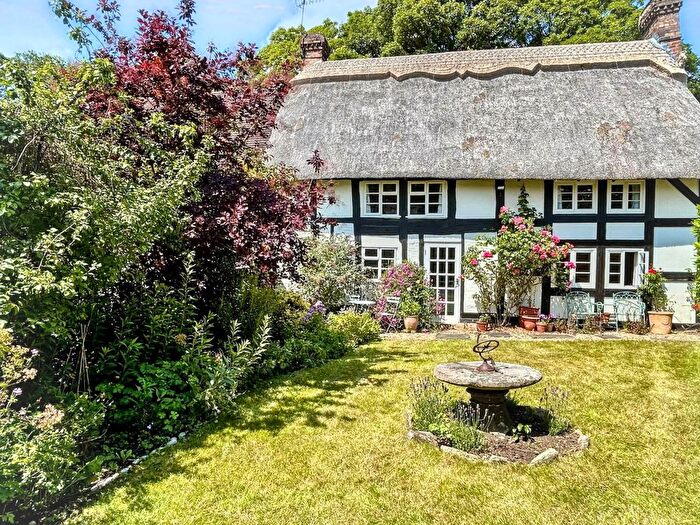
Previously listed properties in Eckington
Roads and Postcodes in Eckington
Navigate through our locations to find the location of your next house in Eckington, Pershore for sale or to rent.
| Streets | Postcodes |
|---|---|
| Avon Drive | WR10 3BU |
| Berwick Lane | WR10 3AE |
| Besford Bridge | WR10 2AD |
| Boon Street | WR10 3BL |
| Broadway Road | WR10 3AF WR10 3AG |
| Church Street | WR10 3AN WR10 3AQ |
| Cotheridge Lane | WR10 3BA |
| Damson View | WR10 3FD |
| Defford Road | WR10 3BZ |
| Drakes Bridge Road | WR10 3BN |
| Eckington Road | WR10 3DA WR10 3DB |
| Glenmoor | WR10 3BW |
| Hacketts Lane | WR10 3DG |
| Hammock Road | WR10 3BJ |
| Hanford Drive | WR10 3AL |
| Hollands Road | WR10 3DL WR10 3DF |
| Jarvis Drive | WR10 3PE |
| Jarvis Street | WR10 3AS |
| King William Iv Close | WR10 3AH |
| Lower End | WR10 3AD |
| Manor Road | WR10 3BH |
| Mill Lane | WR10 3BG WR10 3BQ |
| Monkham Hill | WR10 3FE |
| Nafford Road | WR10 3DH WR10 3DJ |
| New Road | WR10 3AR WR10 3AZ |
| Ninesquares | WR10 3PZ |
| Pass Street | WR10 3AX |
| Peason Lane | WR10 3FA |
| Pershore Road | WR10 3AP |
| Roman Meadow | WR10 3AJ |
| Rosa Gardens | WR10 3FG |
| Russell Drive | WR10 3BP |
| School Lane | WR10 3AU |
| Silk Mill Row | WR10 3AT |
| Station Gardens | WR10 3EZ |
| Station Road | WR10 3BB WR10 3BD |
| Stony Furlong Lane | WR10 3BT |
| Tewkesbury Road | WR10 3AW WR10 3DE |
| The Close | WR10 3AY |
| The Green | WR10 3BE |
| The Pippins | WR10 3PY |
| Upper End | WR10 3AA WR10 3DQ |
| Vicarage Gardens | WR10 3BS |
| WR10 3AB WR10 3DN WR10 3DD WR10 3FF |
Transport near Eckington
-
Pershore Station
-
Ashchurch Station
-
Evesham Station
-
Great Malvern Station
-
Worcester Shrub Hill Station
-
Worcester Foregate Street Station
-
Malvern Link Station
- FAQ
- Price Paid By Year
- Property Type Price
Frequently asked questions about Eckington
What is the average price for a property for sale in Eckington?
The average price for a property for sale in Eckington is £498,555. This amount is 29% higher than the average price in Pershore. There are 213 property listings for sale in Eckington.
What streets have the most expensive properties for sale in Eckington?
The streets with the most expensive properties for sale in Eckington are New Road at an average of £1,110,000, Besford Bridge at an average of £840,000 and Pershore Road at an average of £682,500.
What streets have the most affordable properties for sale in Eckington?
The streets with the most affordable properties for sale in Eckington are Station Gardens at an average of £310,000, Upper End at an average of £329,000 and Station Road at an average of £362,500.
Which train stations are available in or near Eckington?
Some of the train stations available in or near Eckington are Pershore, Ashchurch and Evesham.
Property Price Paid in Eckington by Year
The average sold property price by year was:
| Year | Average Sold Price | Price Change |
Sold Properties
|
|---|---|---|---|
| 2025 | £508,300 | -6% |
10 Properties |
| 2024 | £537,922 | 15% |
21 Properties |
| 2023 | £454,547 | -4% |
21 Properties |
| 2022 | £470,528 | -4% |
16 Properties |
| 2021 | £488,112 | 19% |
31 Properties |
| 2020 | £397,469 | -6% |
21 Properties |
| 2019 | £419,333 | - |
12 Properties |
| 2018 | £419,285 | 10% |
21 Properties |
| 2017 | £378,851 | 21% |
27 Properties |
| 2016 | £300,187 | -49% |
24 Properties |
| 2015 | £447,897 | 19% |
20 Properties |
| 2014 | £361,220 | 20% |
29 Properties |
| 2013 | £287,830 | 12% |
15 Properties |
| 2012 | £253,272 | -21% |
11 Properties |
| 2011 | £305,216 | -14% |
43 Properties |
| 2010 | £347,793 | 19% |
22 Properties |
| 2009 | £283,272 | 2% |
22 Properties |
| 2008 | £278,370 | -12% |
12 Properties |
| 2007 | £311,900 | -2% |
14 Properties |
| 2006 | £317,787 | 16% |
31 Properties |
| 2005 | £267,155 | -0,4% |
20 Properties |
| 2004 | £268,296 | -2% |
27 Properties |
| 2003 | £274,534 | 19% |
28 Properties |
| 2002 | £222,999 | 19% |
31 Properties |
| 2001 | £181,090 | 12% |
27 Properties |
| 2000 | £158,580 | 12% |
22 Properties |
| 1999 | £139,316 | -0,3% |
34 Properties |
| 1998 | £139,709 | 5% |
26 Properties |
| 1997 | £133,054 | 13% |
35 Properties |
| 1996 | £115,567 | 2% |
28 Properties |
| 1995 | £113,454 | - |
21 Properties |
Property Price per Property Type in Eckington
Here you can find historic sold price data in order to help with your property search.
The average Property Paid Price for specific property types in the last three years are:
| Property Type | Average Sold Price | Sold Properties |
|---|---|---|
| Semi Detached House | £438,437.00 | 8 Semi Detached Houses |
| Detached House | £562,288.00 | 36 Detached Houses |
| Terraced House | £277,500.00 | 6 Terraced Houses |
| Flat | £255,000.00 | 2 Flats |

