
Houses for sale in Eckington, Worcester
House Prices in Eckington
Properties in Eckington have an average house price of £515k and had 41 Property Transactions within the last 3 years¹.
Eckington is an area in Worcester, Worcestershire with 506 households², where the most expensive property was sold for £1.2M.
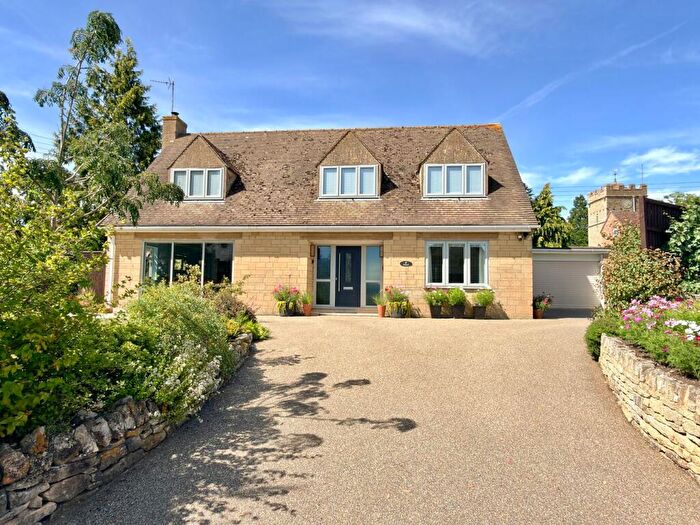
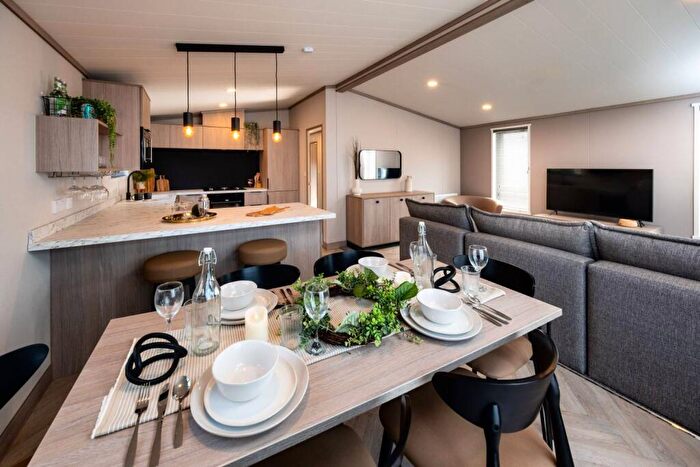
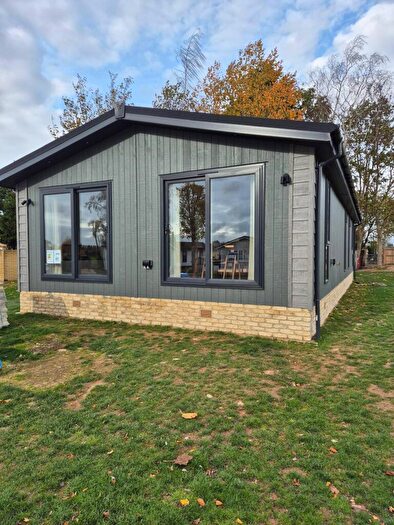
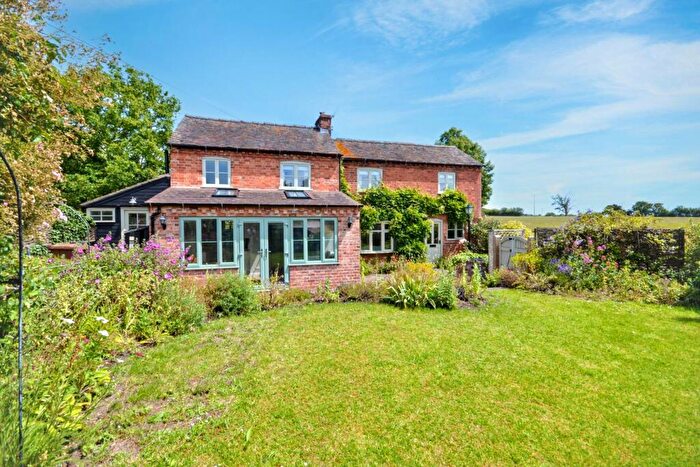
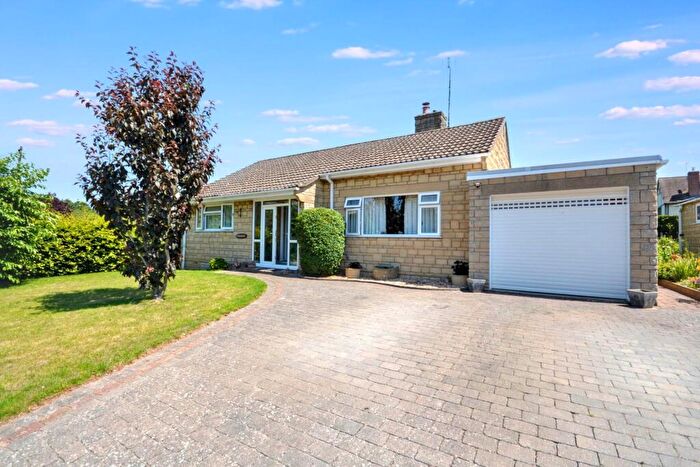
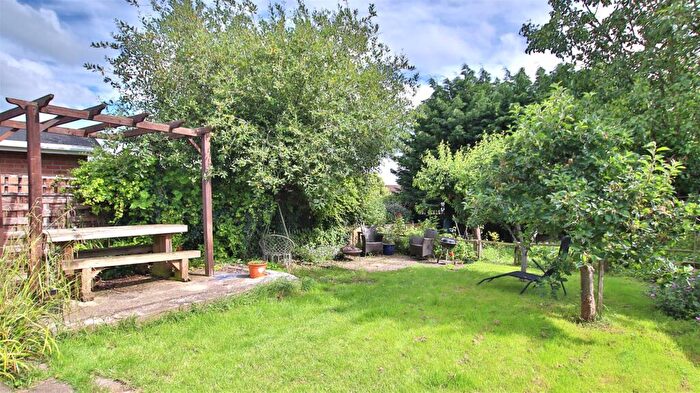
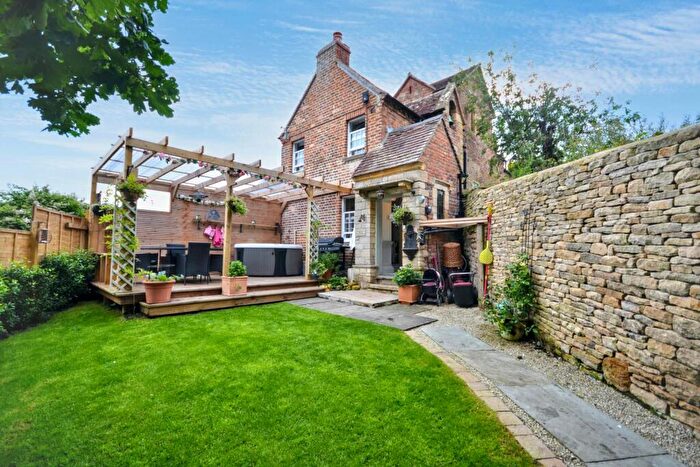
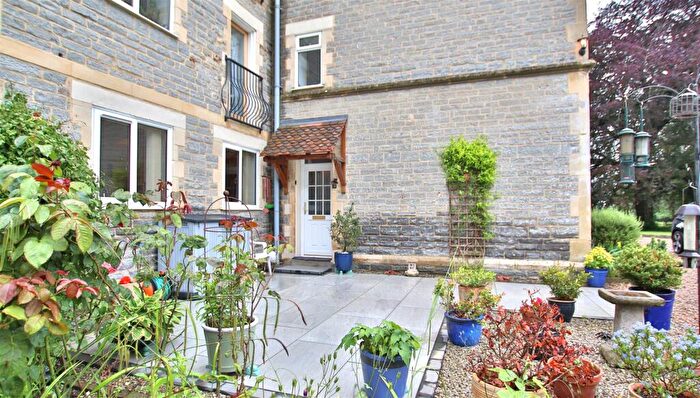
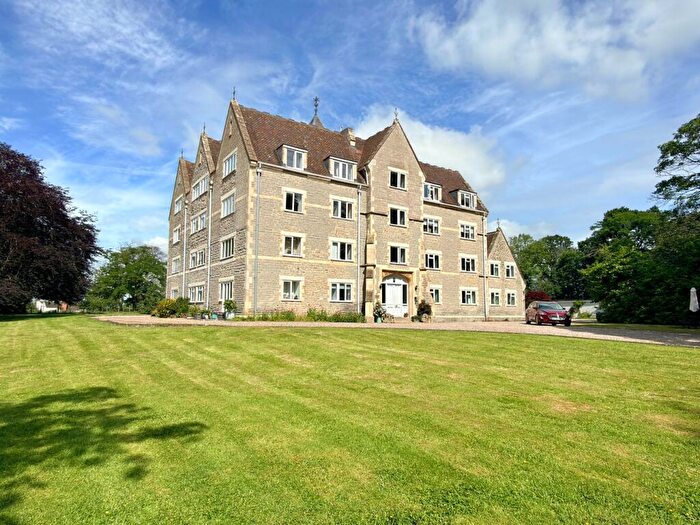
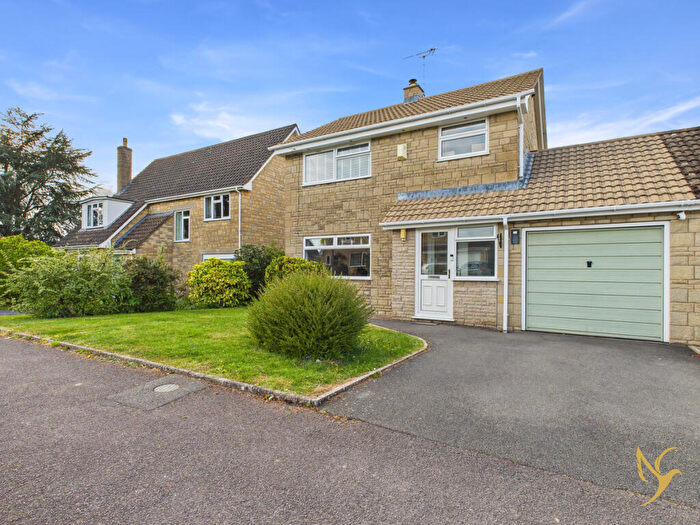
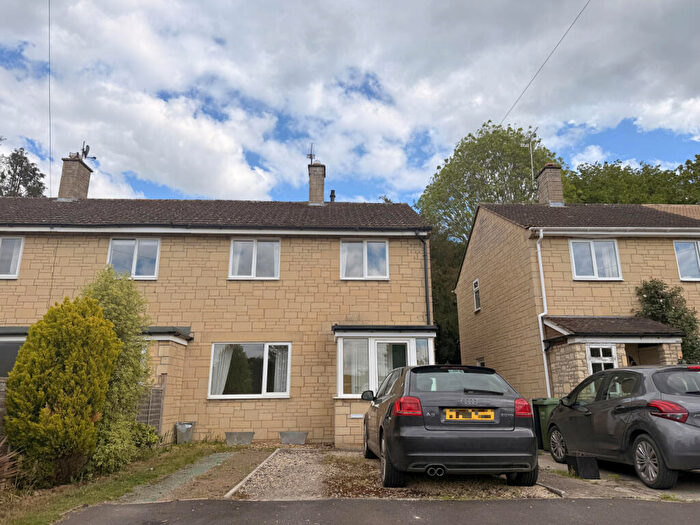
Properties for sale in Eckington
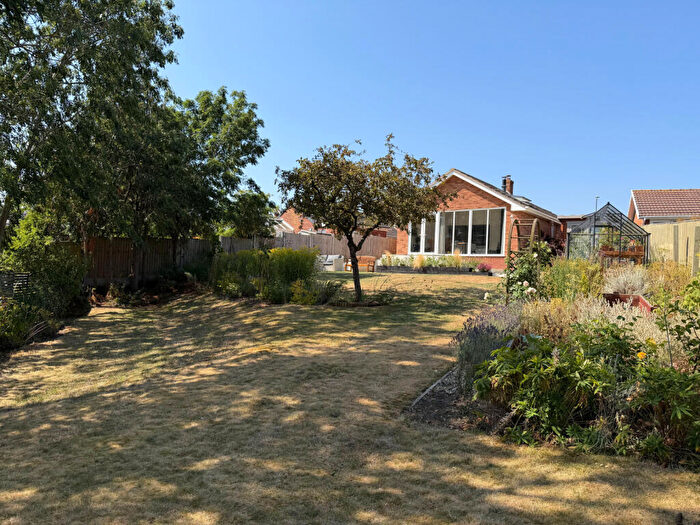


![]()
If you are looking to sell your house, let it out, or receive a property valuation, an expert can help you.
Click the button below to get started.
Roads and Postcodes in Eckington
Navigate through our locations to find the location of your next house in Eckington, Worcester for sale or to rent.
| Streets | Postcodes |
|---|---|
| Baughton Lane | WR8 9LL |
| Besford Court Estate | WR8 9LZ |
| Besford Road | WR8 9AN WR8 9HE |
| Bluebell Lane | WR8 9AA |
| Bourne Road | WR8 9BS WR8 9BT |
| Box Tree Close | WR8 9BX |
| Broad Hill | WR8 9AE |
| Brutons Orchard | WR8 9BQ |
| Church Close | WR8 9AY |
| Court Road | WR8 9LP |
| Croome Road | WR8 9AR WR8 9AS |
| Crown Lane | WR8 9BE |
| Harewell Lane | WR8 9AT |
| Harpley Road | WR8 9BL |
| Hill View | WR8 9BH |
| Hill View Road | WR8 9LJ |
| Ladywood Road | WR8 9AG WR8 9AJ |
| Lodge Hill | WR8 9AD |
| Lower Drive | WR8 9AH |
| Lower Strensham | WR8 9LW |
| Mill Lane | WR8 9LB |
| Rebecca Road | WR8 9ES |
| Salters Lane | WR8 9AX |
| Severn Stoke Road | WR8 9AW |
| Spring Bank | WR8 9BB |
| St Peters Lane | WR8 9AP |
| Strensham Business Park | WR8 9JZ |
| Strensham Court Mews | WR8 9LR |
| Strensham Gate | WR8 9JY |
| Strensham Road | WR8 0QD |
| The Acre | WR8 9BZ |
| The Granary | WR8 9BY |
| The Lane | WR8 9LN |
| The Old Barns | WR8 9DZ |
| Twyning Road | WR8 9AF WR8 9LH |
| Upper Street | WR8 9AB WR8 9BG |
| Upton Drive | WR8 9BF |
| Upton Road | WR8 9BA WR8 9BD WR8 9BU |
| Woodmancote | WR8 9BP WR8 9BN WR8 9BW |
| WR8 9BJ WR8 9ET WR8 9LD |
Property price trends in Eckington
According to the latest Land Registry data, the average home in Eckington sold for £563,392 in 2025. That figure comes from 592 sales logged over the past 30 years.
Prices have continued to climb over the last three years. Compared with 2022, when the typical sale came in around £471,792, that's a rise of roughly 19.4%.
Looking back five years, average prices are up about 24.3% since 2020, a gain of around £110,281 in cash terms.
Zoom out to the past decade for the fuller picture. Back in 2015, homes here averaged £346,861, so the typical sold price has climbed about 62.4% since then, roughly 5% a year. Stretch the view to fifteen years and that annual pace eases back to about 3.1%.
Frequently asked questions about Eckington
What is the average price for a property for sale in Eckington?
The average price for a property for sale in Eckington is £514,719. This amount is 65% higher than the average price in Worcester. There are 631 property listings for sale in Eckington.
What streets have the most expensive properties for sale in Eckington?
The streets with the most expensive properties for sale in Eckington are Besford Road at an average of £775,000, Baughton Lane at an average of £730,000 and Harewell Lane at an average of £680,000.
What streets have the most affordable properties for sale in Eckington?
The streets with the most affordable properties for sale in Eckington are Harpley Road at an average of £251,666, Strensham Gate at an average of £256,333 and Hill View at an average of £275,000.
Which train stations are available in or near Eckington?
Some of the train stations available in or near Eckington are Pershore, Ashchurch and Evesham.
Property Price Paid in Eckington by Year
The average sold property price by year was:
| Year | Average Sold Price | Price Change |
Sold Properties
|
|---|---|---|---|
| 2025 | £563,392 | 17% |
14 Properties |
| 2024 | £466,100 | -11% |
15 Properties |
| 2023 | £518,708 | 9% |
12 Properties |
| 2022 | £471,792 | -5% |
19 Properties |
| 2021 | £493,423 | 8% |
26 Properties |
| 2020 | £453,111 | 4% |
18 Properties |
| 2019 | £435,272 | 5% |
20 Properties |
| 2018 | £414,972 | -1% |
18 Properties |
| 2017 | £418,384 | 5% |
22 Properties |
| 2016 | £399,023 | 13% |
21 Properties |
Property Price per Property Type in Eckington
Here you can find historic sold price data in order to help with your property search.
The average Property Paid Price for specific property types in the last three years are:
| Property Type | Average Sold Price | Sold Properties |
|---|---|---|
| Semi Detached House | £318,833.00 | 12 Semi Detached Houses |
| Detached House | £607,232.00 | 28 Detached Houses |
| Terraced House | £275,000.00 | 1 Terraced House |
