
Houses for sale in Inkberrow, Redditch
House Prices in Inkberrow
Properties in Inkberrow have an average house price of £616k and had 35 Property Transactions within the last 3 years¹.
Inkberrow is an area in Redditch, Worcestershire with 557 households², where the most expensive property was sold for £1.36M.
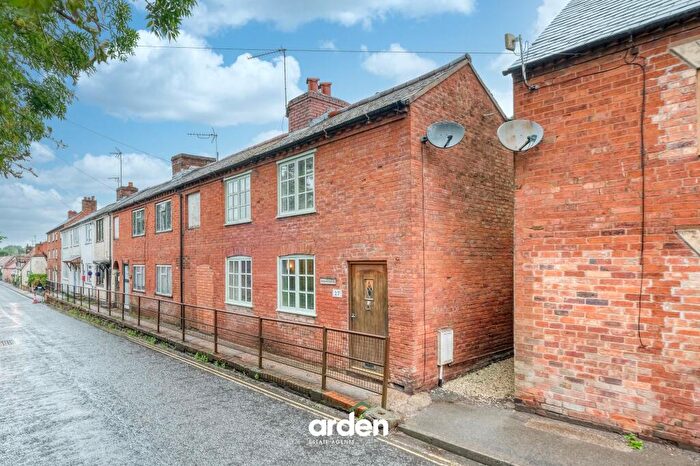
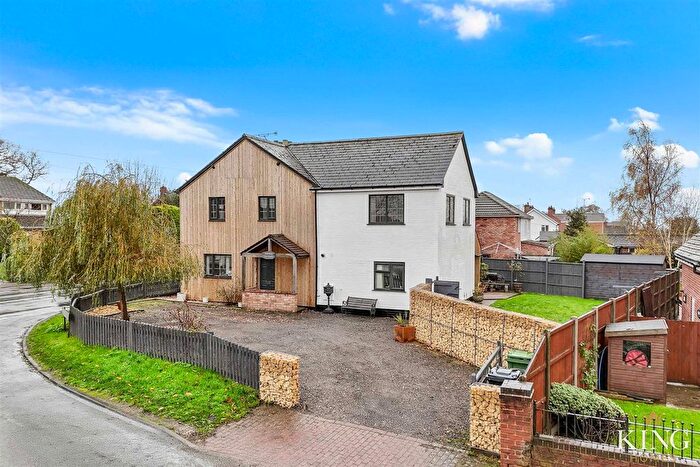
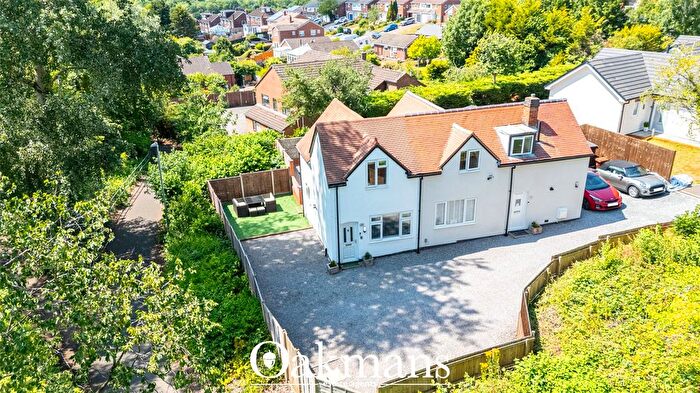
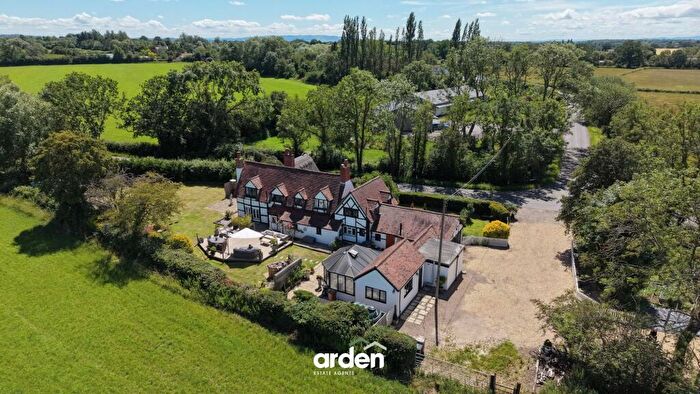
Properties for sale in Inkberrow
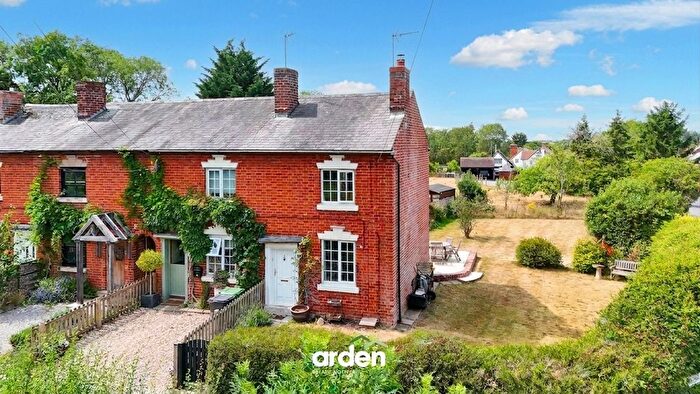
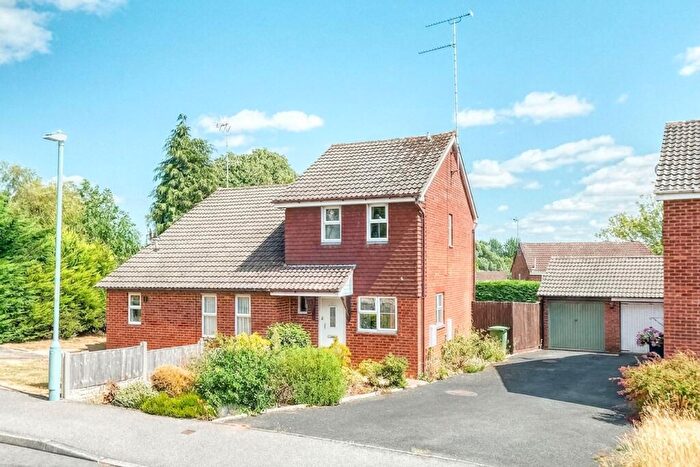
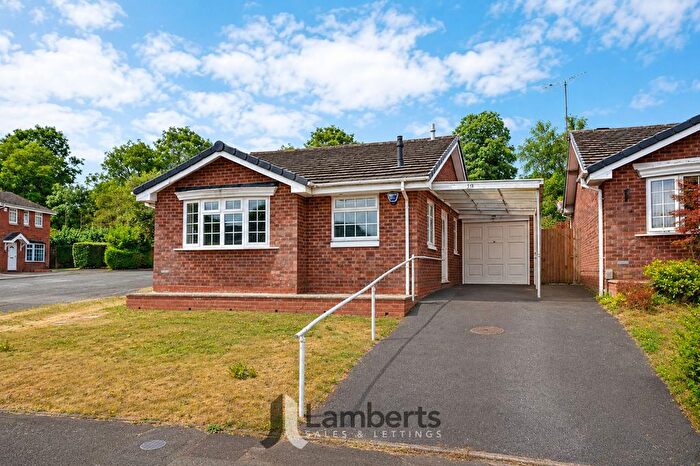
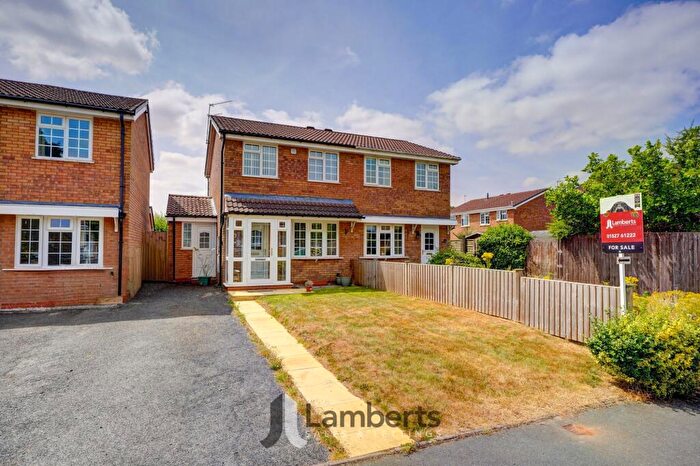
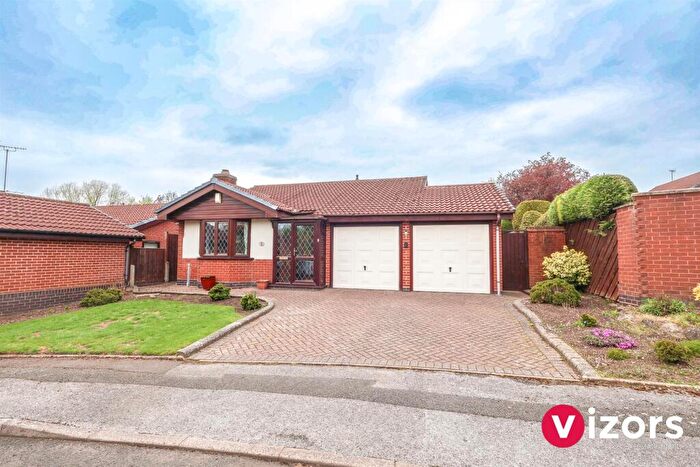
![]()
If you are looking to sell your house, let it out, or receive a property valuation, an expert can help you.
Click the button below to get started.
Roads and Postcodes in Inkberrow
Navigate through our locations to find the location of your next house in Inkberrow, Redditch for sale or to rent.
Property price trends in Inkberrow
According to the latest Land Registry data, the average home in Inkberrow sold for £756,898 in 2025. That figure comes from 478 sales logged over the past 30 years.
Prices have continued to climb over the last three years. Compared with 2022, when the typical sale came in around £655,549, that's a rise of roughly 15.5%.
Looking back five years, average prices are up about 59.7% since 2020, a gain of around £282,977 in cash terms.
Zoom out to the past decade for the fuller picture. Back in 2015, homes here averaged £457,904, so the typical sold price has climbed about 65.3% since then, roughly 5.2% a year. Stretch the view to fifteen years and that annual pace eases back to about 4.5%.
Frequently asked questions about Inkberrow
What is the average price for a property for sale in Inkberrow?
The average price for a property for sale in Inkberrow is £616,179. This amount is 126% higher than the average price in Redditch. There are 1,832 property listings for sale in Inkberrow.
What streets have the most expensive properties for sale in Inkberrow?
The streets with the most expensive properties for sale in Inkberrow are Bradley Green at an average of £1,272,500, Coldshaw Top at an average of £1,100,000 and Green Lane at an average of £976,500.
What streets have the most affordable properties for sale in Inkberrow?
The streets with the most affordable properties for sale in Inkberrow are Droitwich Road at an average of £351,954, Wood Lane at an average of £495,000 and Holberrow Green at an average of £540,000.
Which train stations are available in or near Inkberrow?
Some of the train stations available in or near Inkberrow are Redditch, Bromsgrove and Alvechurch.
Property Price Paid in Inkberrow by Year
The average sold property price by year was:
| Year | Average Sold Price | Price Change |
Sold Properties
|
|---|---|---|---|
| 2025 | £756,898 | 34% |
10 Properties |
| 2024 | £503,318 | -20% |
11 Properties |
| 2023 | £604,344 | -8% |
14 Properties |
| 2022 | £655,549 | 14% |
17 Properties |
| 2021 | £563,850 | 16% |
19 Properties |
| 2020 | £473,921 | -9% |
18 Properties |
| 2019 | £516,833 | 9% |
18 Properties |
| 2018 | £471,642 | -9% |
14 Properties |
| 2017 | £516,238 | 18% |
18 Properties |
| 2016 | £421,416 | -9% |
15 Properties |
Property Price per Property Type in Inkberrow
Here you can find historic sold price data in order to help with your property search.
The average Property Paid Price for specific property types in the last three years are:
| Property Type | Average Sold Price | Sold Properties |
|---|---|---|
| Semi Detached House | £422,136.00 | 6 Semi Detached Houses |
| Detached House | £697,441.00 | 26 Detached Houses |
| Terraced House | £282,500.00 | 2 Terraced Houses |
| Flat | £335,000.00 | 1 Flat |
