Houses for sale & to rent in Hagley, Stourbridge
House Prices in Hagley
Properties in Hagley have an average house price of £434,232.00 and had 181 Property Transactions within the last 3 years¹.
Hagley is an area in Stourbridge, Worcestershire with 1,923 households², where the most expensive property was sold for £1,700,000.00.
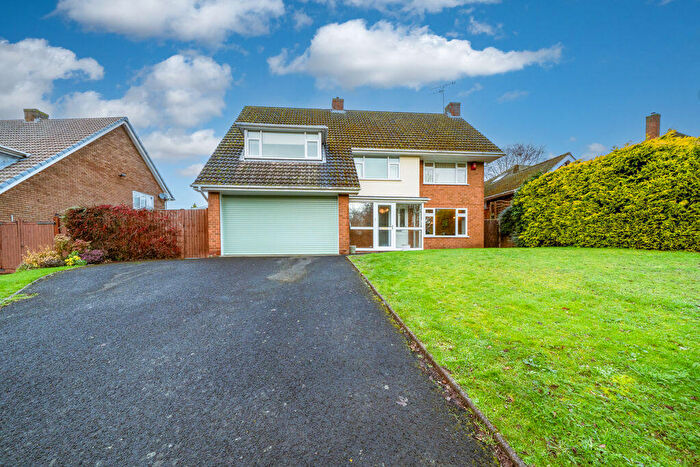
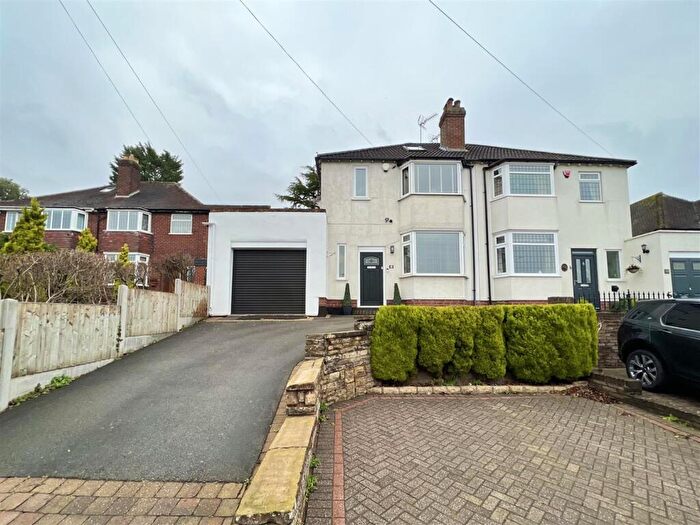
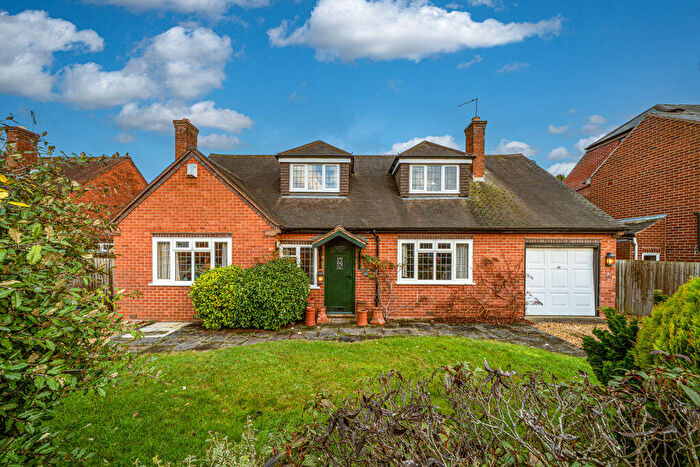
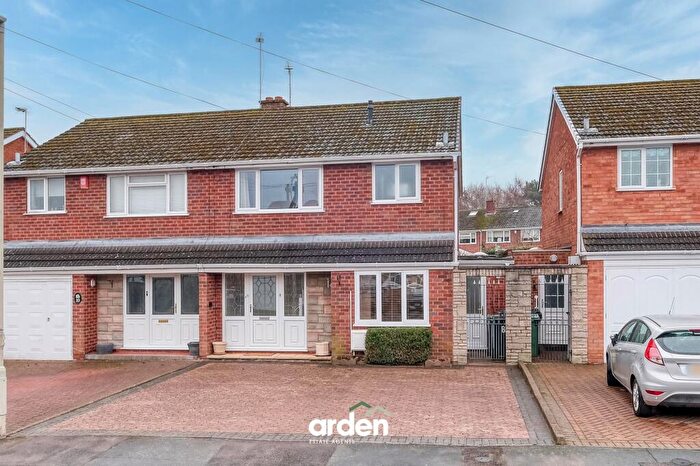
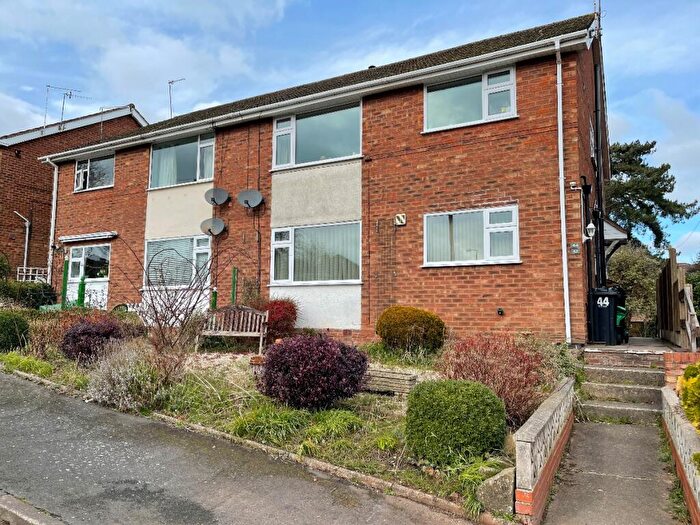
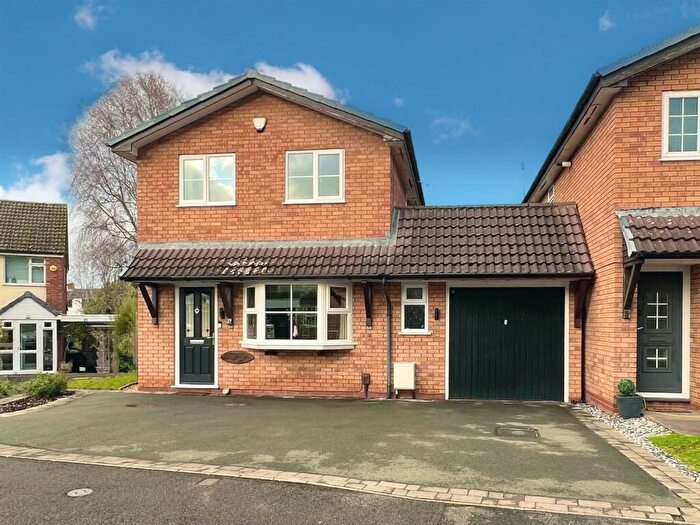
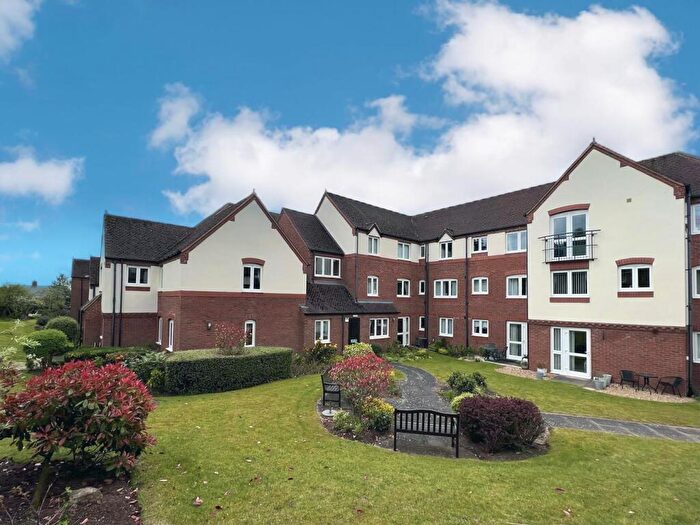
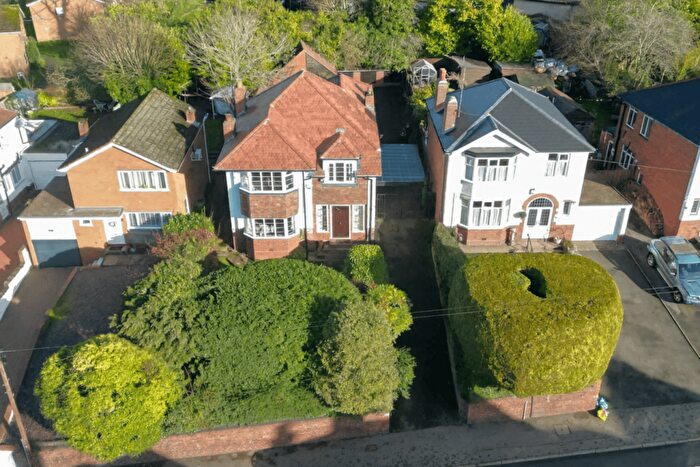
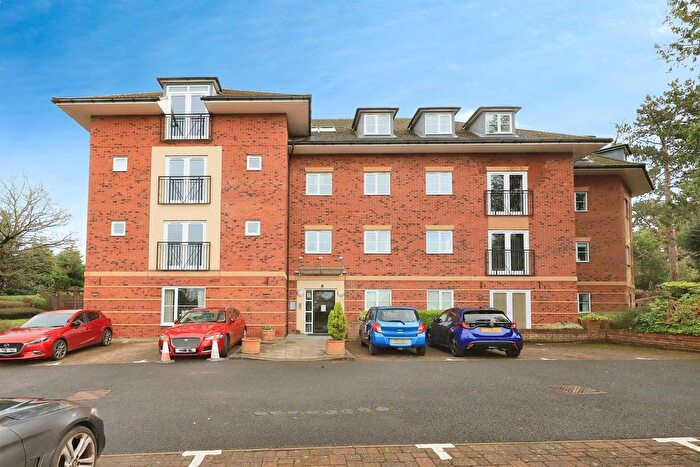
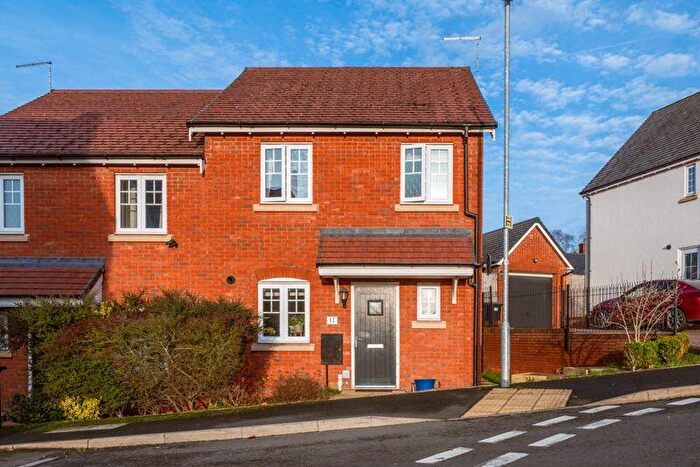
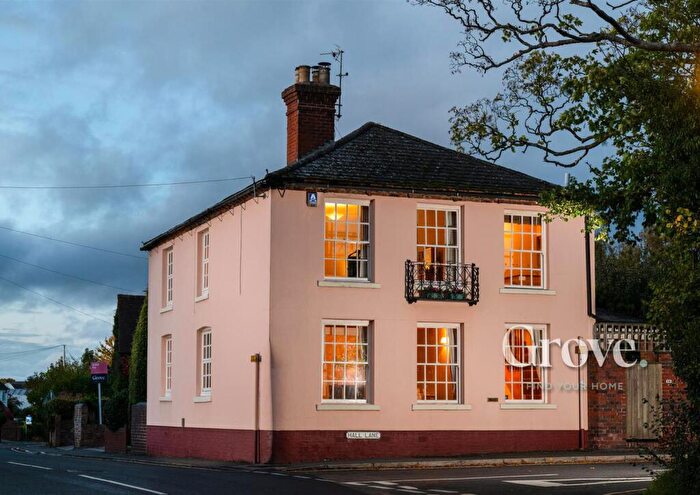
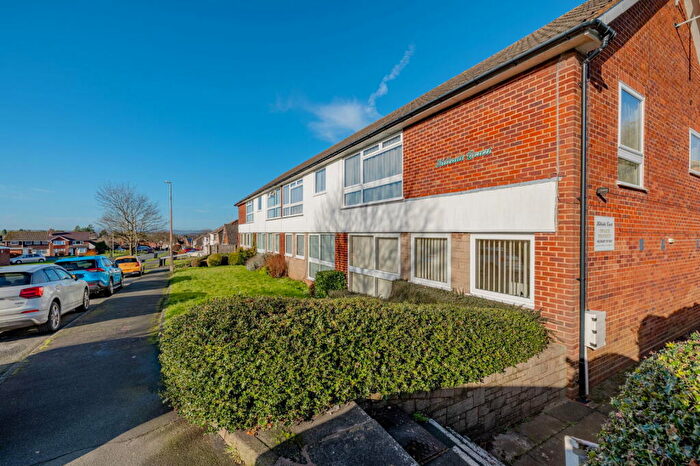
Properties for sale in Hagley
Roads and Postcodes in Hagley
Navigate through our locations to find the location of your next house in Hagley, Stourbridge for sale or to rent.
| Streets | Postcodes |
|---|---|
| Birch Dale | DY8 2YA |
| Birmingham Road | DY9 9JT DY9 9JY DY9 9JZ DY9 9LA DY9 9LB |
| Brake Lane | DY8 2XP DY8 2XW |
| Broadfields | DY9 0PH DY9 0PQ |
| Bromsgrove Road | DY9 9LU DY9 9LX DY9 9LY |
| Brook Crescent | DY9 0QE |
| Brookland Road | DY9 0JZ |
| Cavendish Drive | DY9 0LR DY9 0LS |
| Cedar Grove | DY9 0DR |
| Chapel Street | DY9 0NL |
| Chestnut Drive | DY9 0GH |
| Church Street | DY9 0NA |
| Clent Drive | DY9 9LN |
| Crabtree Close | DY9 0PU |
| Eton Walk | DY9 0PG |
| Ferndale Close | DY9 0QA |
| Hagley Close | DY9 9LP |
| Hagley Grange | DY9 0NQ |
| Hagley Hall Gardens | DY9 9LF |
| Hagley Wood Lane | DY9 9JR |
| Hall Lane | DY9 9LH DY9 9LL |
| Hall Meadow | DY9 9LE |
| Harberrow Close | DY9 0PJ |
| Harrow Close | DY9 0PP |
| Hawthorn Coppice | DY9 0PE |
| Haybridge Avenue | DY8 2XG |
| Haybridge Mews | DY9 0GJ DY9 0GL |
| Hoarstone | DY8 2XF |
| Kidderminster Road | DY9 0PZ DY9 0QD DY9 0QL |
| Kinver Drive | DY9 0GZ |
| Lodge Crescent | DY9 0NB DY9 0ND |
| Long Close | DY9 0LL |
| Long Compton Drive | DY9 0PD |
| Lyttelton Place | DY9 0QJ |
| Malvern Gardens | DY8 2XU |
| Market Way | DY9 9LT |
| Middlefield Lane | DY9 0PX DY9 0PY |
| Milestone Drive | DY9 0LH DY9 0LP DY9 0LW |
| Milton Drive | DY9 9LS |
| Monument Lane | DY9 9JX |
| Newlands Close | DY9 0GY |
| Nursery Close | DY9 0NE |
| Oldfields | DY9 0QG |
| Park Road | DY9 0NS DY9 0QF DY9 0QH DY9 0QQ |
| Rockingham Hall Gardens | DY9 9JQ |
| Rooks Meadow | DY9 0PT |
| School Lane | DY9 9LD |
| Spring Close | DY9 0LN |
| Station Drive | DY9 0NX |
| Station Road | DY9 0NU |
| Stourbridge Road | DY9 0QR DY9 0QS DY9 0QT |
| Summervale Close | DY9 0LZ |
| Summervale Road | DY9 0LX DY9 0LY |
| Sweetpool Lane | DY8 2XA DY8 2XD DY8 2XE DY8 2XH DY9 0NY |
| The Brake | DY8 2XJ |
| The Briars | DY9 0GB |
| The Coppice | DY8 2XZ |
| The Crescent | DY8 2XB |
| The Green | DY9 0GA |
| The Greenway | DY9 0LT |
| The Hawthorns | DY9 0GD |
| The Hazels | DY9 0GF |
| The Oasis | DY9 0AT |
| The Sidings | DY8 2XT |
| The Spruces | DY9 0GE |
| The Sycamores | DY9 0GG |
| Wassell Grove Lane | DY9 9JH DY9 9JP |
| Waterworks Cottages | DY8 2XL |
| West Hagley Mews | DY9 0NZ |
| Willow Close | DY9 0LU |
| Winchester Close | DY9 0PW |
| Winds Point | DY9 0PL DY9 0PN |
| Woodland Avenue | DY8 2XQ |
| Worcester Close | DY9 0NP |
| Worcester Road | DY9 0HQ DY9 0LF DY9 0NG DY9 0NR DY9 0PA DY9 0PB DY9 0PR DY9 0PS |
| Wychbury Drive | DY9 0QU |
| DY8 2XY |
Transport near Hagley
- FAQ
- Price Paid By Year
- Property Type Price
Frequently asked questions about Hagley
What is the average price for a property for sale in Hagley?
The average price for a property for sale in Hagley is £434,232. This amount is 16% lower than the average price in Stourbridge. There are 1,242 property listings for sale in Hagley.
What streets have the most expensive properties for sale in Hagley?
The streets with the most expensive properties for sale in Hagley are Brake Lane at an average of £970,000, Middlefield Lane at an average of £960,625 and Birmingham Road at an average of £940,000.
What streets have the most affordable properties for sale in Hagley?
The streets with the most affordable properties for sale in Hagley are Newlands Close at an average of £156,350, Haybridge Mews at an average of £222,500 and The Brake at an average of £260,000.
Which train stations are available in or near Hagley?
Some of the train stations available in or near Hagley are Hagley, Stourbridge Junction and Blakedown.
Property Price Paid in Hagley by Year
The average sold property price by year was:
| Year | Average Sold Price | Price Change |
Sold Properties
|
|---|---|---|---|
| 2025 | £440,627 | -3% |
50 Properties |
| 2024 | £455,598 | 12% |
75 Properties |
| 2023 | £399,908 | -1% |
56 Properties |
| 2022 | £404,251 | 1% |
83 Properties |
| 2021 | £401,656 | -8% |
102 Properties |
| 2020 | £433,079 | 23% |
74 Properties |
| 2019 | £334,332 | -5% |
84 Properties |
| 2018 | £350,589 | 5% |
117 Properties |
| 2017 | £333,725 | 5% |
116 Properties |
| 2016 | £317,372 | 9% |
139 Properties |
| 2015 | £288,912 | -7% |
96 Properties |
| 2014 | £309,698 | 15% |
109 Properties |
| 2013 | £263,049 | -25% |
63 Properties |
| 2012 | £329,351 | 13% |
60 Properties |
| 2011 | £286,732 | 2% |
67 Properties |
| 2010 | £281,363 | 1% |
75 Properties |
| 2009 | £279,328 | -10% |
60 Properties |
| 2008 | £307,070 | 2% |
64 Properties |
| 2007 | £299,919 | 5% |
101 Properties |
| 2006 | £283,454 | 17% |
119 Properties |
| 2005 | £233,955 | -18% |
190 Properties |
| 2004 | £275,072 | 19% |
105 Properties |
| 2003 | £223,289 | 15% |
83 Properties |
| 2002 | £189,939 | 4% |
162 Properties |
| 2001 | £182,193 | 17% |
106 Properties |
| 2000 | £151,211 | 12% |
88 Properties |
| 1999 | £132,737 | 9% |
102 Properties |
| 1998 | £120,311 | 15% |
82 Properties |
| 1997 | £102,716 | 2% |
133 Properties |
| 1996 | £100,164 | 9% |
90 Properties |
| 1995 | £91,427 | - |
50 Properties |
Property Price per Property Type in Hagley
Here you can find historic sold price data in order to help with your property search.
The average Property Paid Price for specific property types in the last three years are:
| Property Type | Average Sold Price | Sold Properties |
|---|---|---|
| Semi Detached House | £405,938.00 | 57 Semi Detached Houses |
| Detached House | £614,702.00 | 68 Detached Houses |
| Terraced House | £350,707.00 | 22 Terraced Houses |
| Flat | £174,772.00 | 34 Flats |

