
Houses for sale & to rent in DY9 9LN, Clent Drive, Hagley, Stourbridge
House Prices in DY9 9LN, Clent Drive, Hagley
Properties in DY9 9LN have no sales history available within the last 3 years. DY9 9LN is a postcode in Clent Drive located in Hagley, an area in Stourbridge, Worcestershire, with 9 households².
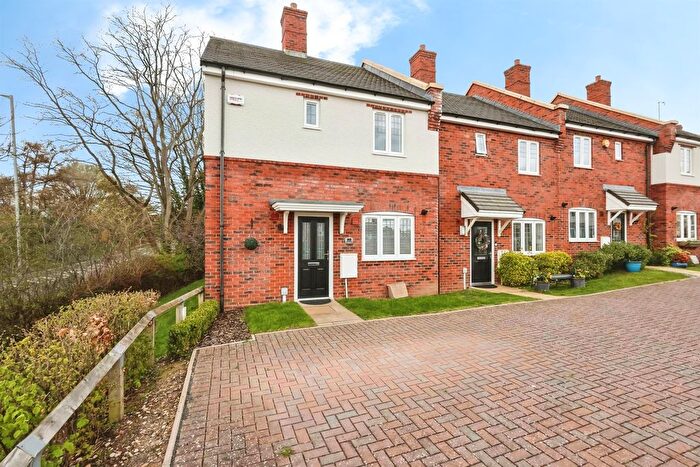
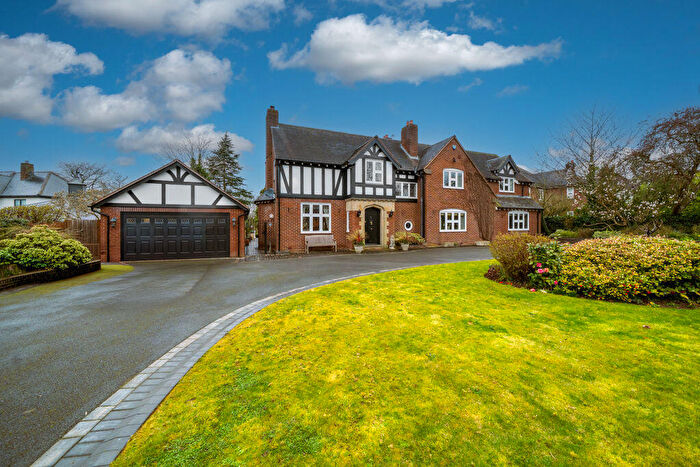
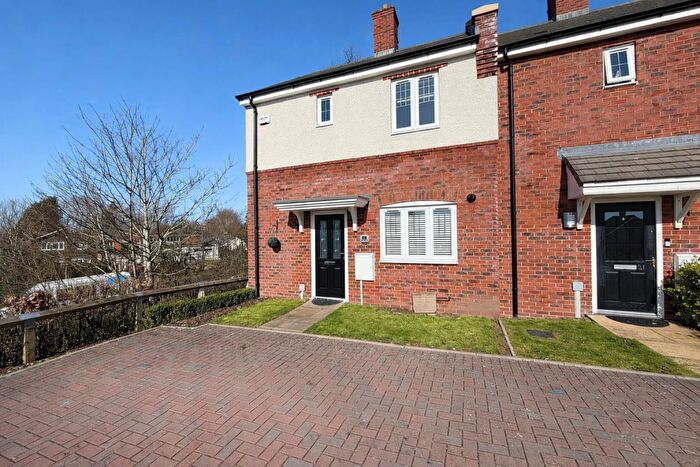
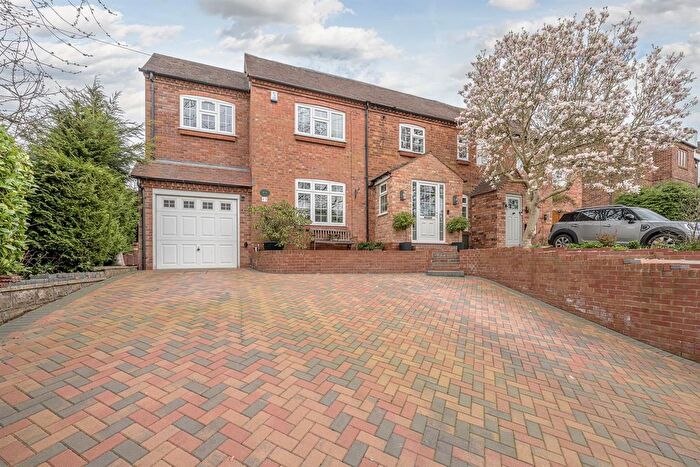
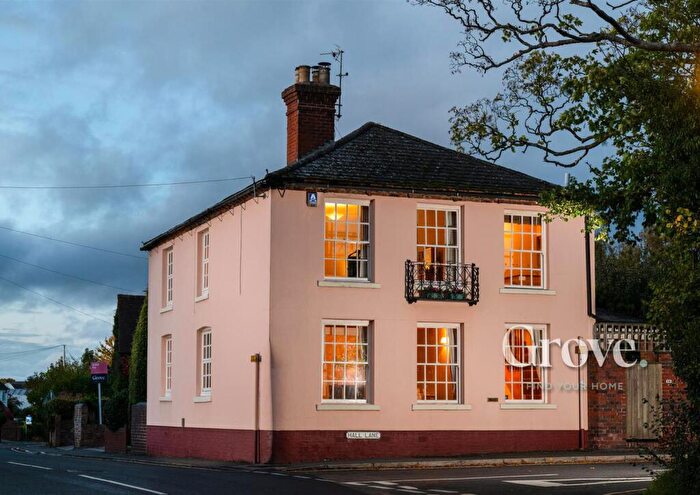
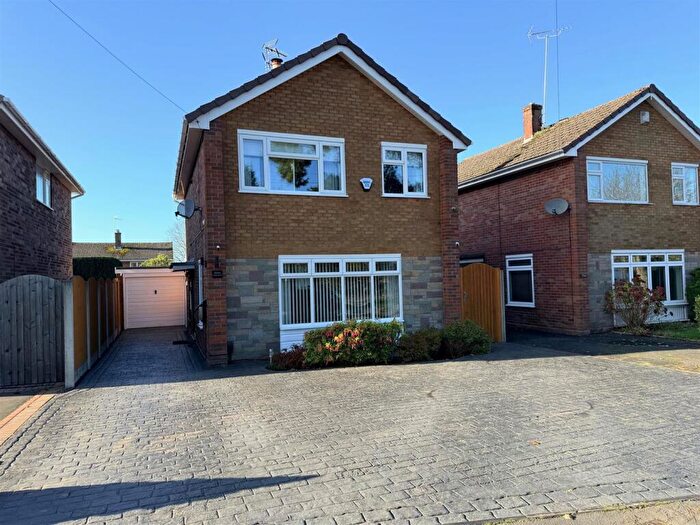
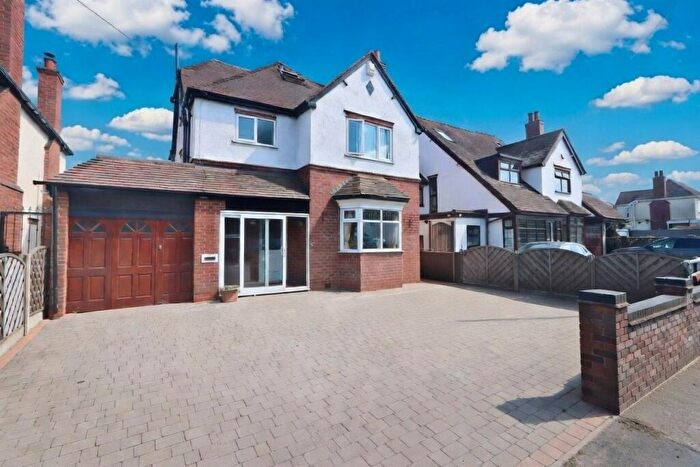
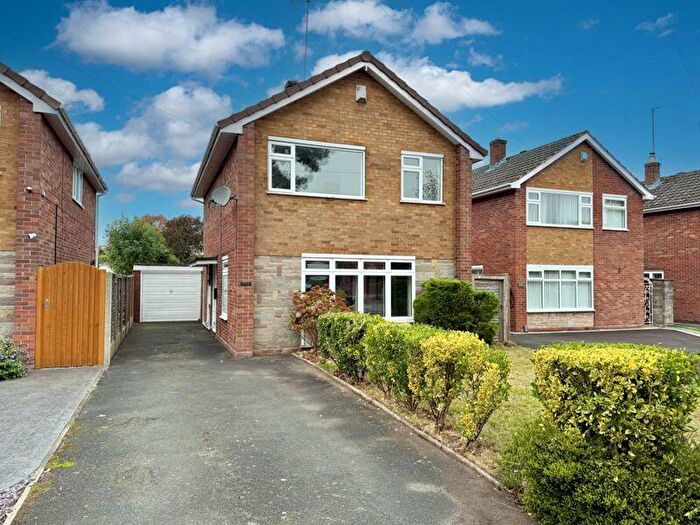
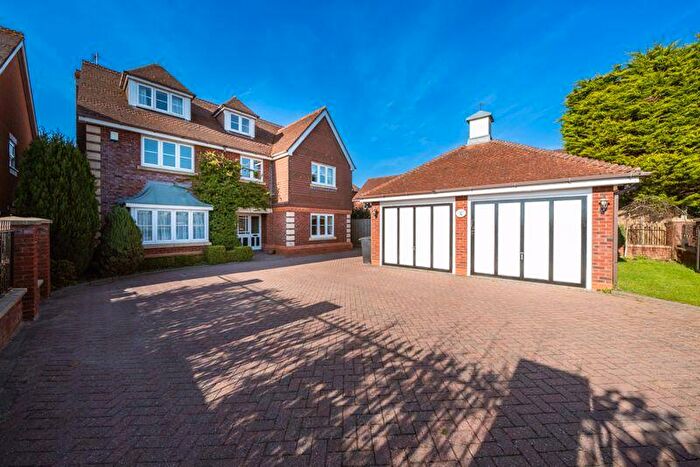
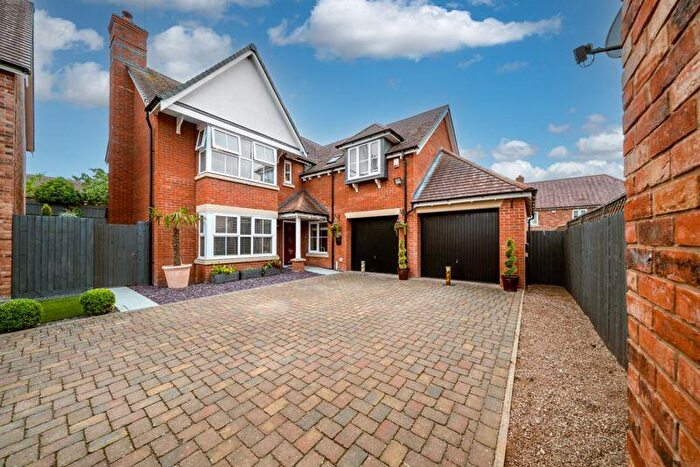
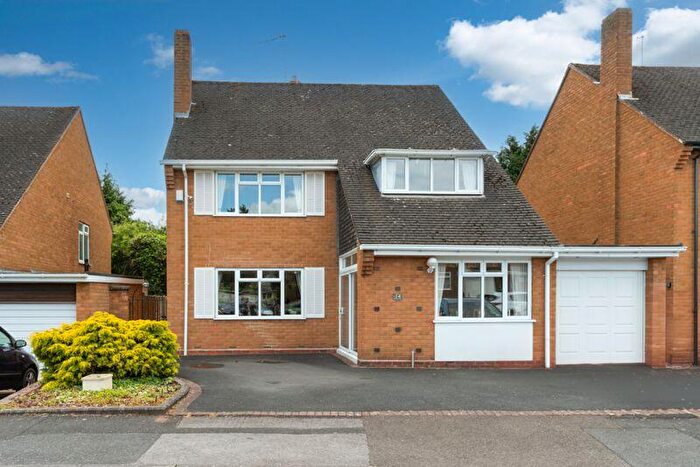
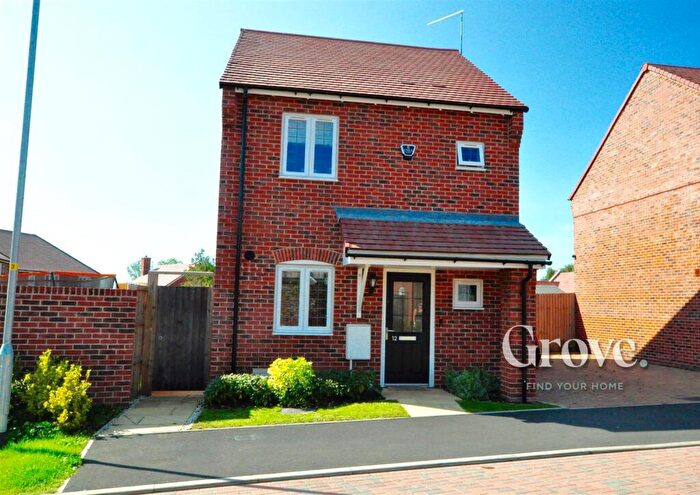
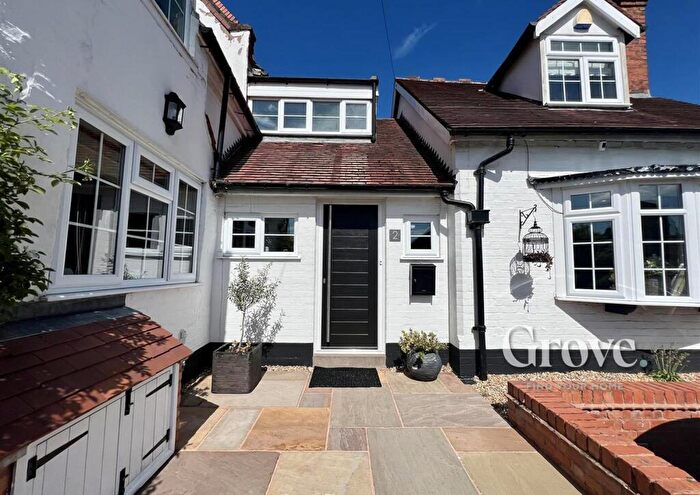
Properties for sale near DY9 9LN, Clent Drive
![]()
If you are looking to sell your house, let it out, or receive a property valuation, an expert can help you.
Click the button below to get started.
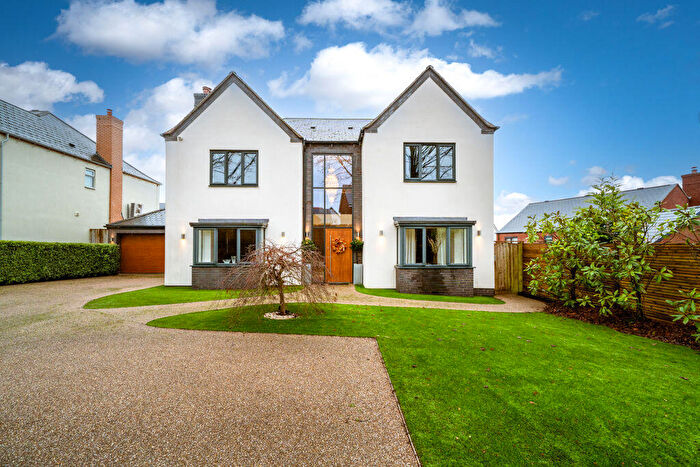
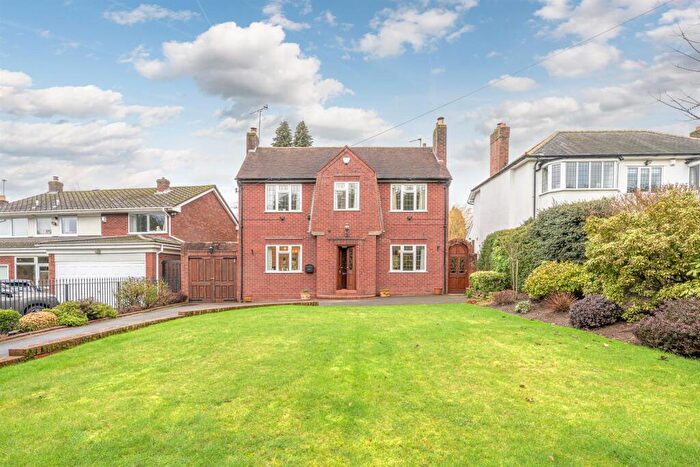
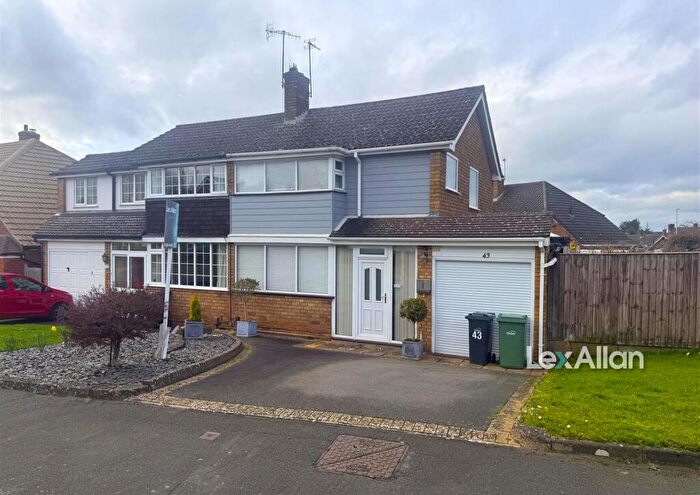
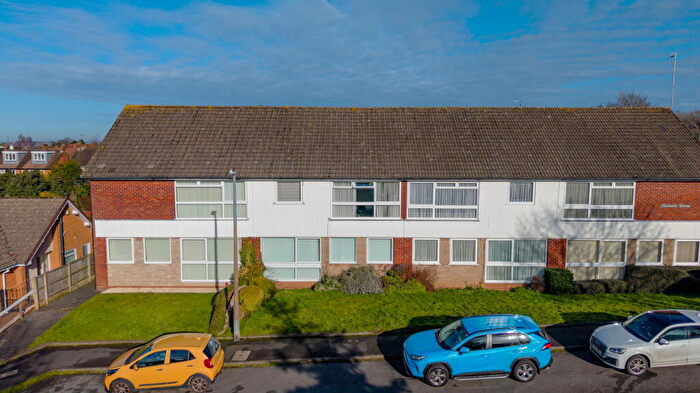
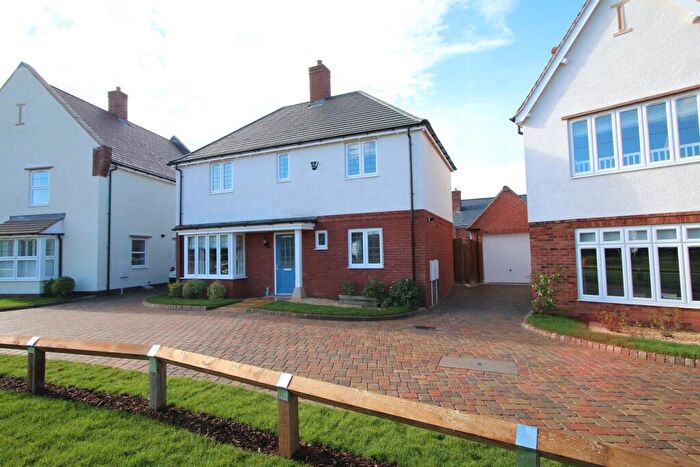
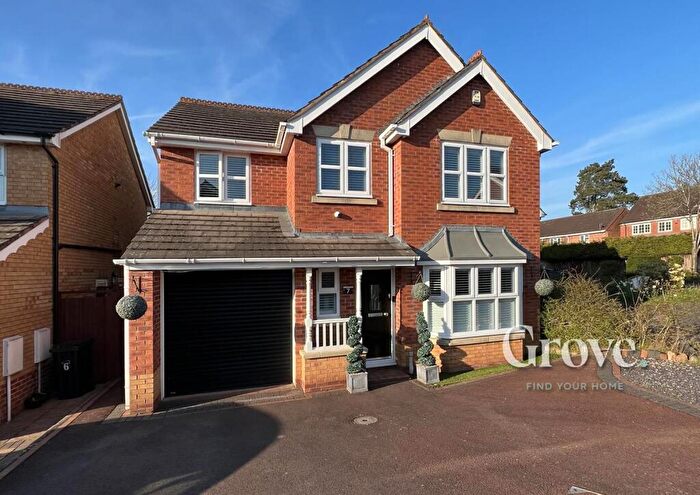
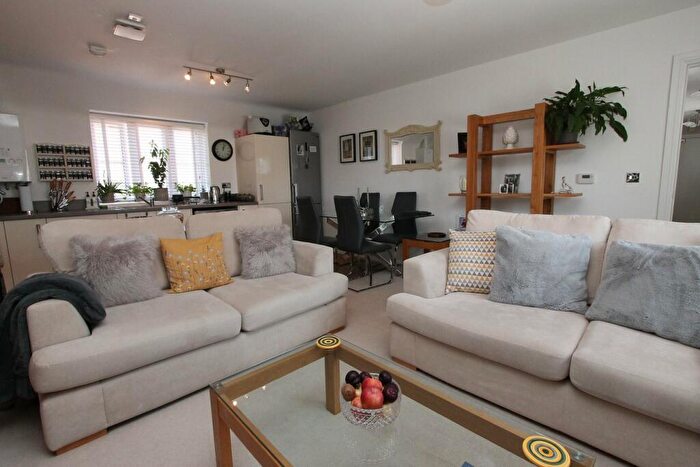
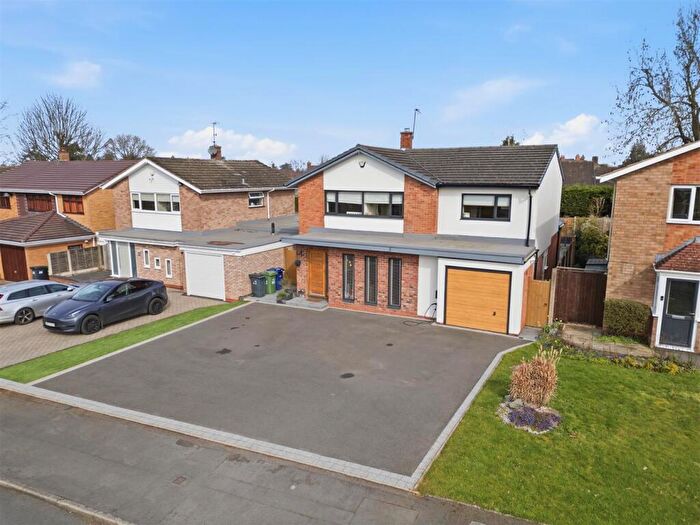
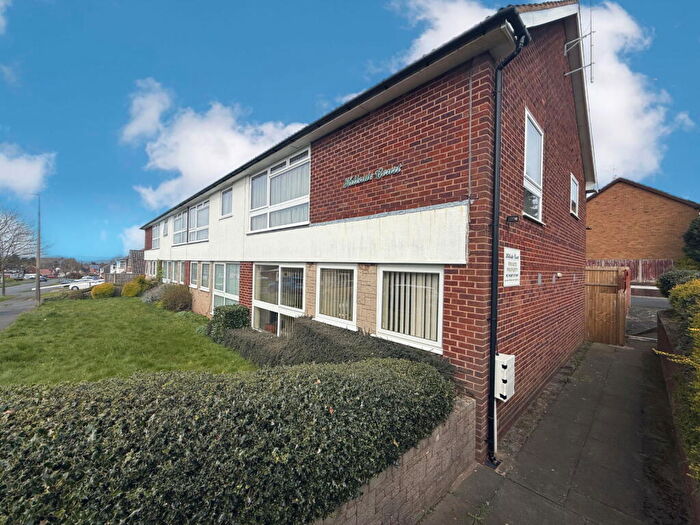
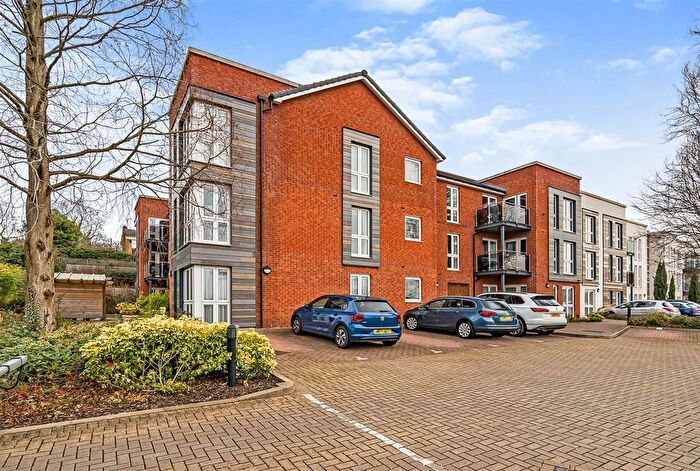
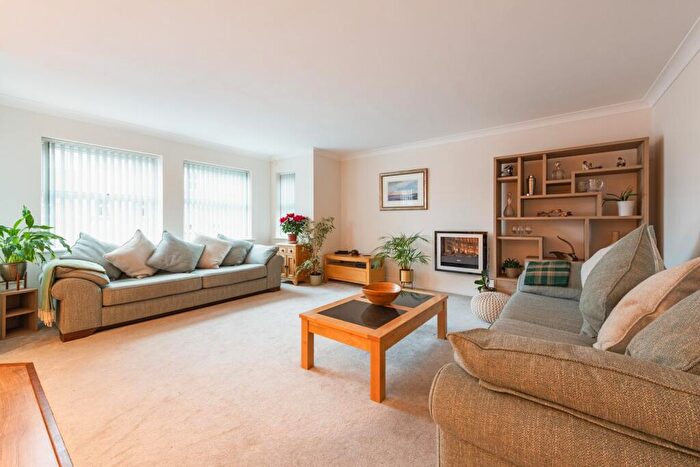
Previously listed properties near DY9 9LN, Clent Drive
Price Paid in Clent Drive, DY9 9LN, Hagley
5 Clent Drive, DY9 9LN, Hagley Stourbridge
Property 5 has been sold 1 time. The last time it was sold was in 31/08/2022 and the sold price was £650,000.00.
This detached house, sold as a freehold on 31/08/2022, is a 175 sqm detached house with an EPC rating of D.
| Date | Price | Property Type | Tenure | Classification |
|---|---|---|---|---|
| 31/08/2022 | £650,000.00 | Detached House | freehold | Established Building |
7 Clent Drive, DY9 9LN, Hagley Stourbridge
Property 7 has been sold 1 time. The last time it was sold was in 24/09/2021 and the sold price was £490,000.00.
This detached house, sold as a freehold on 24/09/2021, is a 164 sqm detached house with an EPC rating of D.
| Date | Price | Property Type | Tenure | Classification |
|---|---|---|---|---|
| 24/09/2021 | £490,000.00 | Detached House | freehold | Established Building |
2 Clent Drive, DY9 9LN, Hagley Stourbridge
Property 2 has been sold 2 times. The last time it was sold was in 19/04/2021 and the sold price was £630,000.00.
This detached house, sold as a freehold on 19/04/2021, is a 180 sqm detached house with an EPC rating of C.
| Date | Price | Property Type | Tenure | Classification |
|---|---|---|---|---|
| 19/04/2021 | £630,000.00 | Detached House | freehold | Established Building |
| 01/12/2015 | £525,000.00 | Detached House | freehold | Established Building |
8 Clent Drive, DY9 9LN, Hagley Stourbridge
Property 8 has been sold 3 times. The last time it was sold was in 17/10/2012 and the sold price was £355,000.00.
This detached house, sold as a freehold on 17/10/2012, is a 155 sqm detached bungalow with an EPC rating of D.
| Date | Price | Property Type | Tenure | Classification |
|---|---|---|---|---|
| 17/10/2012 | £355,000.00 | Detached House | freehold | Established Building |
| 29/06/2012 | £355,000.00 | Detached House | freehold | Established Building |
| 29/03/2001 | £275,000.00 | Detached House | freehold | Established Building |
3 Clent Drive, DY9 9LN, Hagley Stourbridge
Property 3 has been sold 2 times. The last time it was sold was in 04/10/2011 and the sold price was £456,000.00.
This detached house, sold as a freehold on 04/10/2011, is a 166 sqm detached house with an EPC rating of E.
| Date | Price | Property Type | Tenure | Classification |
|---|---|---|---|---|
| 04/10/2011 | £456,000.00 | Detached House | freehold | Established Building |
| 29/03/2000 | £215,000.00 | Detached House | freehold | Established Building |
4 Clent Drive, DY9 9LN, Hagley Stourbridge
Property 4 has been sold 1 time. The last time it was sold was in 09/03/2006 and the sold price was £421,000.00.
This is a Detached House which was sold as a freehold in 09/03/2006
| Date | Price | Property Type | Tenure | Classification |
|---|---|---|---|---|
| 09/03/2006 | £421,000.00 | Detached House | freehold | Established Building |
6 Clent Drive, DY9 9LN, Hagley Stourbridge
Property 6 has been sold 2 times. The last time it was sold was in 11/02/2005 and the sold price was £470,000.00.
This detached house, sold as a freehold on 11/02/2005, is a 180 sqm detached house with an EPC rating of D.
| Date | Price | Property Type | Tenure | Classification |
|---|---|---|---|---|
| 11/02/2005 | £470,000.00 | Detached House | freehold | Established Building |
| 07/06/2002 | £280,000.00 | Detached House | freehold | Established Building |
Transport near DY9 9LN, Clent Drive

House price paid reports for DY9 9LN, Clent Drive
Click on the buttons below to see price paid reports by year or property price:
- Price Paid By Year
Property Price Paid in DY9 9LN, Clent Drive by Year
The average sold property price by year was:
| Year | Average Sold Price | Price Change |
Sold Properties
|
|---|---|---|---|
| 2022 | £650,000 | 14% |
1 Property |
| 2021 | £560,000 | 6% |
2 Properties |
| 2015 | £525,000 | 32% |
1 Property |
| 2012 | £355,000 | -28% |
2 Properties |
| 2011 | £456,000 | 8% |
1 Property |
| 2006 | £421,000 | -12% |
1 Property |
| 2005 | £470,000 | 40% |
1 Property |
| 2002 | £280,000 | 2% |
1 Property |
| 2001 | £275,000 | 22% |
1 Property |
| 2000 | £215,000 | - |
1 Property |