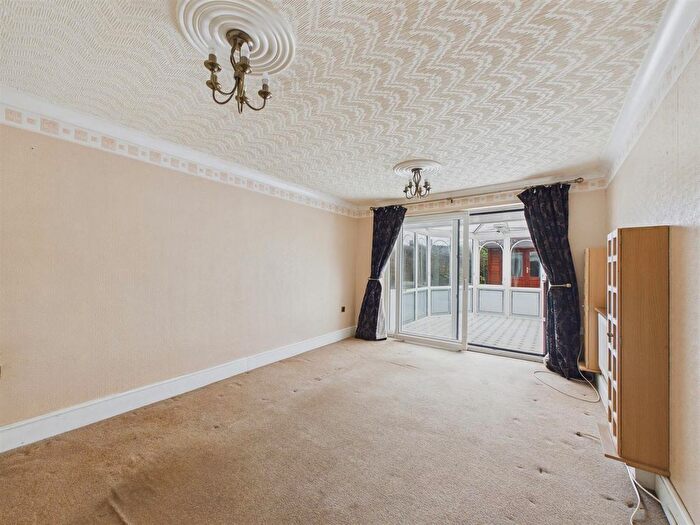
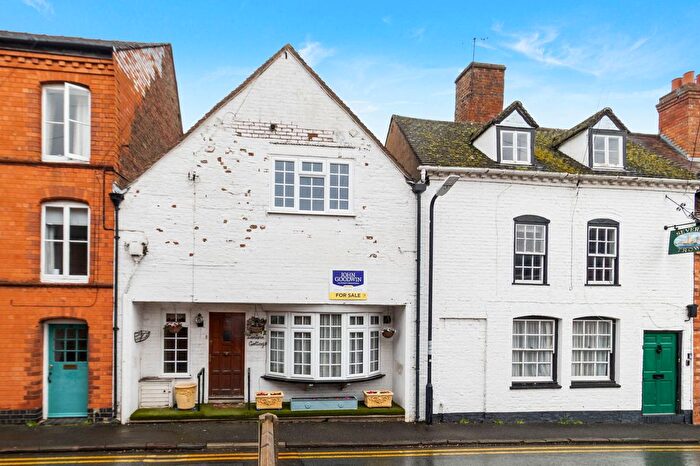
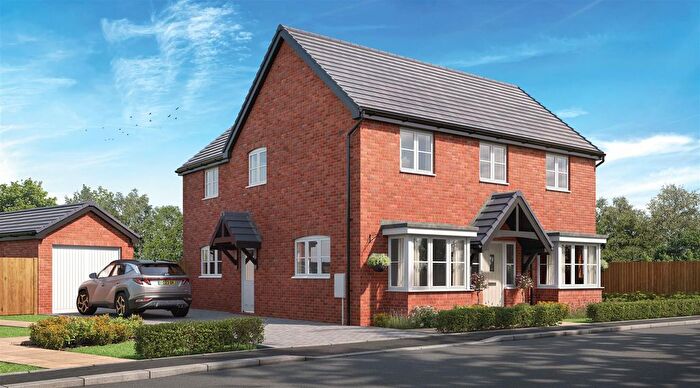
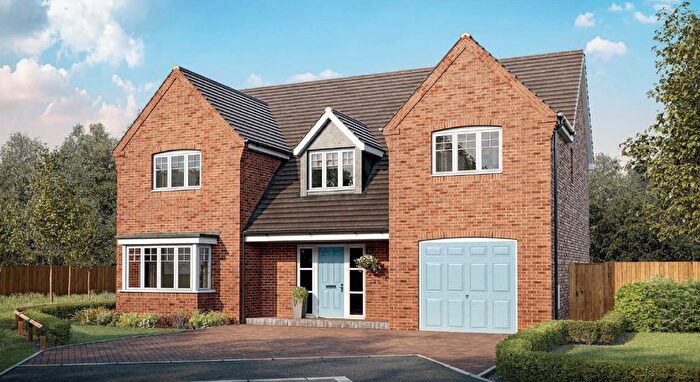
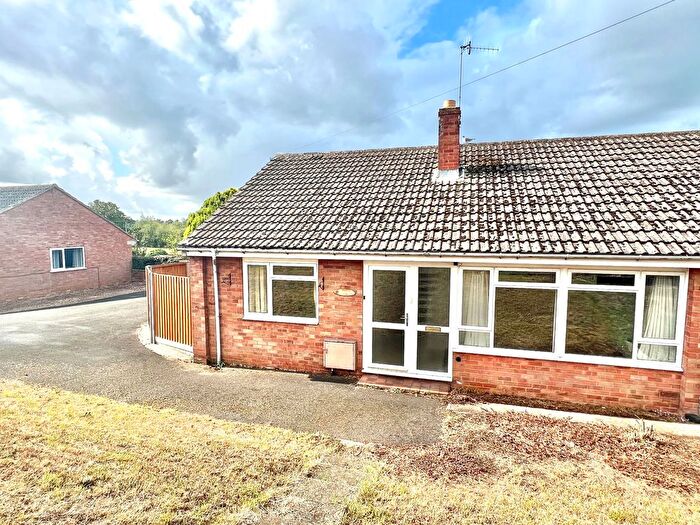
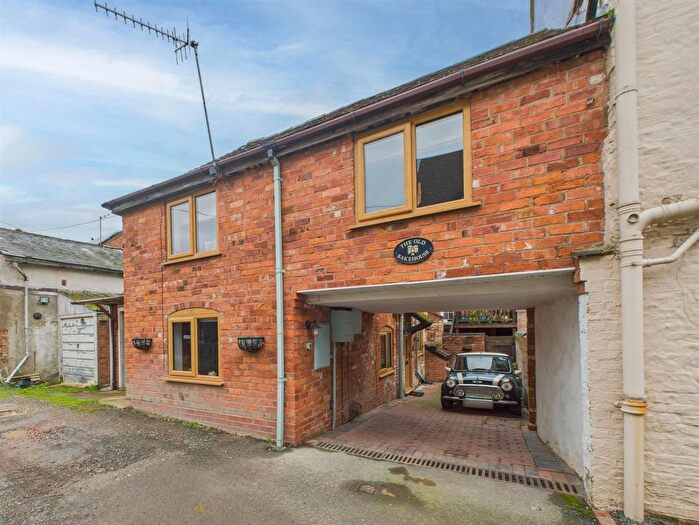
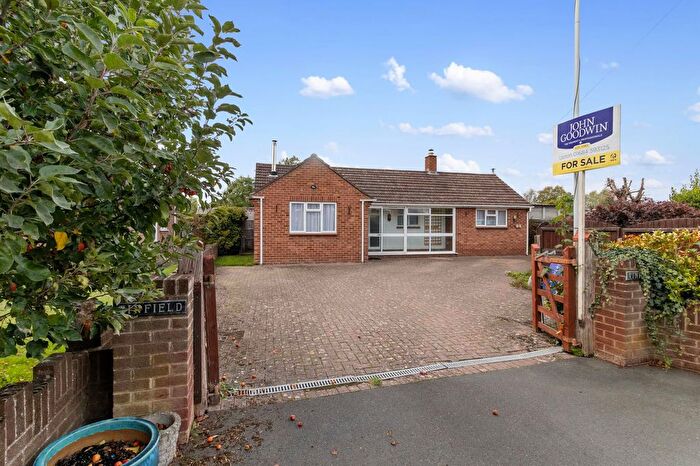
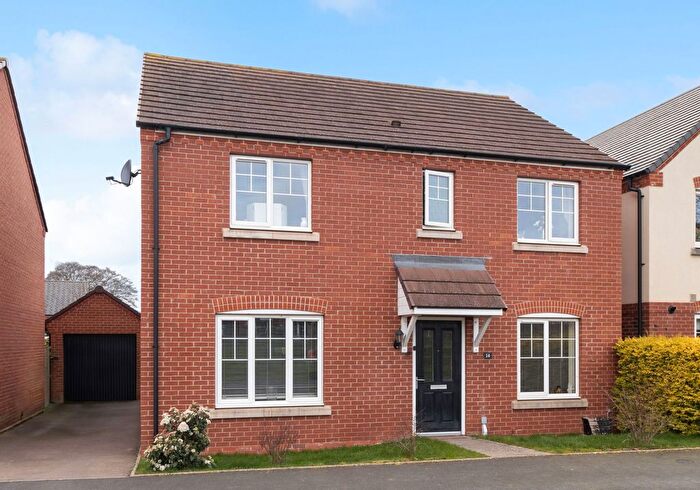
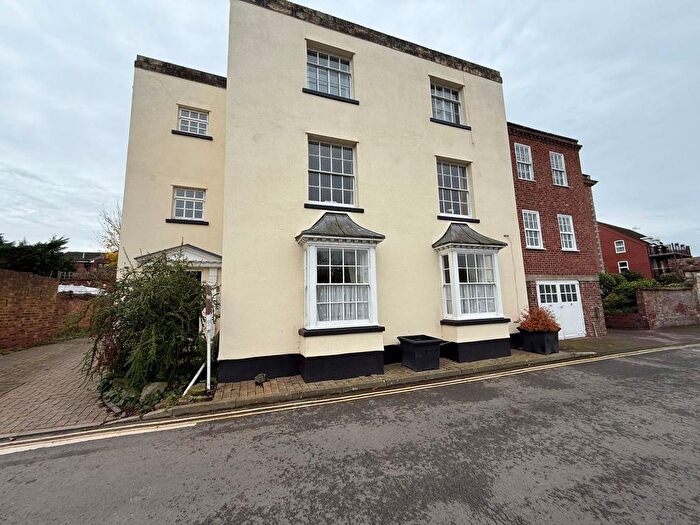
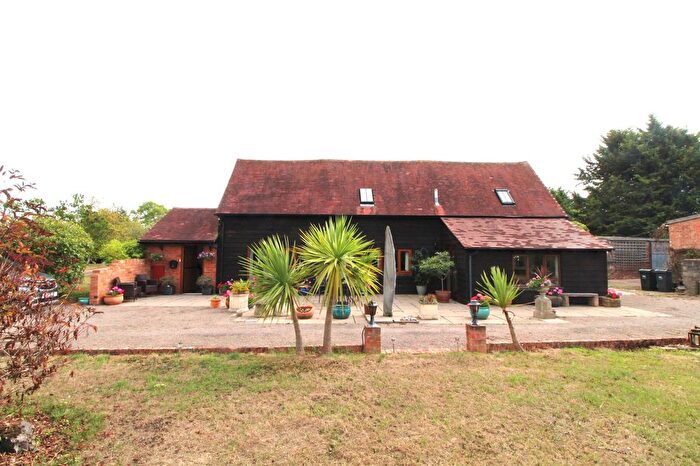
Houses for sale & to rent in Upton And Hanley, Worcester
House Prices in Upton And Hanley
Properties in Upton And Hanley have an average house price of £336,521.00 and had 162 Property Transactions within the last 3 years¹.
Upton And Hanley is an area in Worcester, Worcestershire with 1,946 households², where the most expensive property was sold for £1,150,000.00.
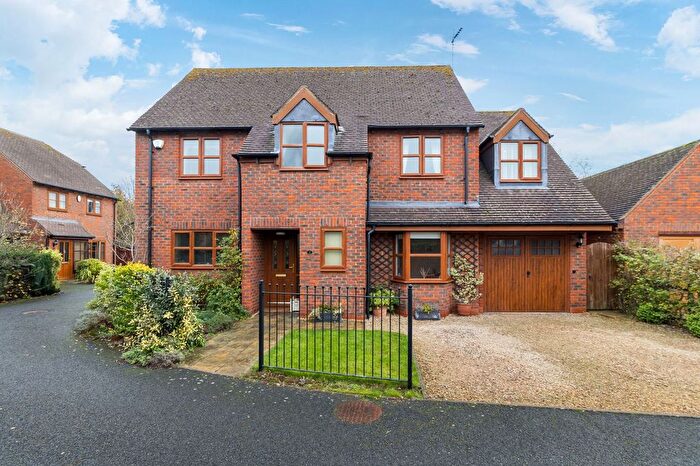
Properties for sale in Upton And Hanley
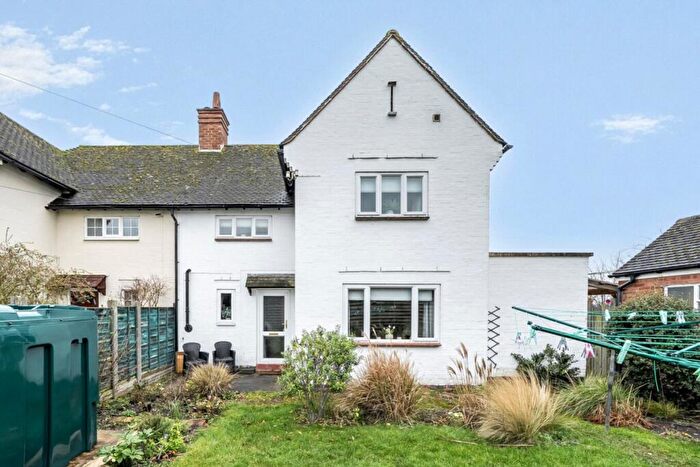
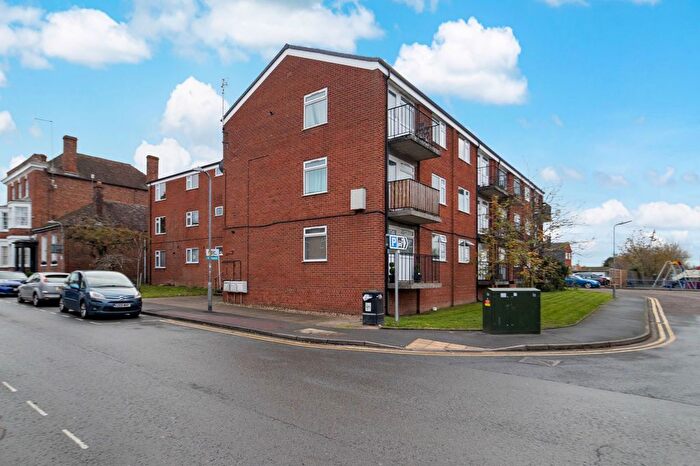
Previously listed properties in Upton And Hanley
Roads and Postcodes in Upton And Hanley
Navigate through our locations to find the location of your next house in Upton And Hanley, Worcester for sale or to rent.
| Streets | Postcodes |
|---|---|
| Apple Tree Gardens | WR8 0DD |
| Backfields | WR8 0JH |
| Backfields Lane | WR8 0NX |
| Bay Tree Close | WR8 0SZ |
| Beckford Grove | WR8 0TD |
| Berrow Court | WR8 0JP |
| Blackmore End | WR8 0EE |
| Blackmore Park | WR8 0EF |
| Bowling Green | WR8 0BP |
| Brinkley Drive | WR8 0BY |
| Brotheridge Green | WR8 0BB WR8 0BD |
| Brotheridge Green Lane | WR8 0AU |
| Brown Square | WR8 0JZ |
| Bury End Lane | WR8 0NJ |
| Causeway Lane | WR8 0NW |
| Charles Orchard | WR8 0NH |
| Cherry Blossom Close | WR8 0AF |
| Cherry Orchard | WR8 0LR |
| Church End | WR8 0BL |
| Church Street | WR8 0HT WR8 0HX |
| Church Walk | WR8 0JF |
| Cottage Row | WR8 0JX |
| Court Street | WR8 0JS WR8 0JT WR8 0NS |
| Coverfields | WR8 0EG |
| Dunns Lane | WR8 0HZ |
| East Waterside | WR8 0PB |
| Field Row | WR8 0JY |
| Firlea | WR8 0JG |
| Furlongs Road | WR8 0NA |
| Gardens Close | WR8 0LT |
| Gardens Walk | WR8 0JE WR8 0JW WR8 0LJ WR8 0LL WR8 0LN |
| Gilberts End | WR8 0AS WR8 0AR |
| Gilberts End Lane | WR8 0BX |
| Gilvers Lane | WR8 0AT |
| Glanford | WR8 0DF |
| Gloucester Road | WR8 0QR WR8 0QY |
| Greenfields | WR8 0SQ |
| Hall Green | WR8 0NQ |
| Ham View | WR8 0QE |
| Hangmans Lane | WR8 0AJ |
| Hanley Mead | WR8 0BJ |
| Hanley Orchard | WR8 0DS |
| Hanley Road | WR8 0HU WR8 0PA |
| Haylers End | WR8 0ED WR8 0AL |
| High Street | WR8 0HB WR8 0HJ WR8 0HQ WR8 0HD WR8 0HF |
| Hillsfield | WR8 0LH |
| Hillview Drive | WR8 0EL |
| Hook Bank | WR8 0AY WR8 0AZ |
| Hook Common | WR8 0AX |
| Hortons Lea | WR8 0DP |
| Hyde Lane | WR8 0SD WR8 0SE |
| Hydefields | WR8 0SF |
| Jasmine Close | WR8 0AW |
| Laburnum Walk | WR8 0LW |
| Lancaster Close | WR8 0LG |
| Lavender Meadow | WR8 0TB |
| Lawnside Close | WR8 0EP |
| Lawson Close | WR8 0RZ |
| Lilac Close | WR8 0TA |
| Lockeridge Lane | WR8 0SP WR8 0RP |
| London Lane | WR8 0HH |
| Longdon Heath | WR8 0QZ WR8 0RL |
| Longfield | WR8 0NR |
| Milestone Road | WR8 0EN |
| Mill Lane | WR8 0BG |
| Minge Lane | WR8 0LS WR8 0NL WR8 0NN |
| Monsell Lane | WR8 0QN WR8 0SL |
| Mulberry Drive | WR8 0ET |
| New Street | WR8 0HP WR8 0HR WR8 0JJ |
| Newbridge Green | WR8 0QP |
| Oak Row | WR8 0JU WR8 0LZ |
| Oak Street | WR8 0JR |
| Oakland Close | WR8 0ES |
| Oakmere Park | WR8 0DZ |
| Old Orchard | WR8 0SH |
| Old Street | WR8 0HA WR8 0HN WR8 0HW WR8 0JQ |
| Packers Hill | WR8 0SG |
| Pepperpot Mews | WR8 0NZ |
| Perrins Field | WR8 0ER |
| Picken End | WR8 0DH WR8 0DQ |
| Prices Lane | WR8 0LY WR8 0LB |
| Priestfields | WR8 0AH |
| Quay Lane | WR8 0BS |
| Queens Mead | WR8 0ND |
| Rectory Road | WR8 0LU WR8 0LX WR8 0NB WR8 0NE WR8 0NG WR8 0NP WR8 0NT WR8 0QG |
| Riverside Close | WR8 0JN |
| Roberts End | WR8 0DL |
| Saffron Grove | WR8 0SY |
| School Lane | WR8 0LA WR8 0LD WR8 0LE WR8 0LQ WR8 0LF |
| Severn Drive | WR8 0JL |
| Shire Gardens | WR8 0SX |
| St Gabriels Terrace | WR8 0DY |
| Stanks Lane | WR8 0QU WR8 0QX |
| Station Road Industrial Estate | WR8 0RX |
| The Graftons | WR8 0NF |
| The Mallards | WR8 0DB |
| The Walnuts | WR8 0DU |
| Tunnel Hill | WR8 0QL |
| Upper Hook Road | WR8 0SB WR8 0SA |
| Upton Gardens | WR8 0NU |
| Vicarage Fields | WR8 0BF |
| Waterside | WR8 0JD WR8 0HG WR8 0HY |
| Welland Court Lane | WR8 0SS |
| Welland Road | WR8 0DA WR8 0SJ WR8 0SN WR8 0SR WR8 0SU WR8 0SW |
| Westmere | WR8 0DG |
| Wheatley Lane | WR8 0QS WR8 0QT |
| William Tennant Way | WR8 0LP |
| Winnington Gardens | WR8 0DJ |
| Worcester Road | WR8 0AB WR8 0EA WR8 0AA WR8 0BE |
| Yewleigh Lane | WR8 0QW |
| WR8 0AQ WR8 0BU WR8 0BW WR8 0DN WR8 0DR WR8 0DW WR8 0DX WR8 0BT WR8 0EH WR8 0WF WR8 0WH WR8 0XB WR8 0XZ WR8 0ZF WR8 0ZJ |
Transport near Upton And Hanley
-
Great Malvern Station
-
Colwall Station
-
Malvern Link Station
-
Ashchurch Station
-
Pershore Station
-
Ledbury Station
-
Worcester Foregate Street Station
-
Worcester Shrub Hill Station
- FAQ
- Price Paid By Year
- Property Type Price
Frequently asked questions about Upton And Hanley
What is the average price for a property for sale in Upton And Hanley?
The average price for a property for sale in Upton And Hanley is £336,521. This amount is 8% higher than the average price in Worcester. There are 513 property listings for sale in Upton And Hanley.
What streets have the most expensive properties for sale in Upton And Hanley?
The streets with the most expensive properties for sale in Upton And Hanley are Newbridge Green at an average of £845,000, Blackmore End at an average of £810,000 and Longdon Heath at an average of £755,000.
What streets have the most affordable properties for sale in Upton And Hanley?
The streets with the most affordable properties for sale in Upton And Hanley are William Tennant Way at an average of £81,000, Backfields at an average of £110,000 and Church Street at an average of £113,500.
Which train stations are available in or near Upton And Hanley?
Some of the train stations available in or near Upton And Hanley are Great Malvern, Colwall and Malvern Link.
Property Price Paid in Upton And Hanley by Year
The average sold property price by year was:
| Year | Average Sold Price | Price Change |
Sold Properties
|
|---|---|---|---|
| 2025 | £326,190 | -4% |
55 Properties |
| 2024 | £338,681 | -2% |
61 Properties |
| 2023 | £346,009 | -7% |
46 Properties |
| 2022 | £371,791 | 15% |
62 Properties |
| 2021 | £316,660 | -8% |
65 Properties |
| 2020 | £340,882 | 6% |
69 Properties |
| 2019 | £321,537 | 8% |
93 Properties |
| 2018 | £295,903 | 9% |
62 Properties |
| 2017 | £269,022 | 2% |
68 Properties |
| 2016 | £264,136 | 9% |
59 Properties |
| 2015 | £241,164 | 1% |
71 Properties |
| 2014 | £239,682 | 8% |
67 Properties |
| 2013 | £219,555 | -7% |
37 Properties |
| 2012 | £234,619 | -6% |
42 Properties |
| 2011 | £247,955 | -7% |
62 Properties |
| 2010 | £265,005 | 7% |
39 Properties |
| 2009 | £245,894 | -3% |
55 Properties |
| 2008 | £253,895 | 4% |
34 Properties |
| 2007 | £243,412 | 4% |
70 Properties |
| 2006 | £233,920 | -7% |
96 Properties |
| 2005 | £249,188 | 15% |
71 Properties |
| 2004 | £212,152 | 26% |
76 Properties |
| 2003 | £158,040 | -8% |
71 Properties |
| 2002 | £171,297 | 24% |
86 Properties |
| 2001 | £129,549 | -10% |
85 Properties |
| 2000 | £142,524 | 35% |
68 Properties |
| 1999 | £92,212 | 4% |
85 Properties |
| 1998 | £88,915 | -2% |
62 Properties |
| 1997 | £90,862 | 18% |
75 Properties |
| 1996 | £74,641 | -7% |
93 Properties |
| 1995 | £79,688 | - |
108 Properties |
Property Price per Property Type in Upton And Hanley
Here you can find historic sold price data in order to help with your property search.
The average Property Paid Price for specific property types in the last three years are:
| Property Type | Average Sold Price | Sold Properties |
|---|---|---|
| Flat | £141,954.00 | 11 Flats |
| Semi Detached House | £293,926.00 | 34 Semi Detached Houses |
| Detached House | £444,060.00 | 75 Detached Houses |
| Terraced House | £229,928.00 | 42 Terraced Houses |

