
Houses for sale & to rent in Fulford, York
House Prices in Fulford
Properties in Fulford have an average house price of £375,748.00 and had 93 Property Transactions within the last 3 years¹.
Fulford is an area in York, York with 1,065 households², where the most expensive property was sold for £1,350,000.00.
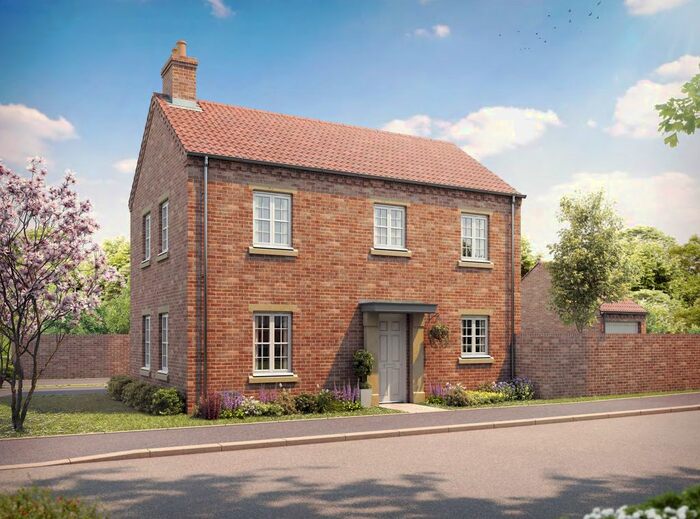
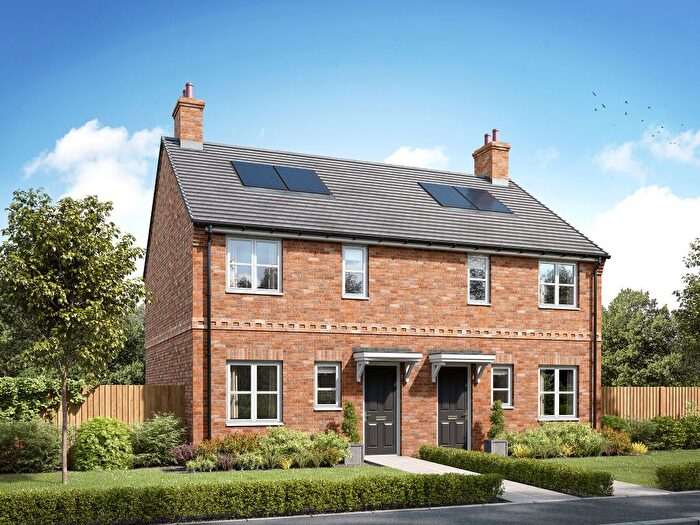
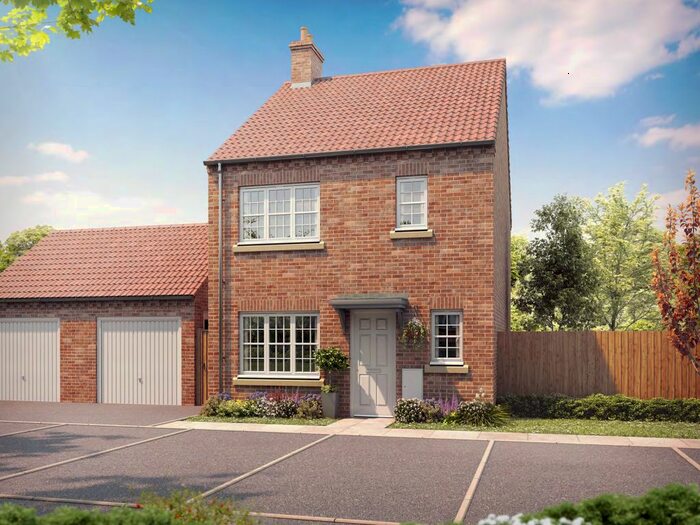
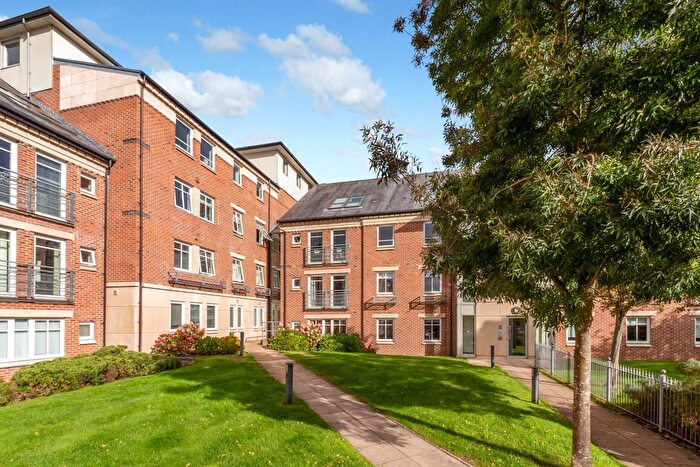
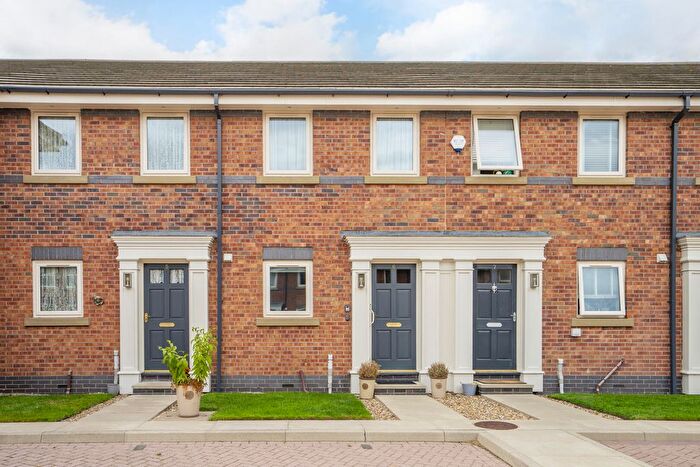
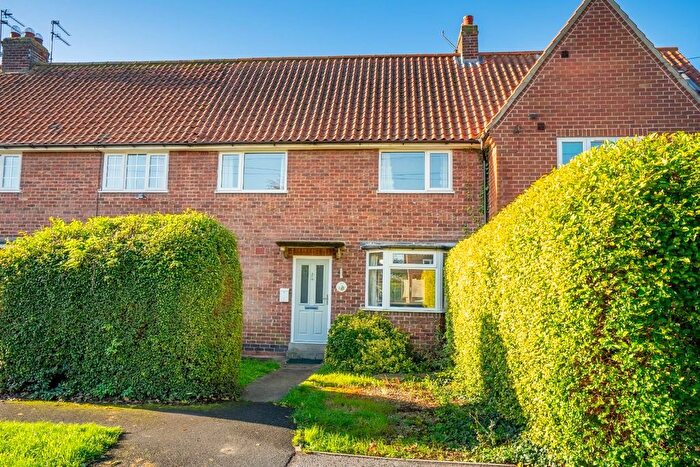
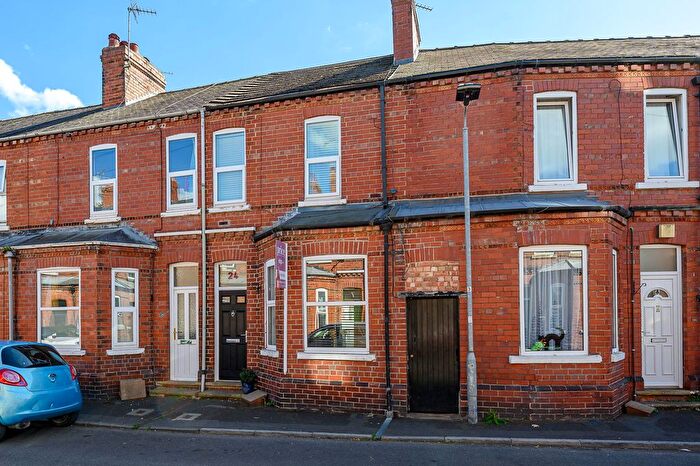
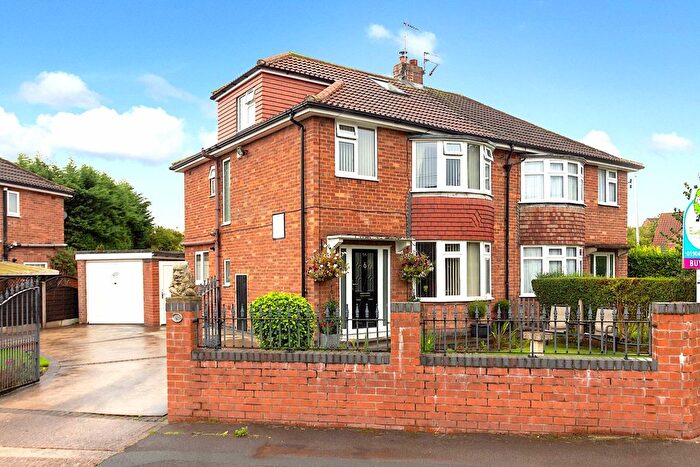
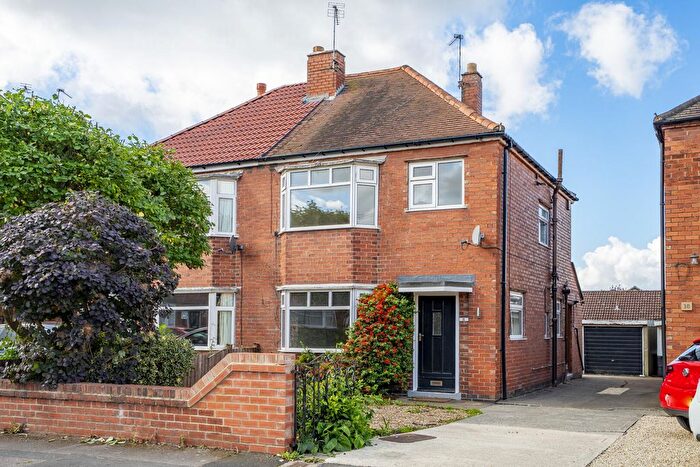
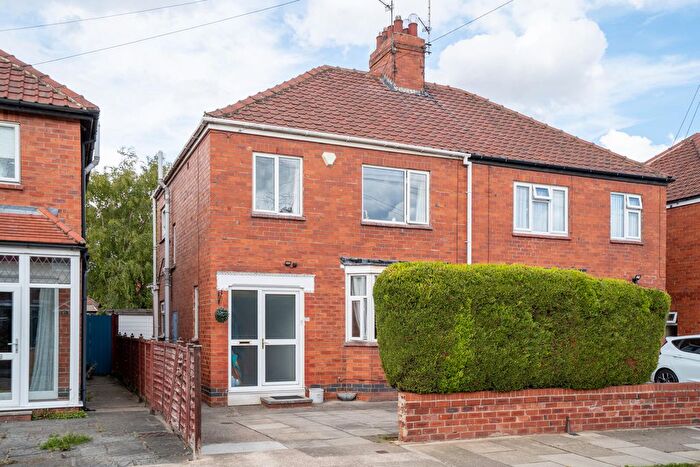
Properties for sale in Fulford
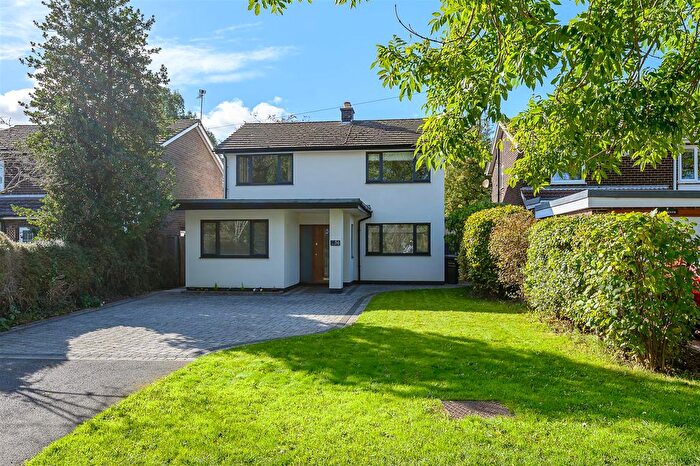
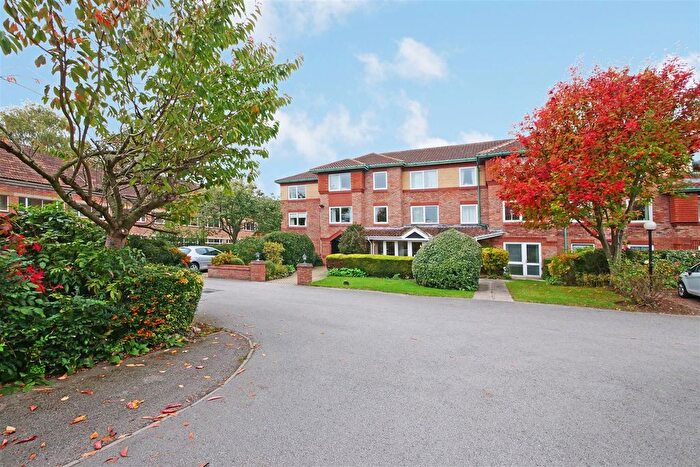
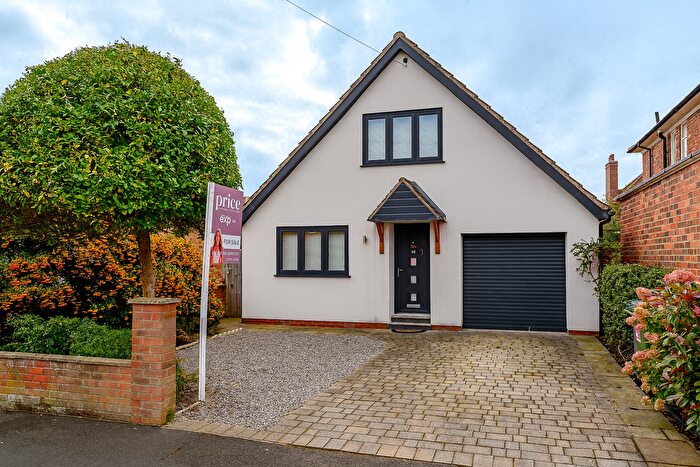
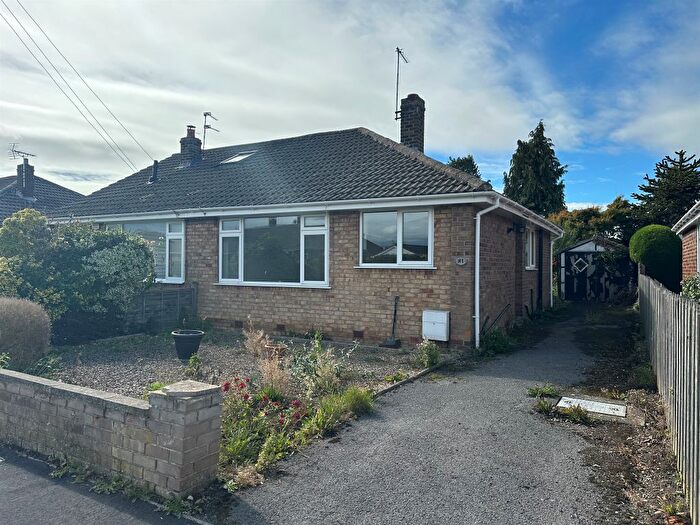
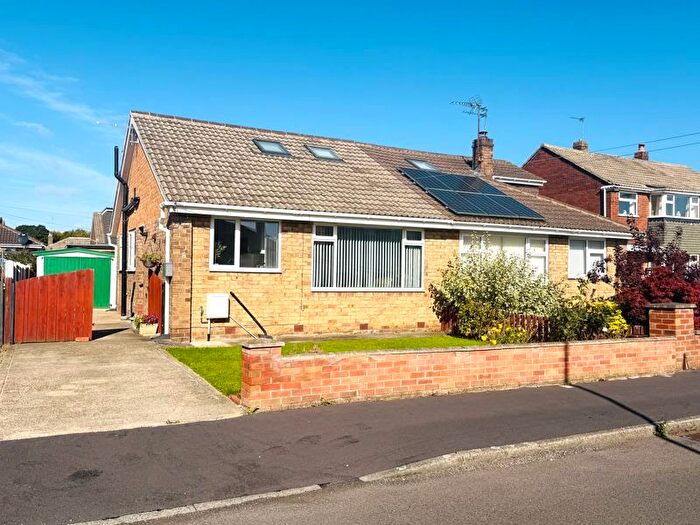
![]()
If you are looking to sell your house, let it out, or receive a property valuation, an expert can help you.
Click the button below to get started.
Roads and Postcodes in Fulford
Navigate through our locations to find the location of your next house in Fulford, York for sale or to rent.
| Streets | Postcodes |
|---|---|
| Atcherley Close | YO10 4QF |
| Cherry Wood Crescent | YO19 4QL YO19 4QN |
| Cross Lane | YO19 4QP |
| Crossfield Crescent | YO19 4QJ |
| Eastward Avenue | YO10 4LZ |
| Eliot Court | YO10 4LP |
| Fenwicks Lane | YO10 4PL |
| Fordlands Crescent | YO19 4QQ |
| Fordlands Road | YO19 4QG YO19 4QR YO19 4QW |
| Fulford Mews | YO10 4QB |
| Fulford Park | YO10 4QE |
| Fulfordgate | YO10 4LY |
| Glen Close | YO10 4PW |
| Heath Croft | YO10 4NJ |
| Heath Moor Drive | YO10 4NE YO10 4NF YO10 4NQ |
| Heslington Croft | YO10 4NB |
| Heslington Lane | YO10 4LR YO10 4LX YO10 4NA YO10 4ND YO10 5ND |
| Ings Flats | YO10 4PY |
| Key Way | YO19 4QS |
| Low Moor Avenue | YO10 4NH |
| Main Street | YO10 4HJ YO10 4PH YO10 4PJ YO10 4PN YO10 4PP YO10 4PQ YO10 4PR YO10 4PS YO10 4PX YO10 4QG |
| Naburn Lane | YO19 4RF YO19 4RG YO19 4RL |
| Pasture Farm Close | YO10 4PZ |
| Pavilion Row | YO10 4LJ |
| Prospect Terrace | YO10 4PT |
| School Lane | YO10 4LS YO10 4LU |
| Selby Road | YO19 4RD |
| St Oswalds Court | YO10 4QH |
| The Old Orchard | YO10 4LT |
| Tilmire Close | YO10 4NG |
| West Moor Flats | YO19 4QH |
Transport near Fulford

- FAQ
- Price Paid By Year
- Property Type Price
Frequently asked questions about Fulford
What is the average price for a property for sale in Fulford?
The average price for a property for sale in Fulford is £375,748. This amount is 10% higher than the average price in York. There are 427 property listings for sale in Fulford.
What streets have the most expensive properties for sale in Fulford?
The streets with the most expensive properties for sale in Fulford are Fulford Park at an average of £740,000, Selby Road at an average of £565,000 and School Lane at an average of £514,000.
What streets have the most affordable properties for sale in Fulford?
The streets with the most affordable properties for sale in Fulford are West Moor Flats at an average of £135,000, Glen Close at an average of £178,750 and Eliot Court at an average of £182,000.
Which train stations are available in or near Fulford?
Some of the train stations available in or near Fulford are York, Poppleton and Ulleskelf.
Property Price Paid in Fulford by Year
The average sold property price by year was:
| Year | Average Sold Price | Price Change |
Sold Properties
|
|---|---|---|---|
| 2025 | £354,143 | -12% |
16 Properties |
| 2024 | £396,327 | 5% |
20 Properties |
| 2023 | £374,750 | 0,1% |
28 Properties |
| 2022 | £374,439 | -1% |
29 Properties |
| 2021 | £378,345 | 23% |
55 Properties |
| 2020 | £291,166 | -5% |
30 Properties |
| 2019 | £306,606 | 9% |
32 Properties |
| 2018 | £279,960 | -2% |
44 Properties |
| 2017 | £284,220 | 4% |
34 Properties |
| 2016 | £272,371 | -10% |
33 Properties |
| 2015 | £299,090 | 16% |
49 Properties |
| 2014 | £251,614 | -20% |
44 Properties |
| 2013 | £302,673 | 20% |
46 Properties |
| 2012 | £240,734 | 25% |
35 Properties |
| 2011 | £180,499 | -24% |
31 Properties |
| 2010 | £224,275 | -16% |
33 Properties |
| 2009 | £260,709 | 13% |
35 Properties |
| 2008 | £227,894 | 4% |
19 Properties |
| 2007 | £219,631 | -14% |
52 Properties |
| 2006 | £251,180 | -6% |
55 Properties |
| 2005 | £265,186 | 25% |
29 Properties |
| 2004 | £198,383 | -4% |
46 Properties |
| 2003 | £207,180 | 28% |
38 Properties |
| 2002 | £148,710 | 17% |
55 Properties |
| 2001 | £123,109 | 28% |
69 Properties |
| 2000 | £88,637 | 13% |
59 Properties |
| 1999 | £77,220 | 1% |
51 Properties |
| 1998 | £76,127 | -1% |
47 Properties |
| 1997 | £76,789 | 2% |
34 Properties |
| 1996 | £75,429 | -4% |
44 Properties |
| 1995 | £78,727 | - |
41 Properties |
Property Price per Property Type in Fulford
Here you can find historic sold price data in order to help with your property search.
The average Property Paid Price for specific property types in the last three years are:
| Property Type | Average Sold Price | Sold Properties |
|---|---|---|
| Semi Detached House | £350,626.00 | 36 Semi Detached Houses |
| Detached House | £605,058.00 | 17 Detached Houses |
| Terraced House | £369,093.00 | 22 Terraced Houses |
| Flat | £217,555.00 | 18 Flats |