
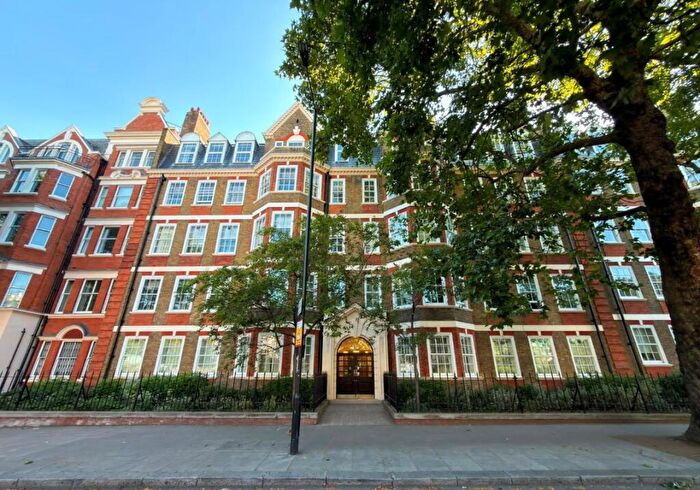
Properties for sale in W2
Paddington, Bayswater, Hyde Park, Westbourne Green, Little Venice, Notting Hill
- Info
- Price Paid By Year
- Property Type Price
- Transport
House Prices in W2
Properties in W2 have an average house price of £1,656,264.00 and had 1656 Property Transactions within the last 3 years.
The most expensive property was sold for £44,750,000.00.
Property Price Paid in W2 by Year
The average sold property price by year was:
| Year | Average Sold Price | Sold Properties |
|---|---|---|
| 2026 | £954,013.00 | 36 Properties |
| 2025 | £1,362,371.00 | 444 Properties |
| 2024 | £1,550,439.00 | 581 Properties |
| 2023 | £2,021,395.00 | 595 Properties |
| 2022 | £1,413,208.00 | 740 Properties |
| 2021 | £1,367,722.00 | 937 Properties |
| 2020 | £1,456,361.00 | 532 Properties |
| 2019 | £1,292,441.00 | 569 Properties |
| 2018 | £1,362,894.00 | 556 Properties |
| 2017 | £1,360,618.00 | 671 Properties |
| 2016 | £1,241,528.00 | 732 Properties |
| 2015 | £1,312,051.00 | 746 Properties |
| 2014 | £1,224,014.00 | 1,028 Properties |
| 2013 | £1,010,863.00 | 798 Properties |
| 2012 | £963,836.00 | 746 Properties |
| 2011 | £890,774.00 | 800 Properties |
| 2010 | £795,023.00 | 864 Properties |
| 2009 | £674,569.00 | 702 Properties |
| 2008 | £720,189.00 | 676 Properties |
| 2007 | £631,697.00 | 1,472 Properties |
| 2006 | £530,081.00 | 1,511 Properties |
| 2005 | £456,810.00 | 1,144 Properties |
| 2004 | £467,809.00 | 1,356 Properties |
| 2003 | £417,605.00 | 1,475 Properties |
| 2002 | £379,234.00 | 1,604 Properties |
| 2001 | £347,214.00 | 1,387 Properties |
| 2000 | £309,538.00 | 1,489 Properties |
| 1999 | £279,178.00 | 1,486 Properties |
| 1998 | £228,510.00 | 1,248 Properties |
| 1997 | £204,459.00 | 1,416 Properties |
| 1996 | £171,139.00 | 1,258 Properties |
| 1995 | £163,333.00 | 995 Properties |
Property Price per Property Type in W2
Here you can find historic sold price data in order to help with your property search.
The average Property Paid Price for specific property types in the last three years are:
| Property Type | Average Sold Price | Sold Properties |
|---|---|---|
| Semi Detached House | £6,525,000.00 | 21 Semi Detached Houses |
| Detached House | £16,078,979.00 | 8 Detached Houses |
| Terraced House | £3,123,097.00 | 181 Terraced Houses |
| Flat | £1,322,155.00 | 1,446 Flats |


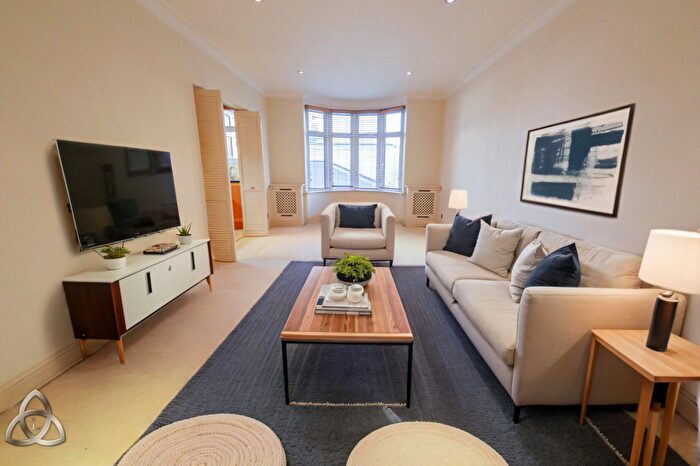
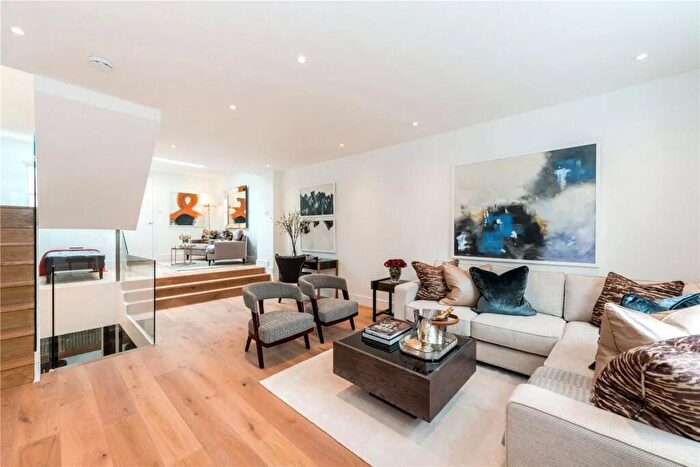
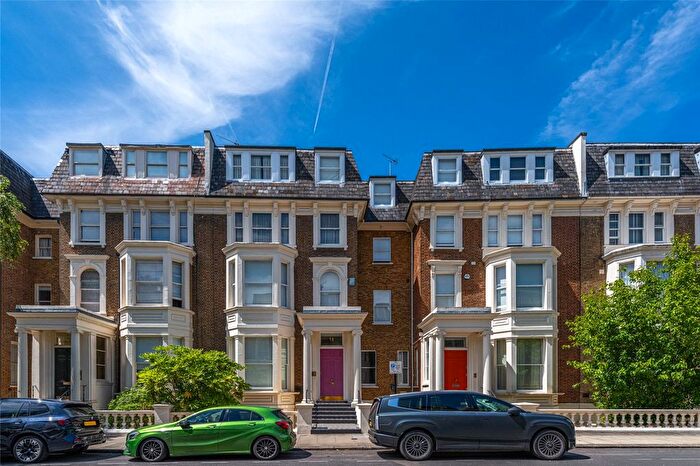
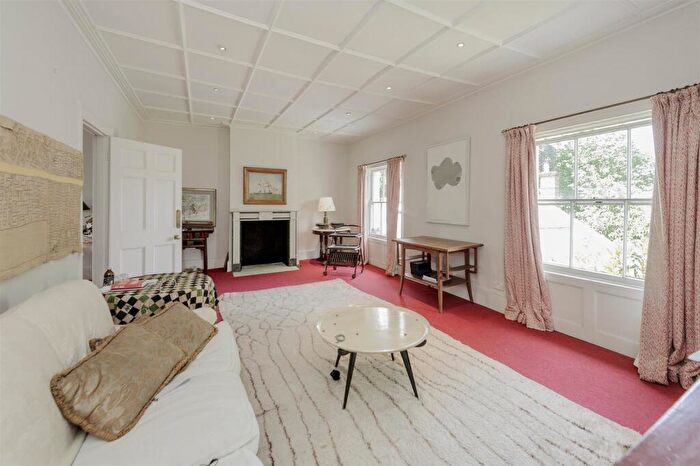
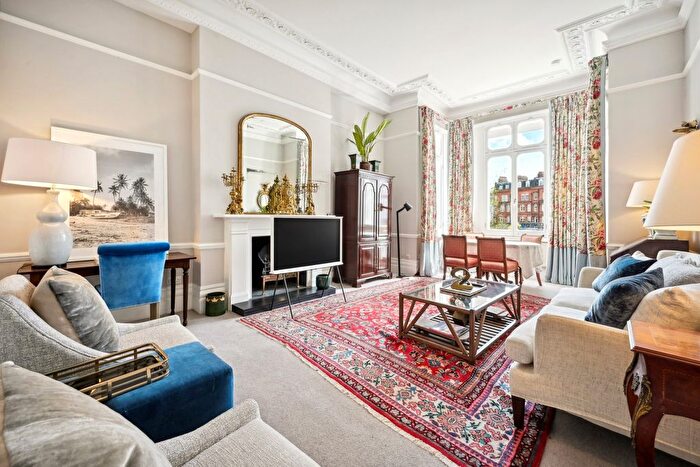
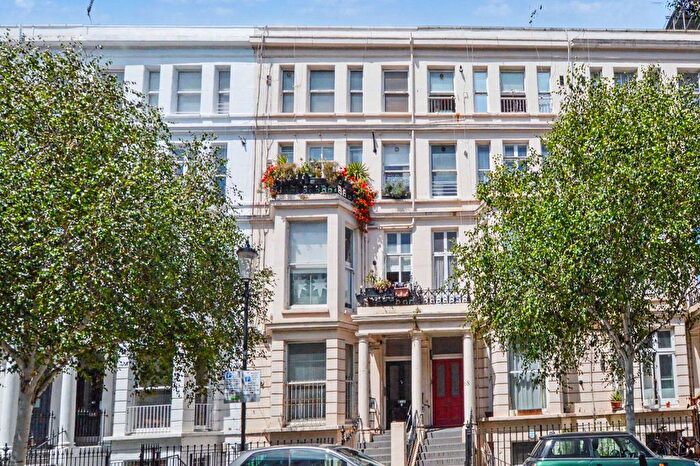
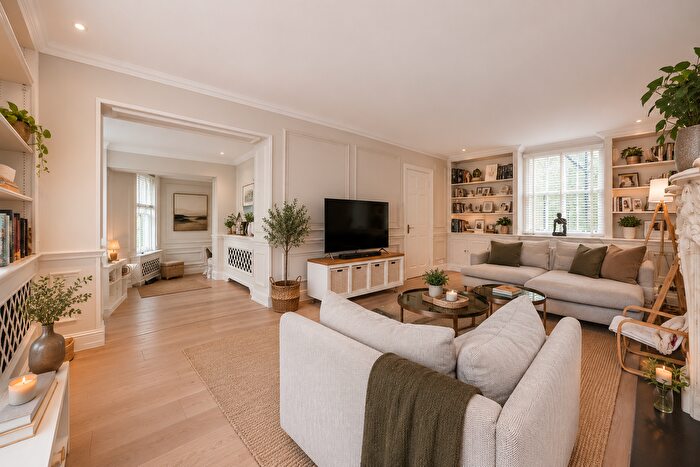
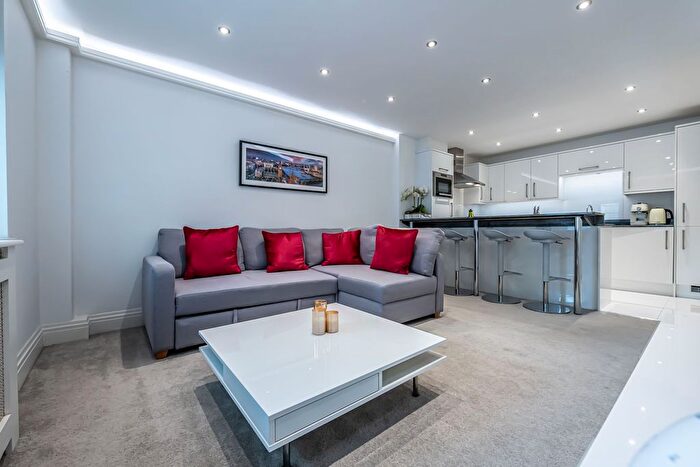
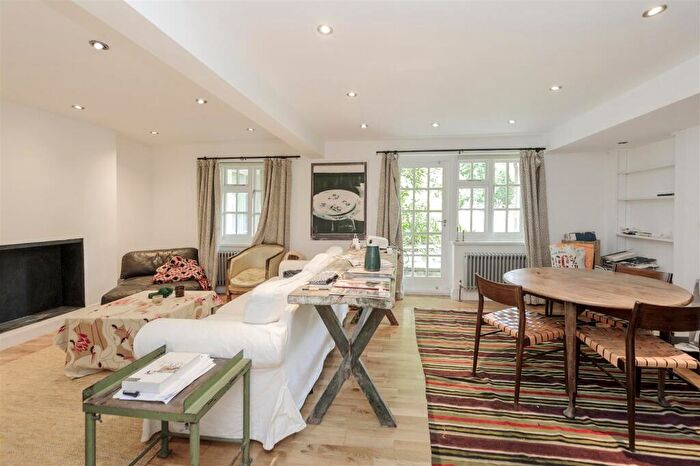
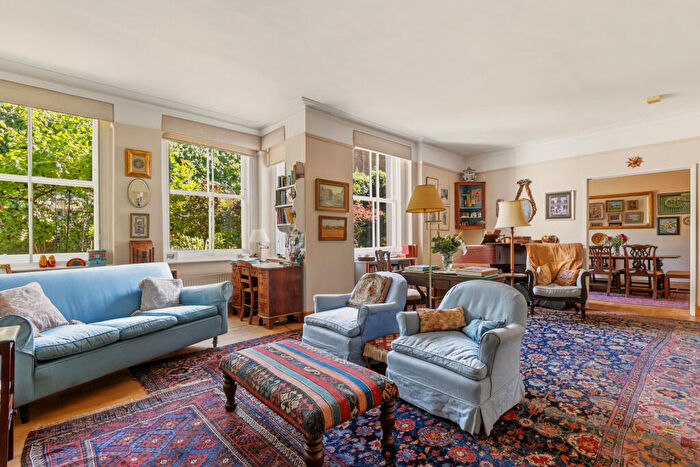
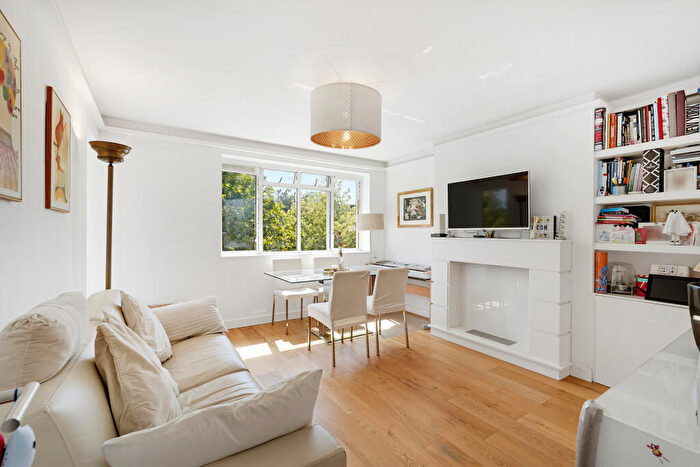
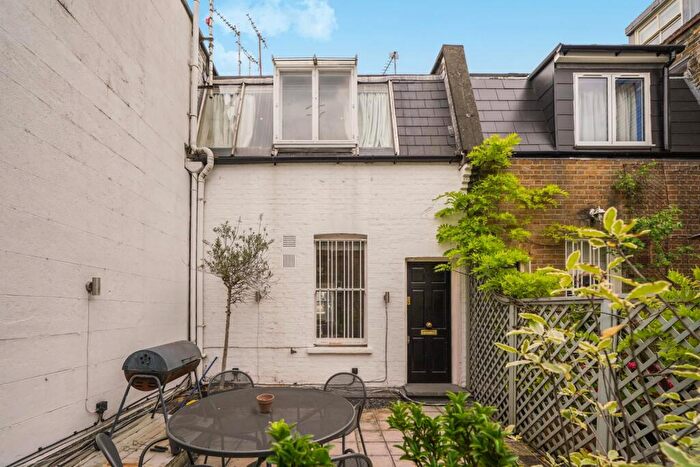
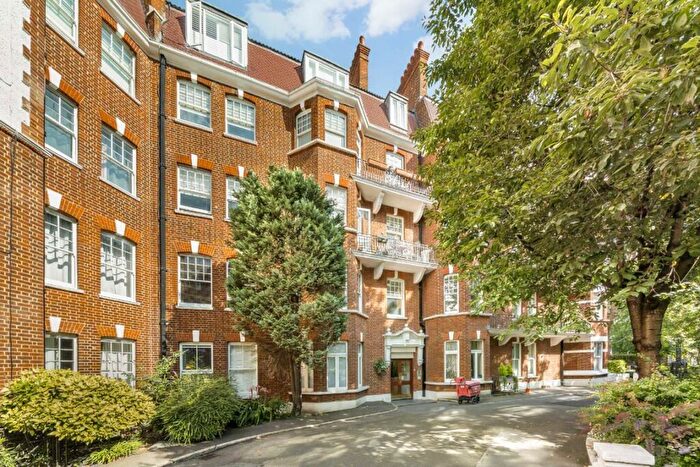
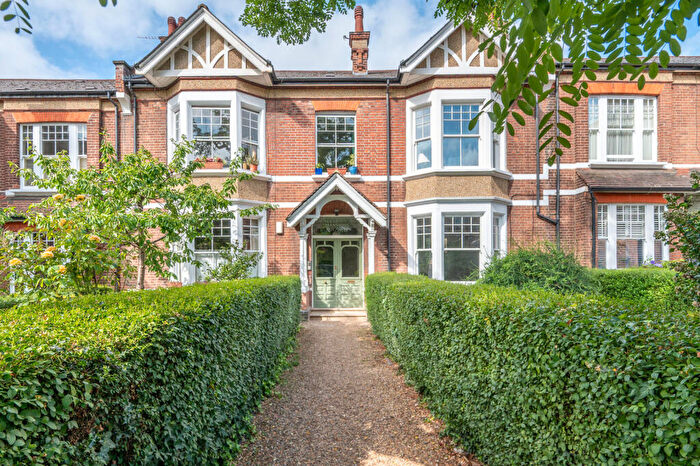
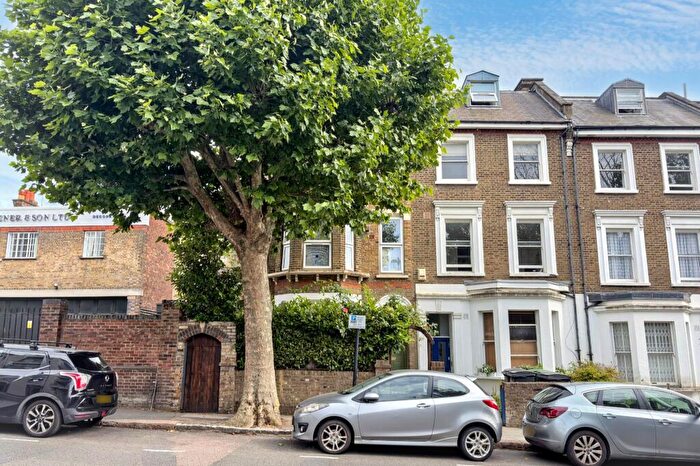
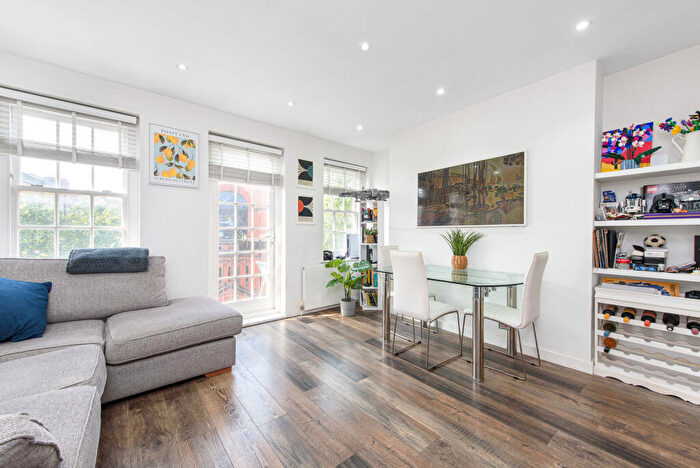
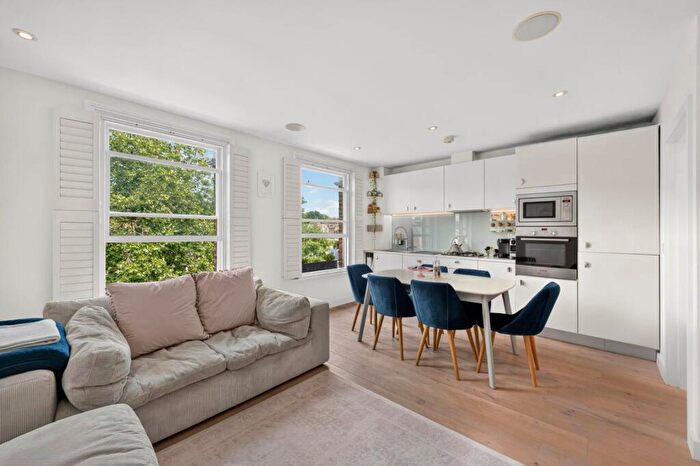
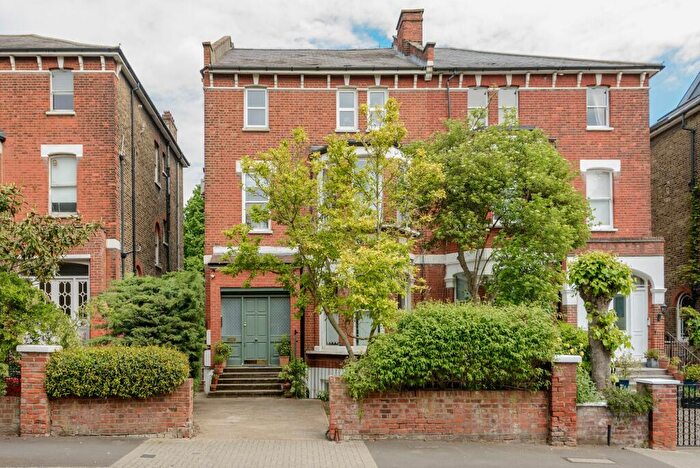
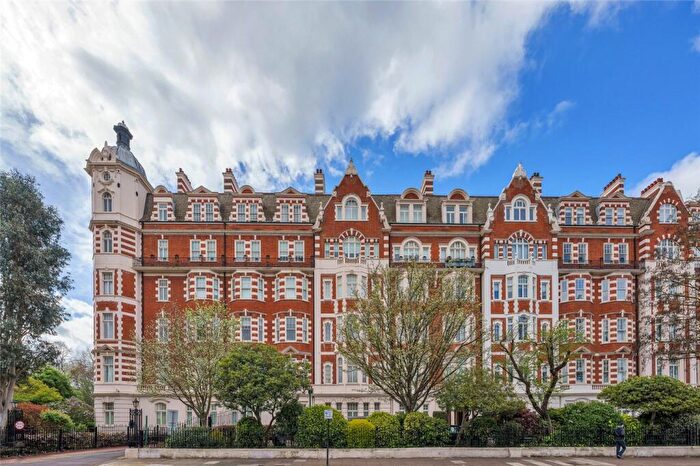
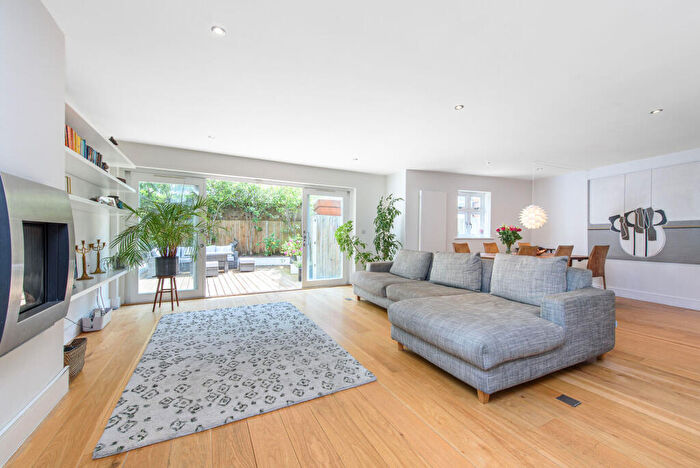
Properties for sale near W2
There are 1,635 results for W2, Paddington, Bayswater, Hyde Park, Westbourne Green. Property prices near W2 range from £389k to £4.95M with an average price of £1.14M.
![]()
If you are looking to sell your house, let it out, or receive a property valuation, an expert can help you.
Click the button below to get started.
Frequently Asked Questions about W2
What is the average price for a property for sale in W2?
The average price for a property for sale in W2 is £1,656,264.
Which areas are included in the W2 postcode district?
The main areas within W2 include Paddington, Bayswater, Hyde Park, Westbourne Green, Little Venice, Westbourne Green and Notting Hill.
What are the most common property types in W2?
The most common property types in W2 are Flats, Terraced Houses, Semi Detached Houses and Detached Houses.
What has been the average sold property price in W2 over the last three years?
Flats in W2 have an average sold price of £1,322,155, while Terraced Houses have an average of £3,123,097. Semi Detached Houses have an average of £6,525,000 and Detached Houses have an average of £16,078,979. The average sold property price in W2 over the last three years is approximately £1,288,941.
Which train stations are available in W2?
The train station available in W2 is Paddington Station..
Which tube stations are available in W2?
The tube stations available in W2 are Bayswater Station, Edgware Road (Bakerloo) Station, Lancaster Gate Station, Queensway Station and Royal Oak Station.