Houses for sale & to rent in Banchory and Mid Deeside, Aboyne
House Prices in Banchory and Mid Deeside
Properties in Banchory and Mid Deeside have an average house price of £453,333.00 and had 3 Property Transactions within the last 3 years¹.
Banchory and Mid Deeside is an area in Aboyne, Aberdeenshire with 317 households², where the most expensive property was sold for £480,000.00.
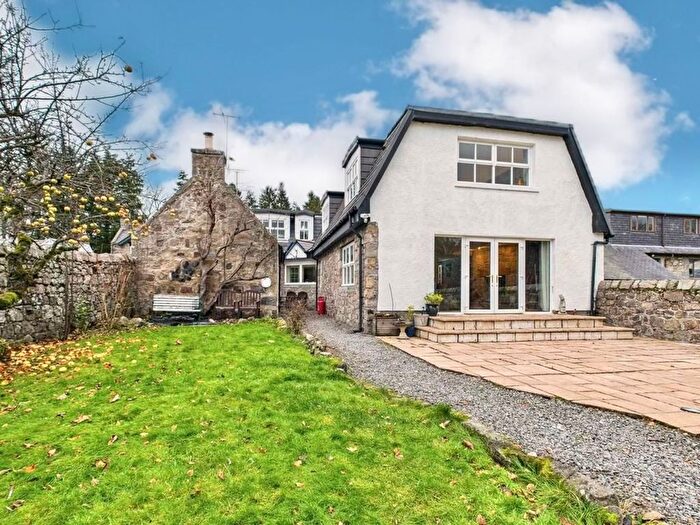
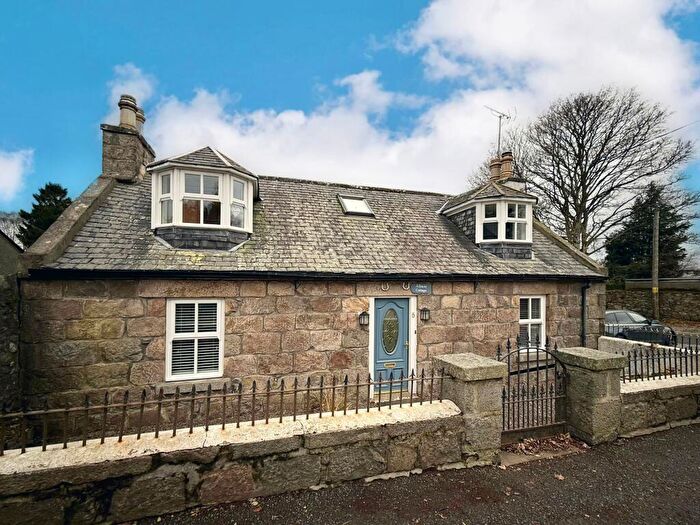
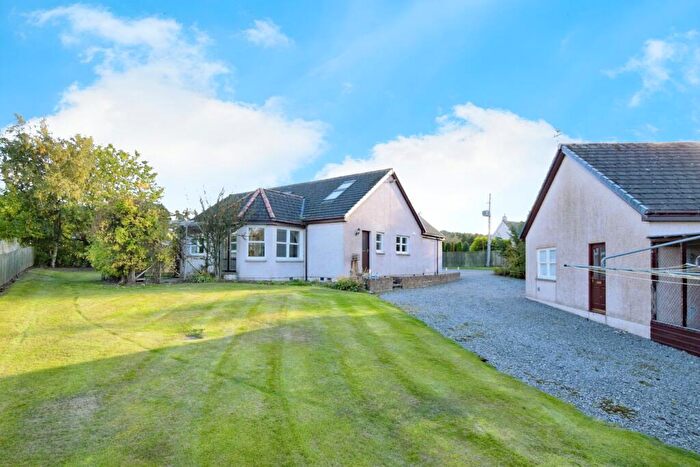
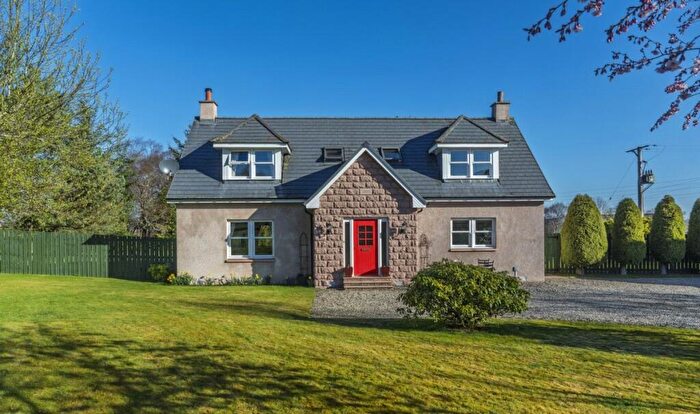
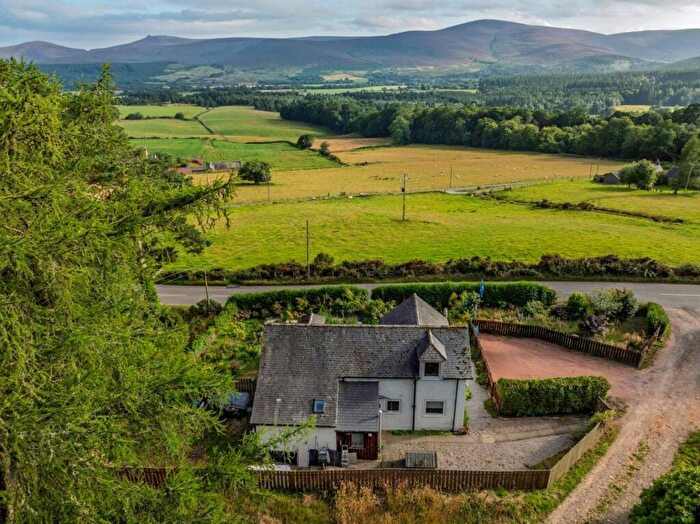
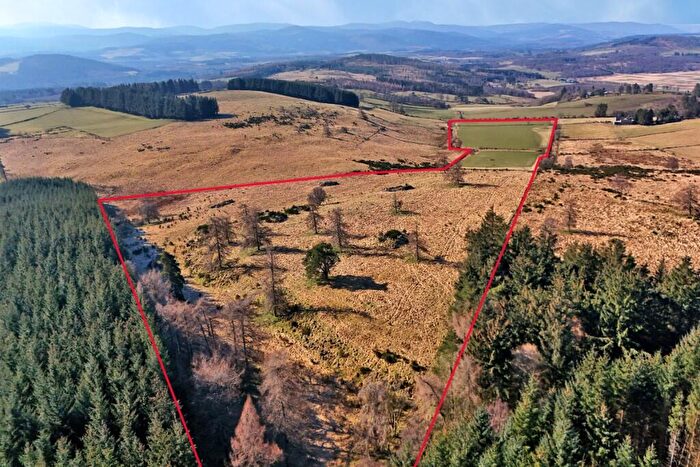
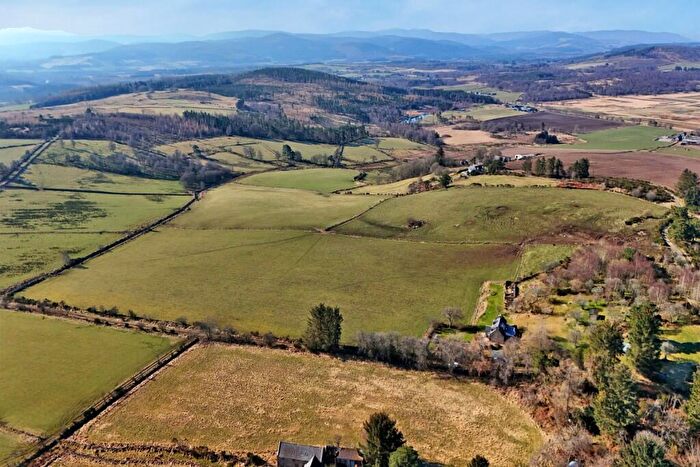
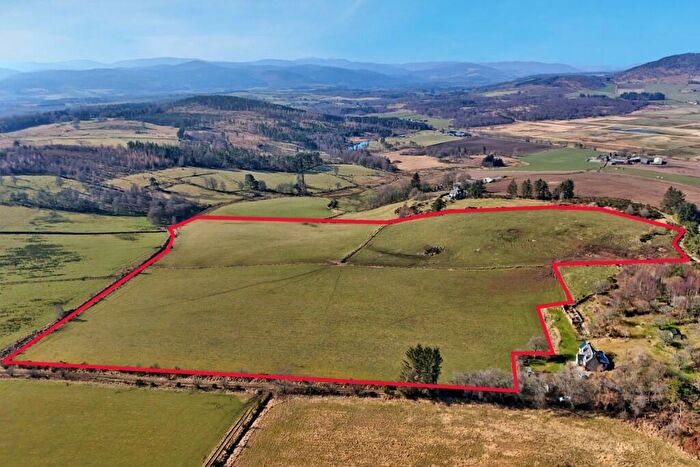
Properties for sale in Banchory and Mid Deeside
Previously listed properties in Banchory and Mid Deeside
Roads and Postcodes in Banchory and Mid Deeside
Navigate through our locations to find the location of your next house in Banchory and Mid Deeside, Aboyne for sale or to rent.
| Streets | Postcodes |
|---|---|
| Birsemohr Crescent | AB34 5EP |
| Canmore Place | AB34 5BG |
| Dee Street | AB34 5AZ |
| Durward Crescent | AB34 5DF |
| Durward Gardens | AB34 5BZ |
| Gallowhill Road | AB34 5AS |
| Glebe Park | AB34 5ED |
| Neilburn Drive | AB34 5AB |
| North Deeside Road | AB34 5AA |
| Pitmurchie Road | AB34 5AQ AB34 5BF |
| Splatchers Lane | AB34 5AT |
| St Erchard Gardens | AB34 5DG |
| The Spailings | AB34 5DW |
| AB34 4JD AB34 4JH AB34 5AD AB34 5AE AB34 5AG AB34 5AH AB34 5AJ AB34 5AN AB34 5AP AB34 5AR AB34 5AU AB34 5AX AB34 5AY AB34 5BA AB34 5BS AB34 5BT AB34 5BU AB34 5BX AB34 5BY AB34 5DA AB34 5DB AB34 5DD AB34 5DH AB34 5DJ AB34 5DL AB34 5DN AB34 5DP AB34 5DQ AB34 5DR AB34 5DS AB34 5DT AB34 5DU AB34 5DX AB34 5DY AB34 5EA AB34 5EN AB34 5EQ AB34 5ER AB34 5ES AB34 5FP |
Transport near Banchory and Mid Deeside
- FAQ
- Price Paid By Year
Frequently asked questions about Banchory and Mid Deeside
What is the average price for a property for sale in Banchory and Mid Deeside?
The average price for a property for sale in Banchory and Mid Deeside is £453,333. This amount is 45% higher than the average price in Aboyne. There are 57 property listings for sale in Banchory and Mid Deeside.
Which train stations are available in or near Banchory and Mid Deeside?
Some of the train stations available in or near Banchory and Mid Deeside are Laurencekirk, Insch and Inverurie.
Property Price Paid in Banchory and Mid Deeside by Year
The average sold property price by year was:
| Year | Average Sold Price | Price Change |
Sold Properties
|
|---|---|---|---|
| 2024 | £480,000 | 8% |
1 Property |
| 2023 | £440,000 | 25% |
2 Properties |
| 2022 | £329,914 | 8% |
8 Properties |
| 2021 | £302,916 | -49% |
6 Properties |
| 2020 | £449,900 | -19% |
4 Properties |
| 2019 | £533,350 | 20% |
5 Properties |
| 2018 | £428,175 | 28% |
9 Properties |
| 2017 | £309,111 | -31% |
9 Properties |
| 2016 | £406,000 | -12% |
5 Properties |
| 2015 | £453,166 | 28% |
6 Properties |
| 2014 | £324,038 | -13% |
13 Properties |
| 2013 | £367,002 | 25% |
9 Properties |
| 2012 | £276,063 | -0,3% |
6 Properties |
| 2011 | £277,000 | 35% |
4 Properties |
| 2010 | £180,000 | -137% |
2 Properties |
| 2009 | £426,391 | 32% |
7 Properties |
| 2008 | £291,848 | 28% |
6 Properties |
| 2007 | £210,254 | 31% |
6 Properties |
| 2006 | £145,575 | 11% |
6 Properties |
| 2005 | £129,682 | -91% |
4 Properties |
| 2004 | £247,105 | 38% |
5 Properties |
| 2003 | £152,820 | 13% |
5 Properties |
| 2002 | £132,450 | 18% |
5 Properties |
| 2001 | £108,000 | - |
1 Property |

