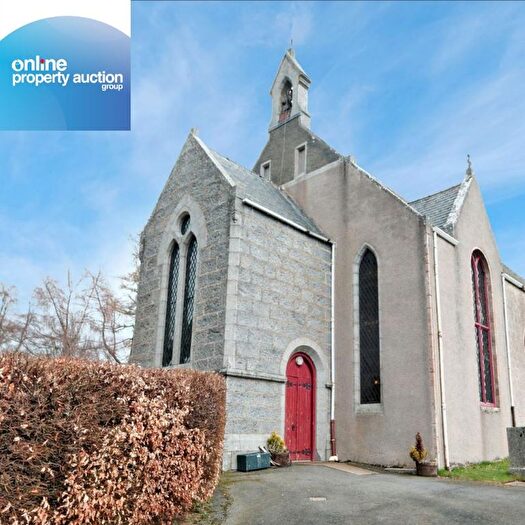
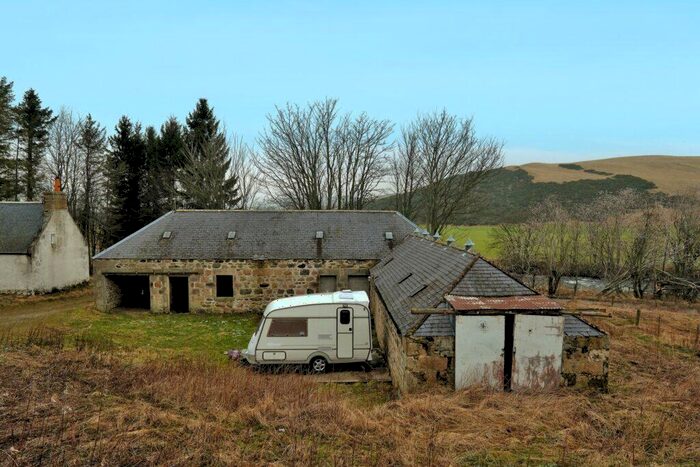
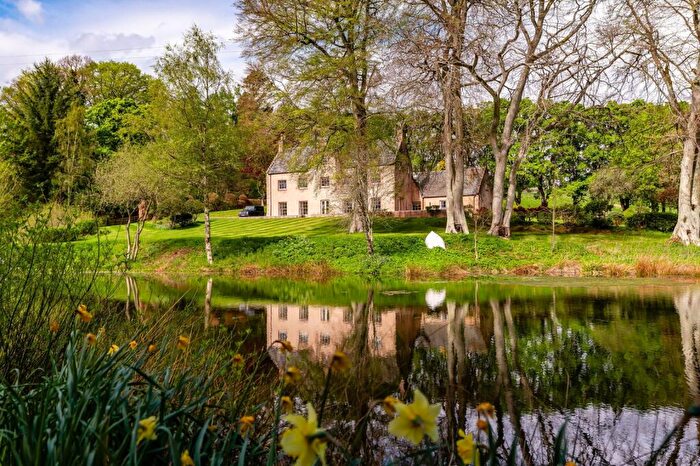
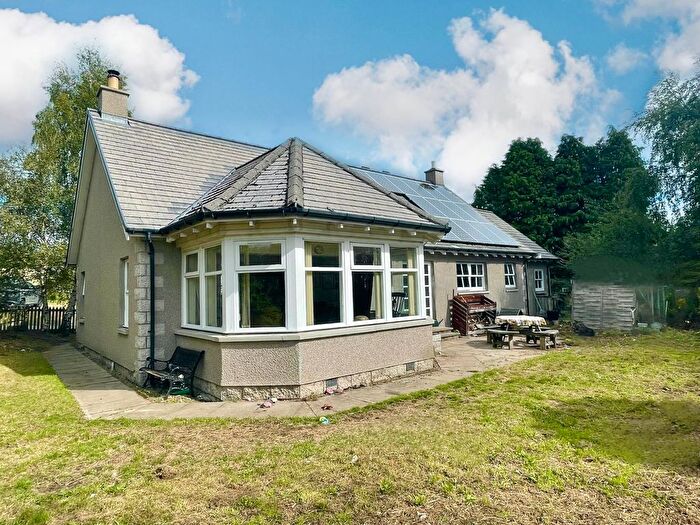
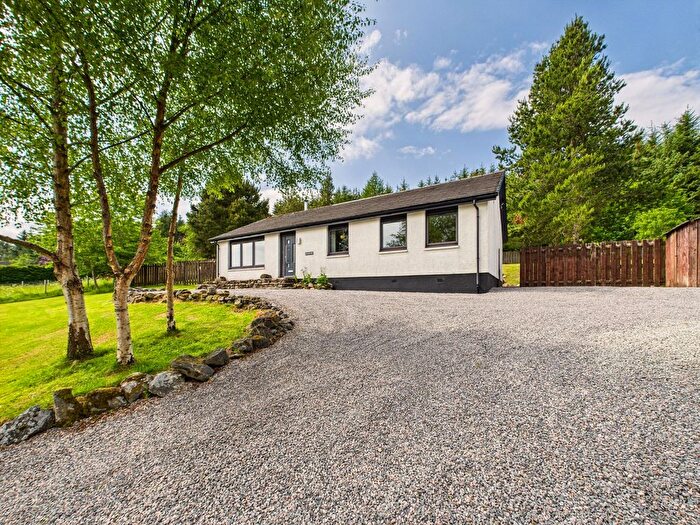
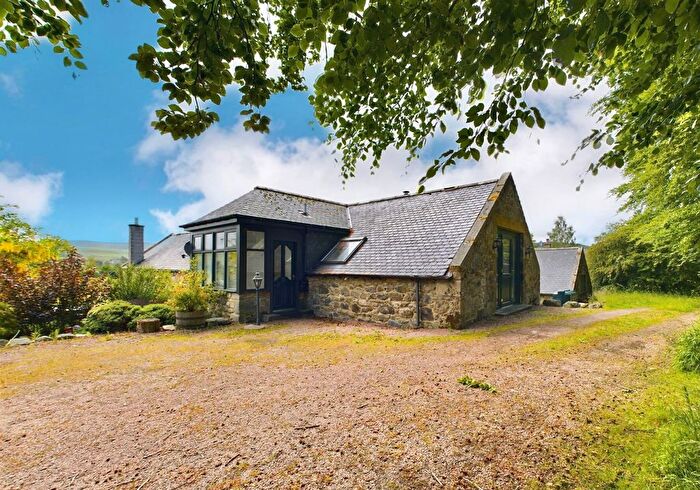
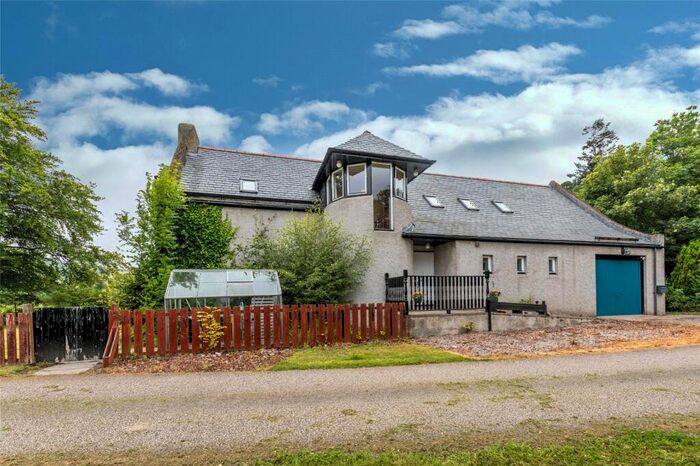
Houses for sale & to rent in Aboyne, Upper Deeside and Donside, Alford
House Prices in Aboyne, Upper Deeside and Donside
Properties in Aboyne, Upper Deeside and Donside have an average house price of £271,800.00 and had 5 Property Transactions within the last 3 years¹.
Aboyne, Upper Deeside and Donside is an area in Alford, Aberdeenshire with 146 households², where the most expensive property was sold for £350,000.00.
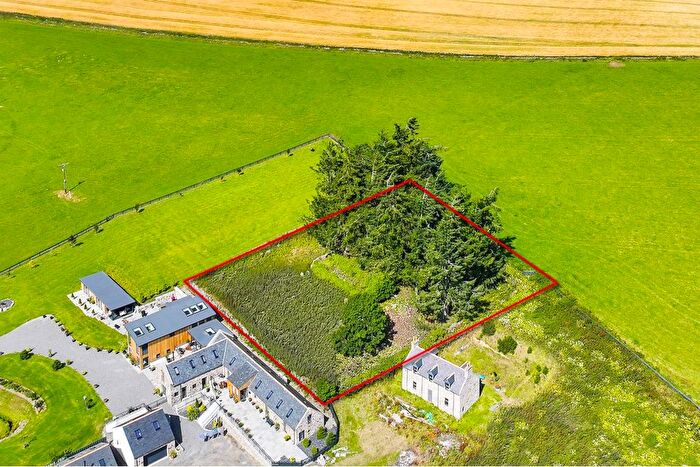
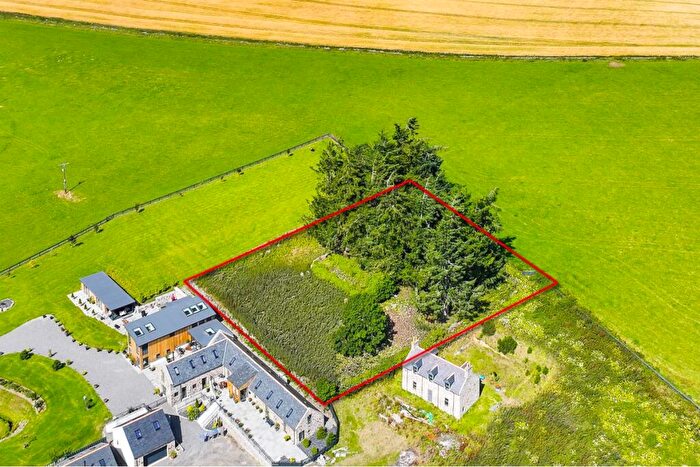
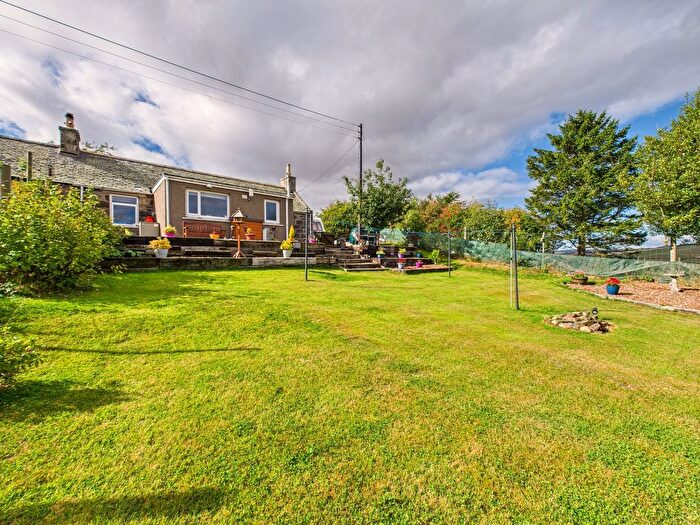
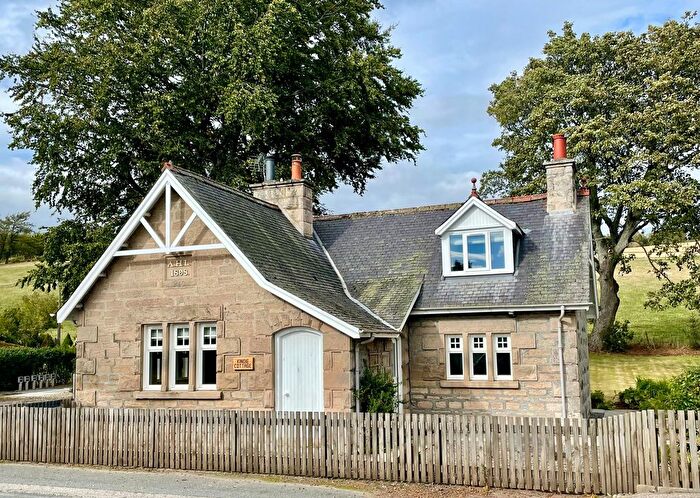
Properties for sale in Aboyne, Upper Deeside and Donside
Previously listed properties in Aboyne, Upper Deeside and Donside
Roads and Postcodes in Aboyne, Upper Deeside and Donside
Navigate through our locations to find the location of your next house in Aboyne, Upper Deeside and Donside, Alford for sale or to rent.
| Streets | Postcodes |
|---|---|
| Belnaboth Place | AB33 8RW |
| Burns View | AB33 8TR |
| AB33 8JG AB33 8JN AB33 8JP AB33 8LP AB33 8LT AB33 8LU AB33 8LX AB33 8RE AB33 8RH AB33 8RJ AB33 8RL AB33 8RN AB33 8RP AB33 8RQ AB33 8RR AB33 8RS AB33 8RT AB33 8RU AB33 8RX AB33 8RZ AB33 8SA AB33 8SB AB33 8SE AB33 8SH AB33 8SJ AB33 8SL AB33 8SN AB33 8SP AB33 8SQ AB33 8SR AB33 8SS AB33 8ST AB33 8SU AB33 8SX AB33 8SY AB33 8TA AB33 8TB AB33 8TD AB33 8TE |
Transport near Aboyne, Upper Deeside and Donside
-
Insch Station
-
Huntly Station
-
Inverurie Station
-
Keith Station
-
Dyce Station
-
Stonehaven Station
-
Aberdeen Station
-
Laurencekirk Station
- FAQ
- Price Paid By Year
Frequently asked questions about Aboyne, Upper Deeside and Donside
What is the average price for a property for sale in Aboyne, Upper Deeside and Donside?
The average price for a property for sale in Aboyne, Upper Deeside and Donside is £271,800. This amount is 16% higher than the average price in Alford. There are 83 property listings for sale in Aboyne, Upper Deeside and Donside.
Which train stations are available in or near Aboyne, Upper Deeside and Donside?
Some of the train stations available in or near Aboyne, Upper Deeside and Donside are Insch, Huntly and Inverurie.
Property Price Paid in Aboyne, Upper Deeside and Donside by Year
The average sold property price by year was:
| Year | Average Sold Price | Price Change |
Sold Properties
|
|---|---|---|---|
| 2023 | £271,800 | -39% |
5 Properties |
| 2022 | £376,600 | 36% |
5 Properties |
| 2021 | £242,138 | -117% |
9 Properties |
| 2020 | £525,000 | 63% |
1 Property |
| 2019 | £195,250 | -12% |
8 Properties |
| 2018 | £218,318 | -22% |
11 Properties |
| 2017 | £266,687 | 34% |
8 Properties |
| 2016 | £175,428 | -42% |
7 Properties |
| 2015 | £249,834 | 40% |
13 Properties |
| 2014 | £149,862 | -15% |
6 Properties |
| 2013 | £173,000 | -15% |
2 Properties |
| 2010 | £199,375 | 64% |
4 Properties |
| 2009 | £72,500 | -183% |
4 Properties |
| 2008 | £205,000 | -21% |
2 Properties |
| 2007 | £248,675 | 45% |
9 Properties |
| 2006 | £135,898 | -31% |
7 Properties |
| 2005 | £177,942 | -306% |
10 Properties |
| 2004 | £722,500 | 84% |
6 Properties |
| 2003 | £112,633 | 4% |
8 Properties |
| 2002 | £108,000 | - |
5 Properties |


