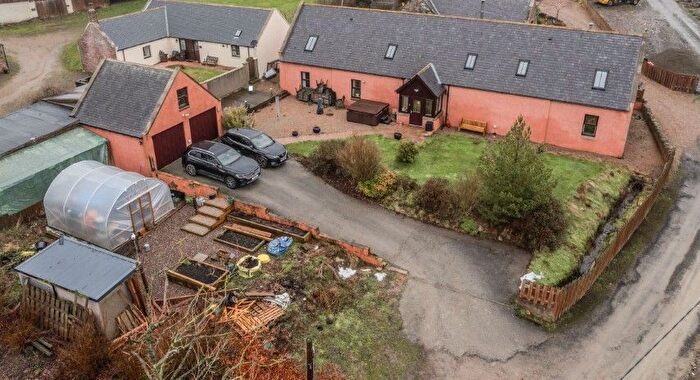
Houses for sale & to rent in Banff, Aberdeenshire
House Prices in Banff
Properties in Banff have an average house price of £145,374.00 and had 217 Property Transactions within the last 3 years.¹
Banff is an area in Aberdeenshire with 4,897 households², where the most expensive property was sold for £475,000.00.
Properties for sale in Banff
Neighbourhoods in Banff
Navigate through our locations to find the location of your next house in Banff, Aberdeenshire for sale or to rent.
Transport in Banff
Please see below transportation links in this area:
- FAQ
- Price Paid By Year
Frequently asked questions about Banff
What is the average price for a property for sale in Banff?
The average price for a property for sale in Banff is £145,374. This amount is 28% lower than the average price in Aberdeenshire. There are 895 property listings for sale in Banff.
What locations have the most expensive properties for sale in Banff?
The location with the most expensive properties for sale in Banff is Troup at an average of £161,689.
What locations have the most affordable properties for sale in Banff?
The location with the most affordable properties for sale in Banff is Banff and District at an average of £142,128.
Which train stations are available in or near Banff?
Some of the train stations available in or near Banff are Keith, Huntly and Insch.
Property Price Paid in Banff by Year
The average sold property price by year was:
| Year | Average Sold Price | Price Change |
Sold Properties
|
|---|---|---|---|
| 2025 | £133,691 | -11% |
77 Properties |
| 2024 | £148,791 | -4% |
64 Properties |
| 2023 | £154,332 | -14% |
76 Properties |
| 2022 | £175,635 | 8% |
184 Properties |
| 2021 | £161,540 | 8% |
275 Properties |
| 2020 | £148,540 | -11% |
172 Properties |
| 2019 | £164,426 | 15% |
194 Properties |
| 2018 | £140,073 | -10% |
188 Properties |
| 2017 | £154,234 | 13% |
180 Properties |
| 2016 | £133,770 | -7% |
212 Properties |
| 2015 | £142,854 | 7% |
247 Properties |
| 2014 | £132,166 | 7% |
245 Properties |
| 2013 | £122,804 | -2% |
201 Properties |
| 2012 | £125,812 | -12% |
147 Properties |
| 2011 | £140,716 | -28% |
152 Properties |
| 2010 | £179,505 | 32% |
131 Properties |
| 2009 | £122,436 | -10% |
160 Properties |
| 2008 | £135,008 | -5% |
216 Properties |
| 2007 | £142,278 | 29% |
245 Properties |
| 2006 | £100,635 | 18% |
273 Properties |
| 2005 | £82,056 | 17% |
273 Properties |
| 2004 | £68,406 | 5% |
283 Properties |
| 2003 | £64,819 | 5% |
204 Properties |
| 2002 | £61,798 | 12% |
72 Properties |
| 2001 | £54,402 | 11% |
36 Properties |
| 2000 | £48,647 | - |
24 Properties |

