
Houses for sale & to rent in Banff and District, Banff
House Prices in Banff and District
Properties in Banff and District have an average house price of £142k and had 190 Property Transactions within the last 3 years¹.
Banff and District is an area in Banff, Aberdeenshire with 4,166 households², where the most expensive property was sold for £475k.
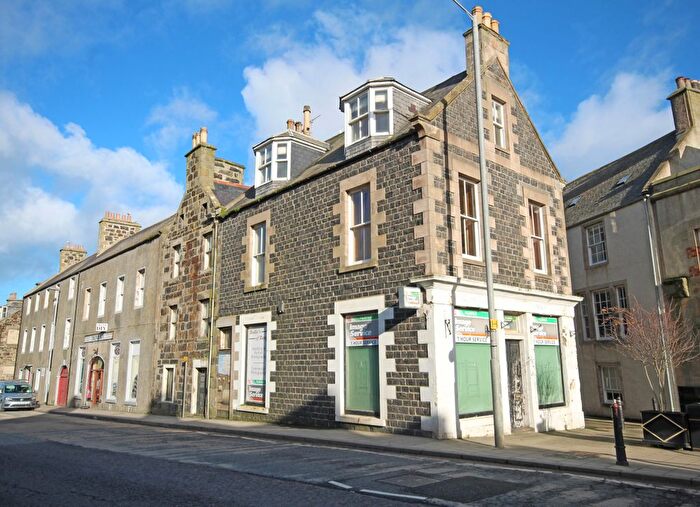
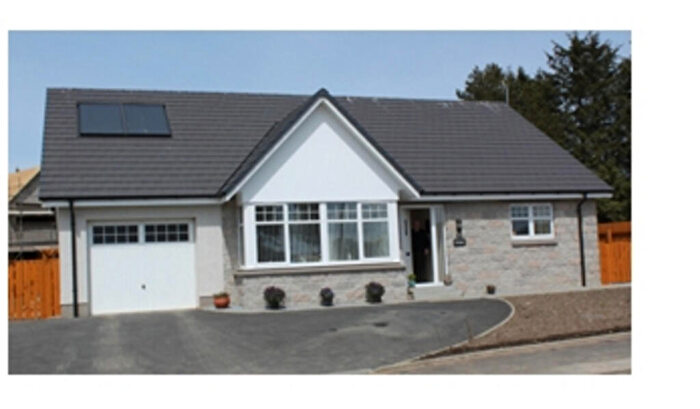
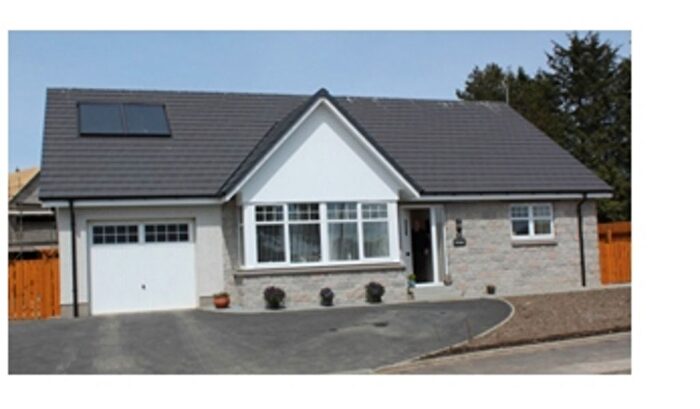
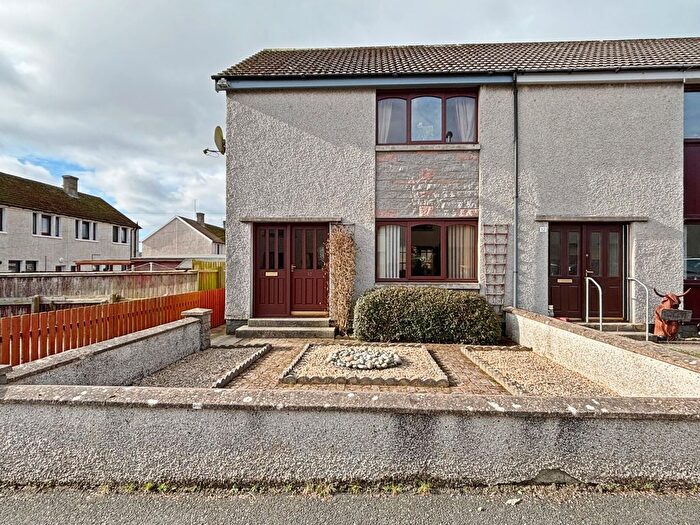
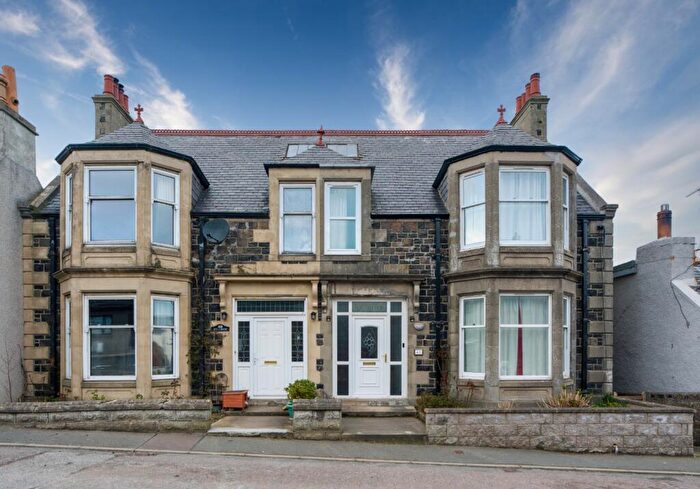
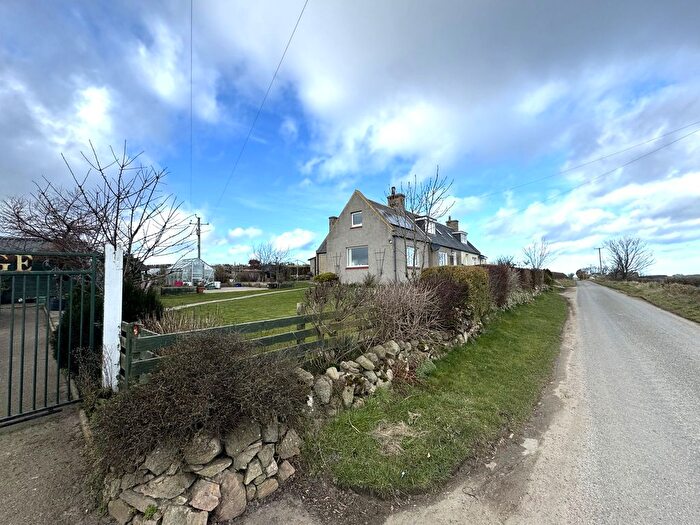
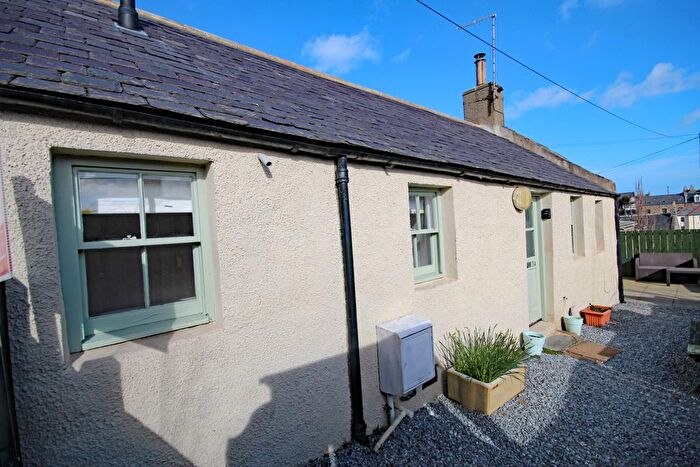
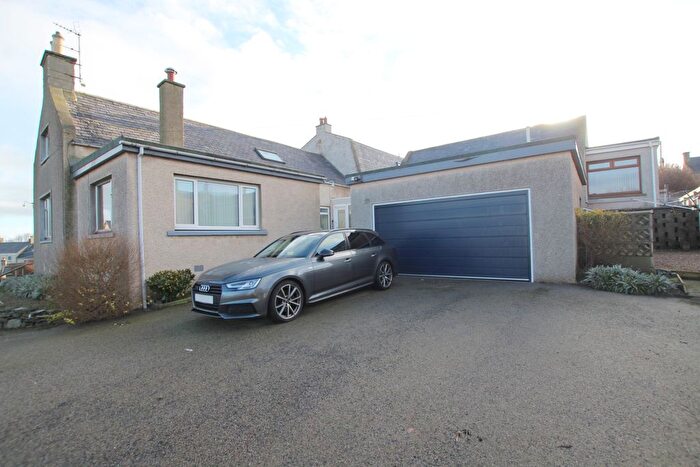
Properties for sale in Banff and District
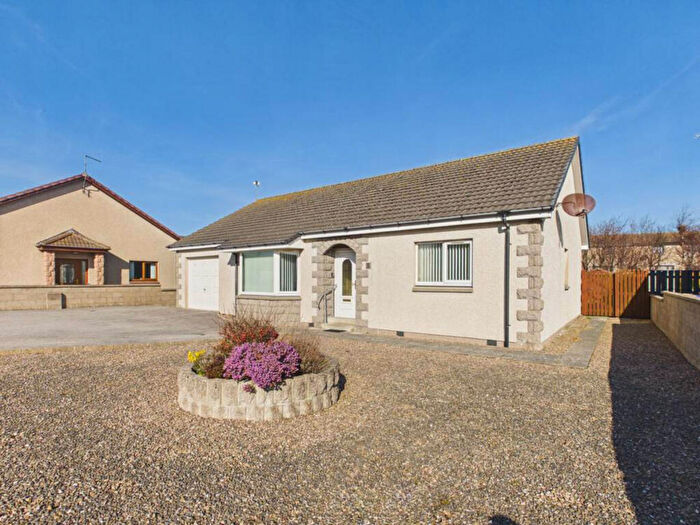

![]()
If you are looking to sell your house, let it out, or receive a property valuation, an expert can help you.
Click the button below to get started.


Roads and Postcodes in Banff and District
Navigate through our locations to find the location of your next house in Banff and District, Banff for sale or to rent.
Transport near Banff and District

- FAQ
- Price Paid By Year
Frequently asked questions about Banff and District
What is the average price for a property for sale in Banff and District?
The average price for a property for sale in Banff and District is £141,512. This amount is 3% lower than the average price in Banff. There are 690 property listings for sale in Banff and District.
What streets have the most expensive properties for sale in Banff and District?
The streets with the most expensive properties for sale in Banff and District are Boyne Court at an average of £455,000, Colleonard Road at an average of £350,000 and Doocot Park at an average of £320,000.
What streets have the most affordable properties for sale in Banff and District?
The streets with the most affordable properties for sale in Banff and District are Back Path at an average of £39,500, Boyndie Street at an average of £39,997 and Park Road at an average of £39,999.
Which train stations are available in or near Banff and District?
Some of the train stations available in or near Banff and District are Keith, Huntly and Insch.
Property Price Paid in Banff and District by Year
The average sold property price by year was:
| Year | Average Sold Price | Price Change |
Sold Properties
|
|---|---|---|---|
| 2025 | £135,052 | -7% |
70 Properties |
| 2024 | £144,094 | -2% |
57 Properties |
| 2023 | £146,353 | -23% |
63 Properties |
| 2022 | £180,705 | 9% |
150 Properties |
| 2021 | £163,896 | 7% |
220 Properties |
| 2020 | £152,322 | -9% |
140 Properties |
| 2019 | £165,914 | 16% |
160 Properties |
| 2018 | £140,030 | -9% |
166 Properties |
| 2017 | £153,143 | 14% |
158 Properties |
| 2016 | £131,041 | -10% |
174 Properties |
| 2015 | £144,316 | 7% |
204 Properties |
| 2014 | £133,517 | 8% |
205 Properties |
| 2013 | £122,365 | 3% |
158 Properties |
| 2012 | £118,261 | -21% |
120 Properties |
| 2011 | £143,640 | -31% |
124 Properties |
| 2010 | £188,349 | 32% |
111 Properties |
| 2009 | £127,174 | -5% |
138 Properties |
| 2008 | £133,050 | -0,2% |
179 Properties |
| 2007 | £133,283 | 26% |
195 Properties |
| 2006 | £97,999 | 22% |
216 Properties |
| 2005 | £76,512 | 13% |
220 Properties |
| 2004 | £66,280 | 8% |
219 Properties |
| 2003 | £61,094 | 18% |
148 Properties |
| 2002 | £50,126 | -12% |
53 Properties |
| 2001 | £56,096 | 9% |
31 Properties |
| 2000 | £51,326 | - |
20 Properties |