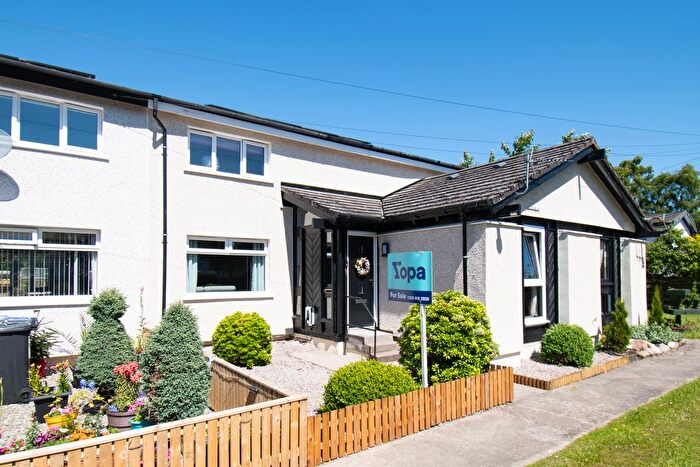
Houses for sale & to rent in Mearns, Brechin
House Prices in Mearns
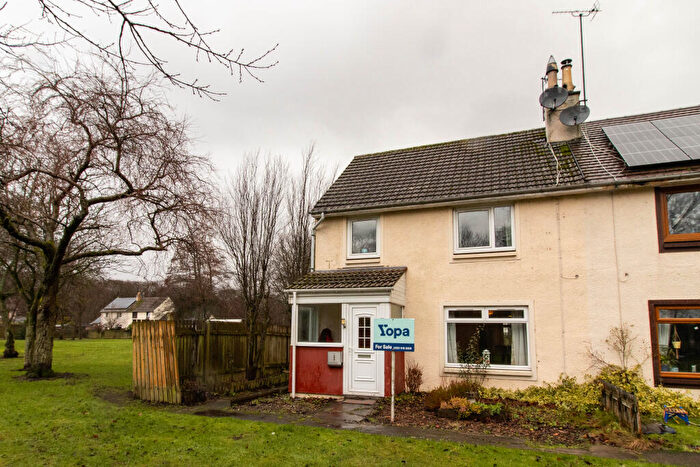
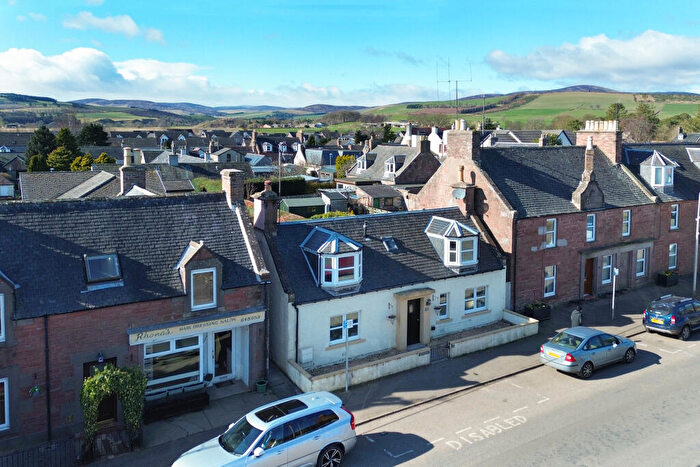
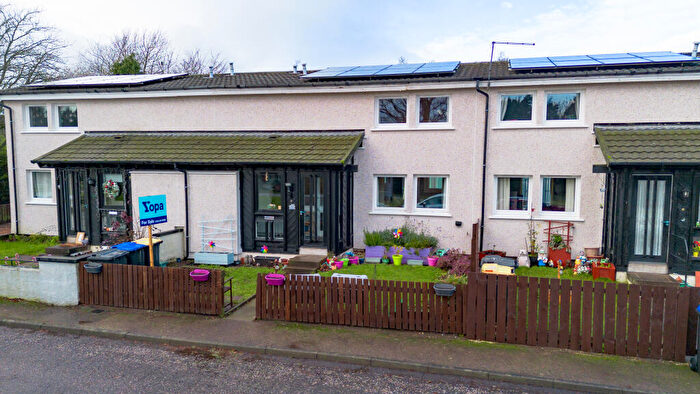
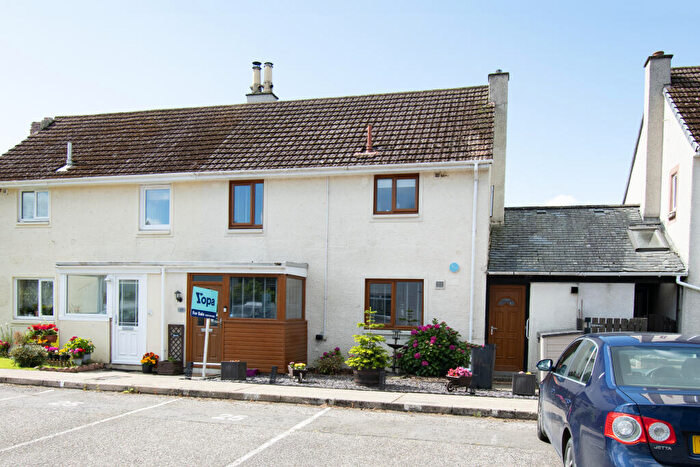
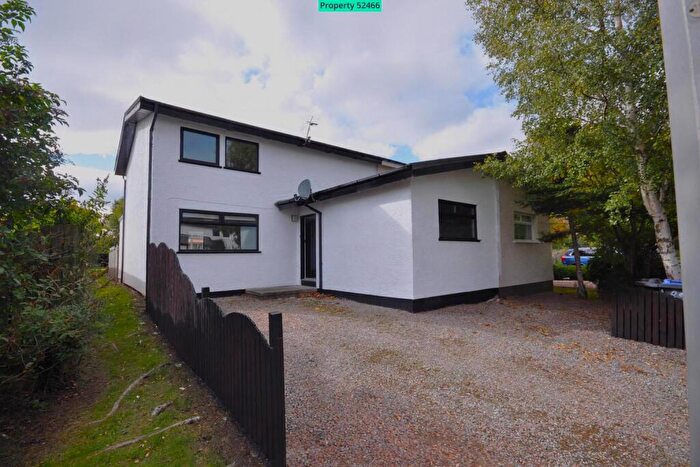
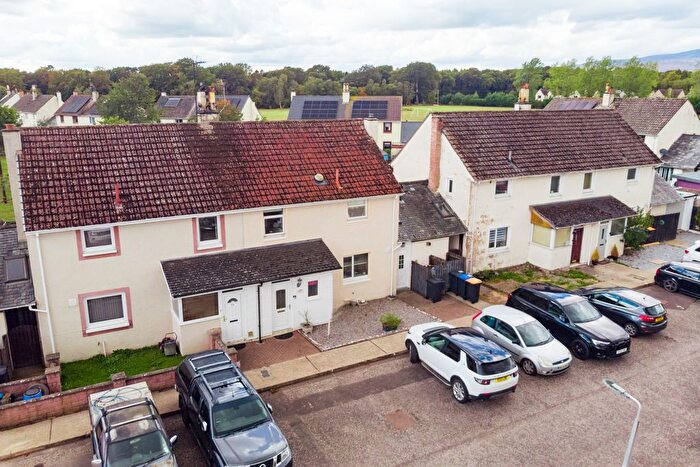
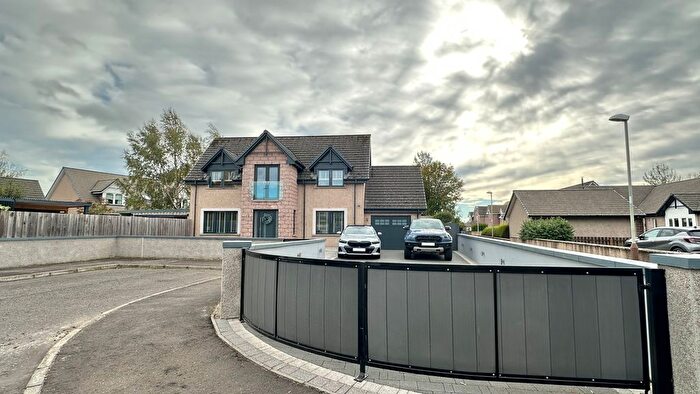
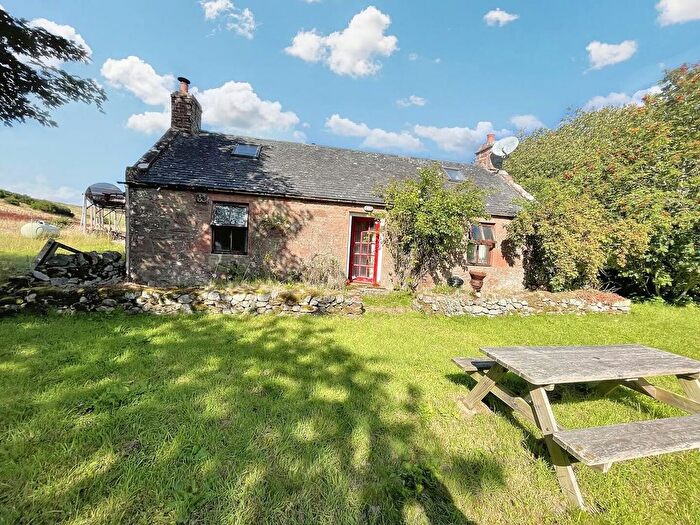
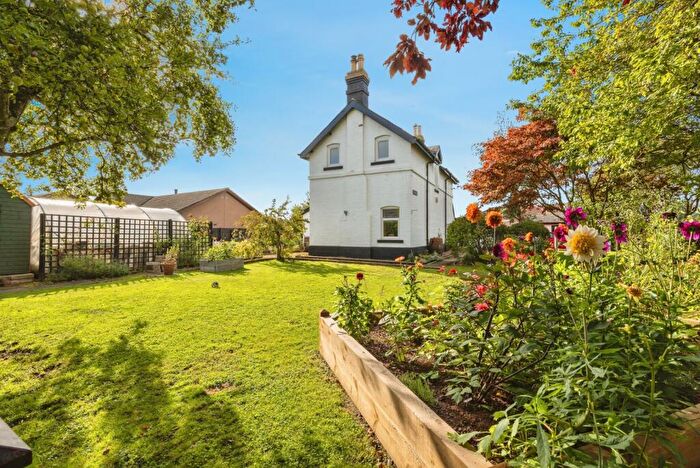
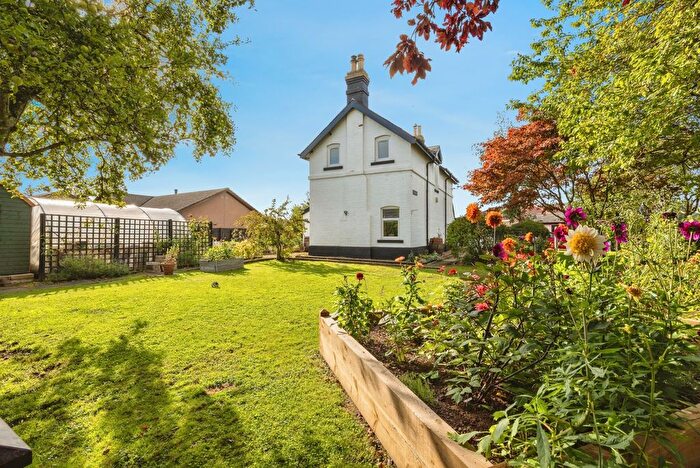
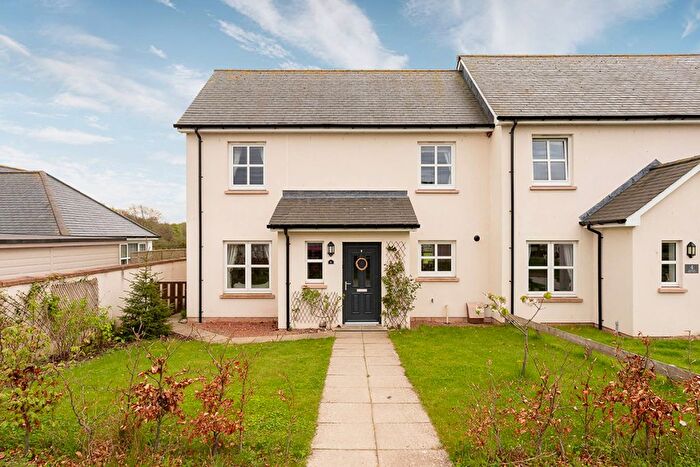
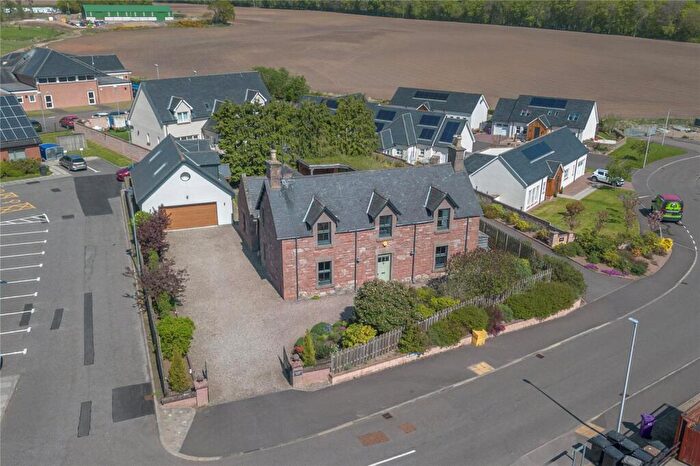
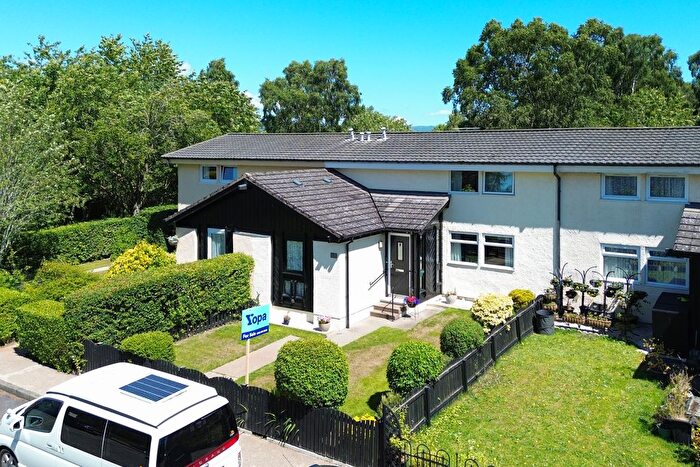
Properties in Mearns have an average house price of £132,250.00 and had 14 Property Transactions within the last 3 years¹.
Mearns is an area in Brechin, Aberdeenshire with 176 households², where the most expensive property was sold for £245,000.00.
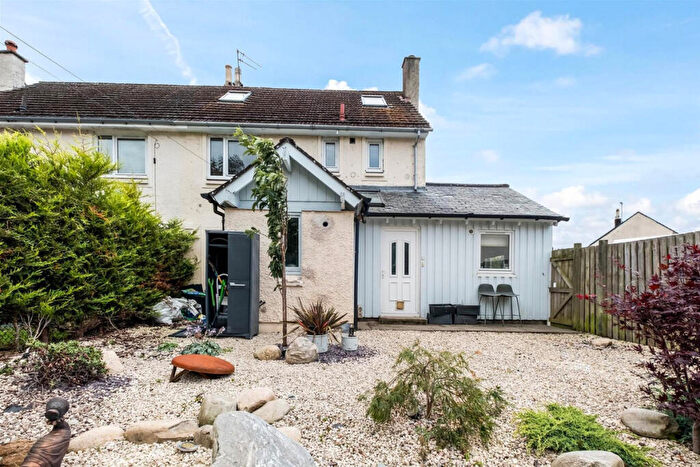
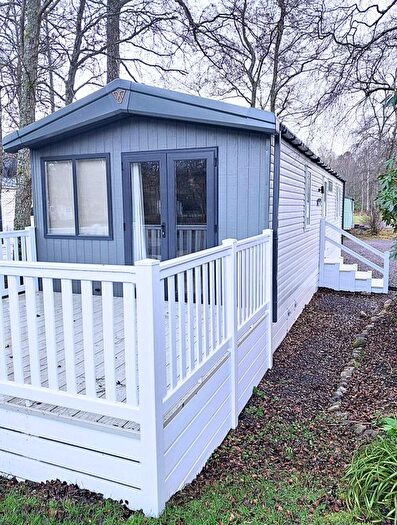
Properties for sale in Mearns
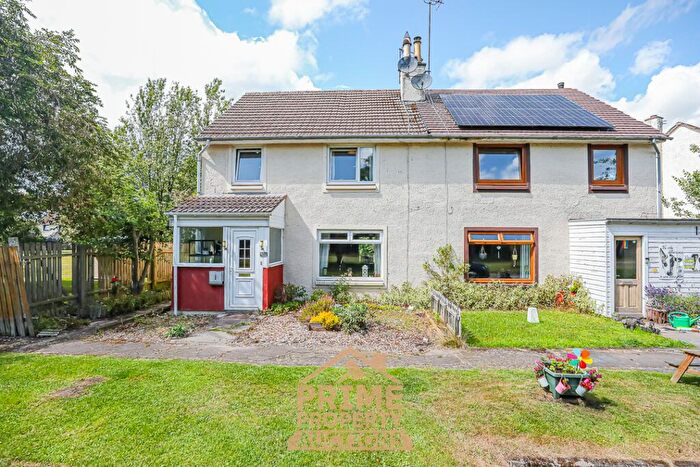
Previously listed properties in Mearns
Roads and Postcodes in Mearns
Navigate through our locations to find the location of your next house in Mearns, Brechin for sale or to rent.
| Streets | Postcodes |
|---|---|
| Burn Estate | DD9 7US |
| Dennis Drive | DD9 7XJ |
| Denstrath Road | DD9 7XF |
| Denstrath View | DD9 7XQ |
| Dewey Court | DD9 7XN |
| Forrestal Street | DD9 7XG |
| Halsey Drive | DD9 7XE |
| Perry Road | DD9 7XL |
| Ricketts Court | DD9 7XW |
| DD9 7UY DD9 7UZ DD9 7XB DD9 7XH DD9 7XP DD9 7XR DD9 7XT DD9 7XU DD9 7YP |
Transport near Mearns
- FAQ
- Price Paid By Year
Frequently asked questions about Mearns
What is the average price for a property for sale in Mearns?
The average price for a property for sale in Mearns is £132,250. There are 114 property listings for sale in Mearns.
What streets have the most expensive properties for sale in Mearns?
The streets with the most expensive properties for sale in Mearns are Denstrath View at an average of £215,000, Denstrath Road at an average of £130,666 and Forrestal Street at an average of £129,750.
What streets have the most affordable properties for sale in Mearns?
The streets with the most affordable properties for sale in Mearns are Dewey Court at an average of £80,000, Ricketts Court at an average of £110,000 and Perry Road at an average of £115,000.
Which train stations are available in or near Mearns?
Some of the train stations available in or near Mearns are Laurencekirk, Montrose and Arbroath.
Property Price Paid in Mearns by Year
The average sold property price by year was:
| Year | Average Sold Price | Price Change |
Sold Properties
|
|---|---|---|---|
| 2025 | £113,500 | -16% |
2 Properties |
| 2024 | £131,187 | -10% |
8 Properties |
| 2023 | £143,750 | -34% |
4 Properties |
| 2022 | £193,083 | 31% |
6 Properties |
| 2021 | £132,562 | 11% |
8 Properties |
| 2020 | £117,714 | 3% |
7 Properties |
| 2019 | £114,222 | -21% |
9 Properties |
| 2018 | £138,666 | 6% |
9 Properties |
| 2017 | £130,363 | 14% |
11 Properties |
| 2016 | £112,605 | 9% |
10 Properties |
| 2015 | £101,916 | -36% |
6 Properties |
| 2014 | £139,033 | 11% |
15 Properties |
| 2013 | £123,363 | 5% |
11 Properties |
| 2012 | £116,642 | 6% |
7 Properties |
| 2011 | £109,863 | 0,2% |
9 Properties |
| 2010 | £109,636 | -25% |
11 Properties |
| 2009 | £136,583 | 26% |
6 Properties |
| 2008 | £100,504 | -1% |
16 Properties |
| 2007 | £101,733 | 23% |
20 Properties |
| 2006 | £78,073 | 10% |
27 Properties |
| 2005 | £70,528 | 10% |
25 Properties |
| 2004 | £63,752 | -65% |
22 Properties |
| 2003 | £105,110 | 54% |
25 Properties |
| 2002 | £47,910 | 20% |
24 Properties |
| 2001 | £38,166 | - |
3 Properties |

