
Houses for sale & to rent in Brechin and Edzell, Brechin
House Prices in Brechin and Edzell
Properties in Brechin and Edzell have an average house price of £167,109.00 and had 200 Property Transactions within the last 3 years¹.
Brechin and Edzell is an area in Brechin, Angus with 4,827 households², where the most expensive property was sold for £773,000.00.
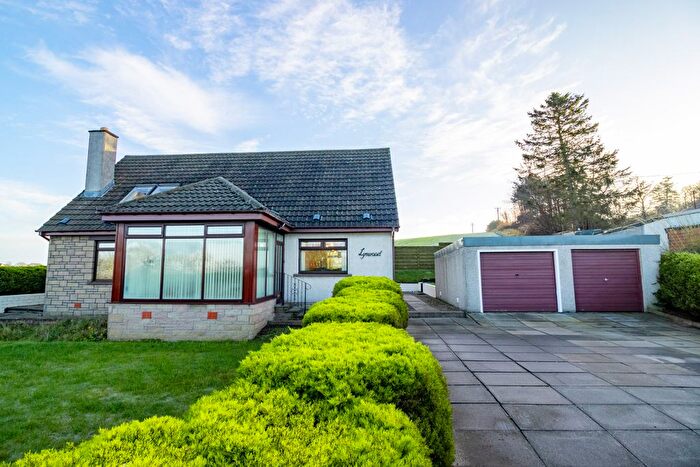
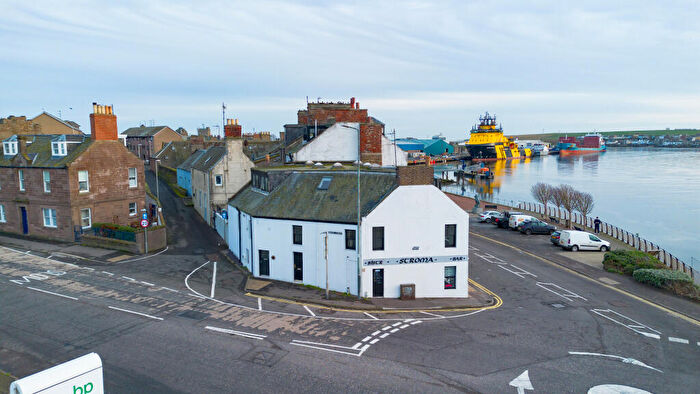
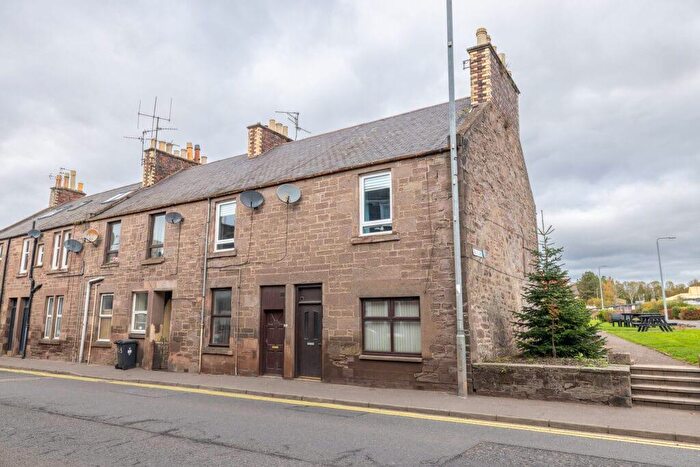
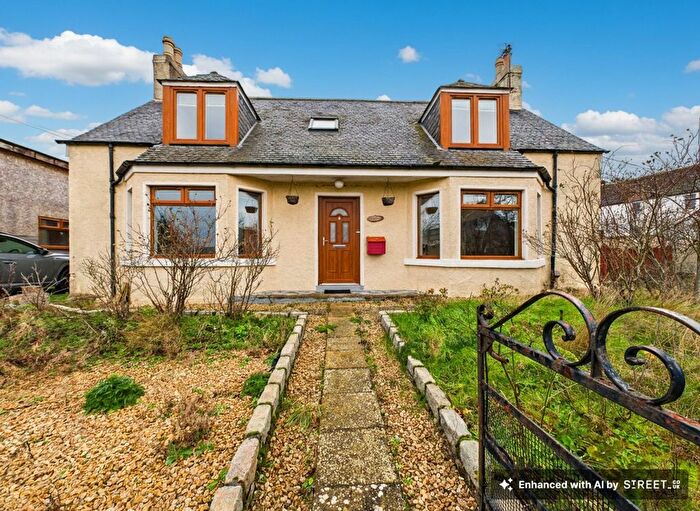
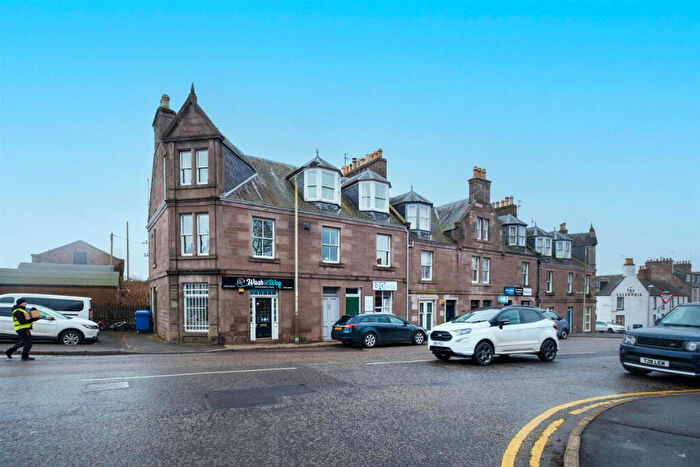
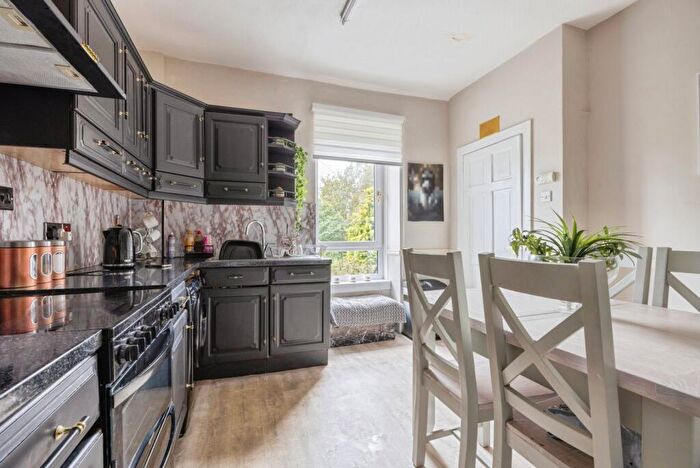
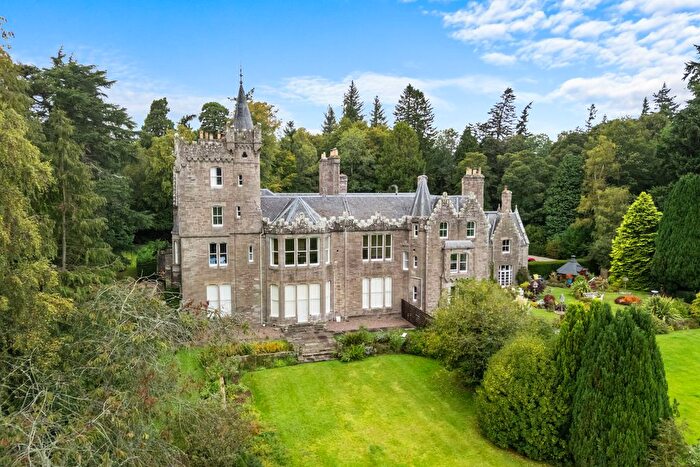
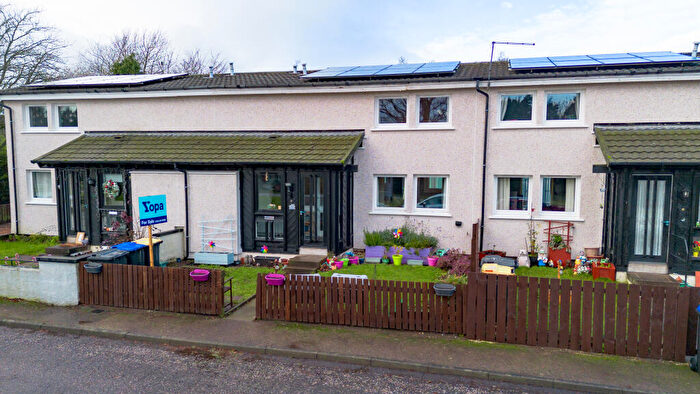
Properties for sale in Brechin and Edzell
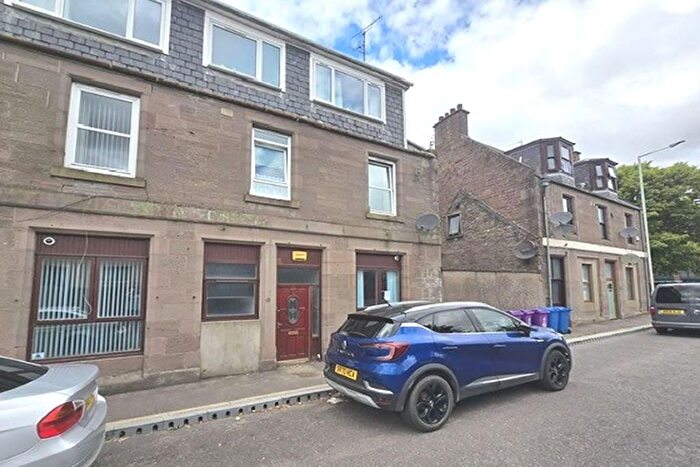
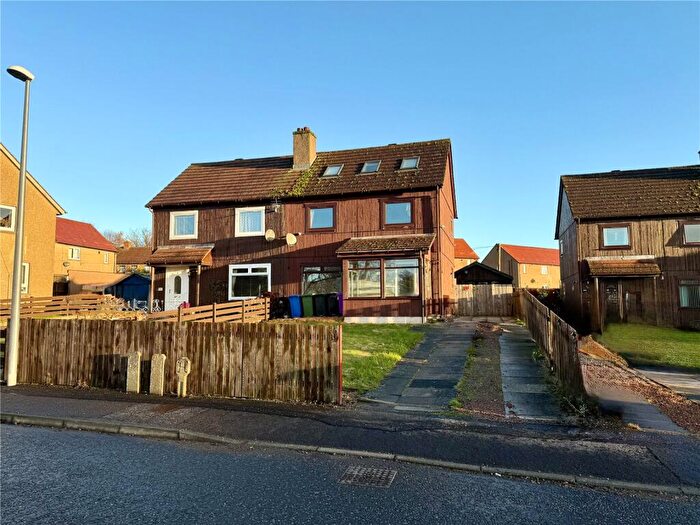
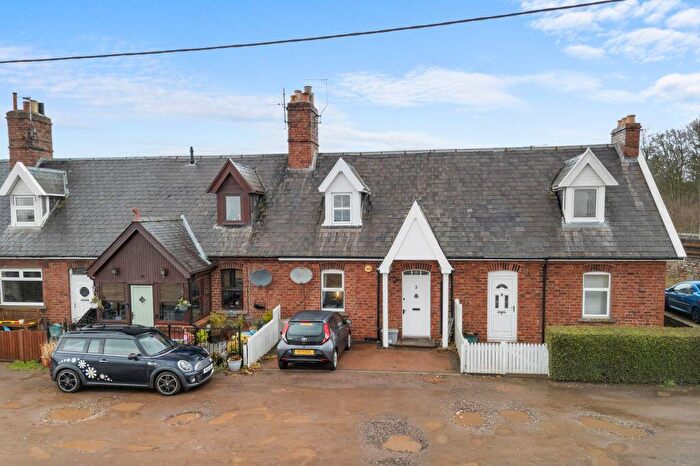
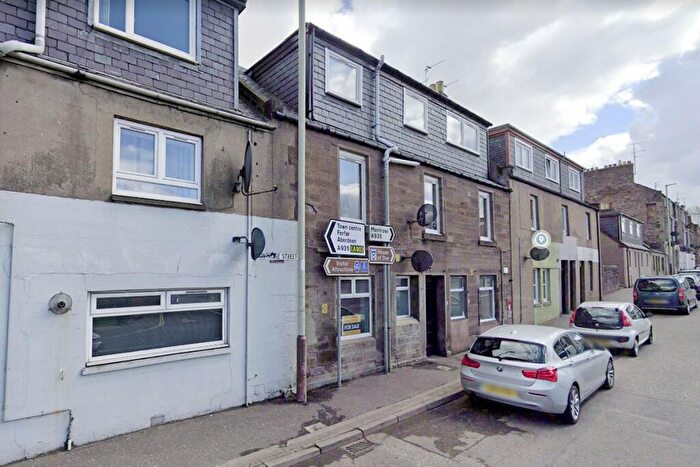
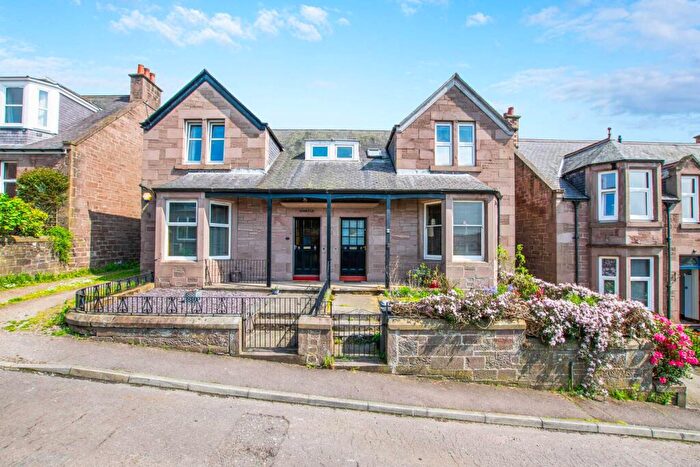
![]()
If you are looking to sell your house, let it out, or receive a property valuation, an expert can help you.
Click the button below to get started.


Roads and Postcodes in Brechin and Edzell
Navigate through our locations to find the location of your next house in Brechin and Edzell, Brechin for sale or to rent.
Transport near Brechin and Edzell

- FAQ
- Price Paid By Year
Frequently asked questions about Brechin and Edzell
What is the average price for a property for sale in Brechin and Edzell?
The average price for a property for sale in Brechin and Edzell is £167,109. This amount is 0.31% higher than the average price in Brechin. There are 1,637 property listings for sale in Brechin and Edzell.
Which train stations are available in or near Brechin and Edzell?
Some of the train stations available in or near Brechin and Edzell are Montrose, Laurencekirk and Arbroath.
Property Price Paid in Brechin and Edzell by Year
The average sold property price by year was:
| Year | Average Sold Price | Price Change |
Sold Properties
|
|---|---|---|---|
| 2023 | £144,826 | -18% |
28 Properties |
| 2022 | £170,736 | 7% |
172 Properties |
| 2021 | £159,106 | 3% |
220 Properties |
| 2020 | £154,520 | 9% |
164 Properties |
| 2019 | £140,478 | -3% |
168 Properties |
| 2018 | £144,249 | 8% |
174 Properties |
| 2017 | £132,035 | -10% |
176 Properties |
| 2016 | £145,846 | -1% |
188 Properties |
| 2015 | £146,935 | -7% |
189 Properties |
| 2014 | £157,465 | -3% |
186 Properties |
| 2013 | £161,661 | 9% |
169 Properties |
| 2012 | £146,335 | 5% |
119 Properties |
| 2011 | £138,390 | -27% |
106 Properties |
| 2010 | £175,144 | 27% |
138 Properties |
| 2009 | £127,287 | 5% |
146 Properties |
| 2008 | £121,141 | 1% |
242 Properties |
| 2007 | £119,689 | 25% |
230 Properties |
| 2006 | £89,575 | 10% |
260 Properties |
| 2005 | £80,344 | 2% |
310 Properties |
| 2004 | £78,392 | 8% |
301 Properties |
| 2003 | £72,079 | 36% |
242 Properties |
| 2002 | £46,432 | 20% |
236 Properties |
| 2001 | £36,965 | - |
15 Properties |