
Houses for sale & to rent in Ellon and District, Ellon
House Prices in Ellon and District
Properties in Ellon and District have an average house price of £200k and had 314 Property Transactions within the last 3 years¹.
Ellon and District is an area in Ellon, Aberdeenshire with 5,963 households², where the most expensive property was sold for £595k.
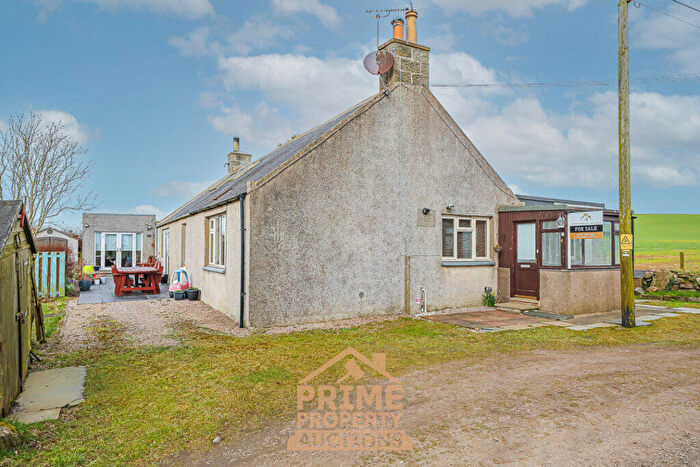
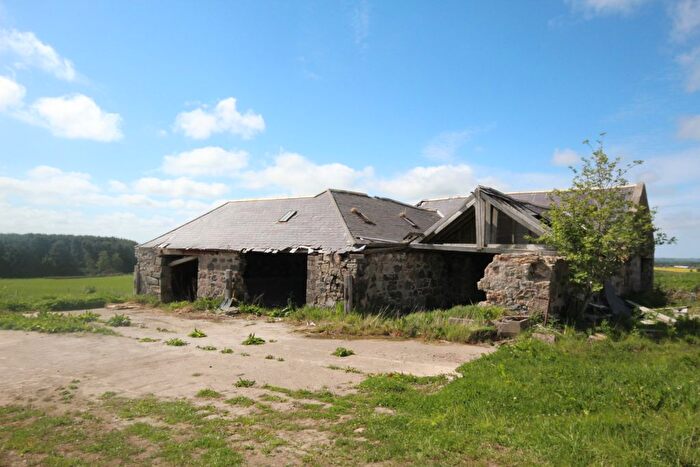
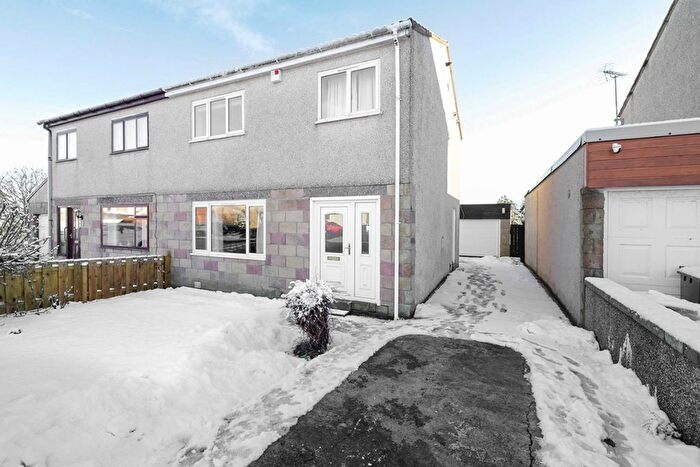
Properties for sale in Ellon and District
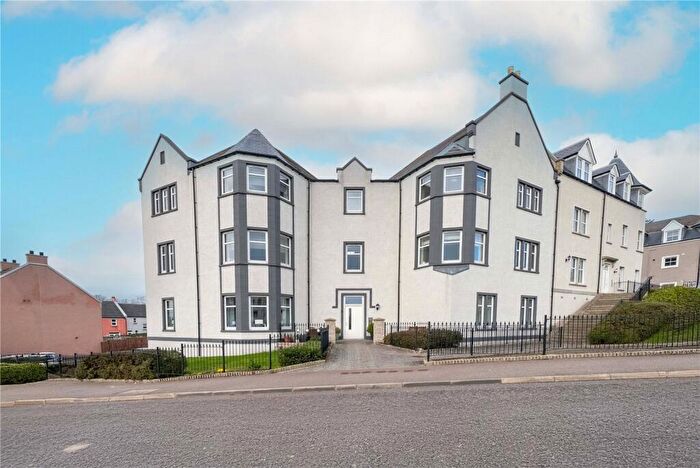

![]()
If you are looking to sell your house, let it out, or receive a property valuation, an expert can help you.
Click the button below to get started.


Roads and Postcodes in Ellon and District
Navigate through our locations to find the location of your next house in Ellon and District, Ellon for sale or to rent.
Transport near Ellon and District

- FAQ
- Price Paid By Year
Frequently asked questions about Ellon and District
What is the average price for a property for sale in Ellon and District?
The average price for a property for sale in Ellon and District is £200,341. This amount is 7% lower than the average price in Ellon. There are 415 property listings for sale in Ellon and District.
What streets have the most expensive properties for sale in Ellon and District?
The streets with the most expensive properties for sale in Ellon and District are Market Hill at an average of £420,000, Crimond Drive at an average of £378,750 and Hillhead Gardens at an average of £340,000.
What streets have the most affordable properties for sale in Ellon and District?
The streets with the most affordable properties for sale in Ellon and District are Foresters Terrace at an average of £57,000, Modley Place at an average of £80,000 and Katrine Terrace at an average of £85,000.
Which train stations are available in or near Ellon and District?
Some of the train stations available in or near Ellon and District are Dyce, Inverurie and Aberdeen.
Property Price Paid in Ellon and District by Year
The average sold property price by year was:
| Year | Average Sold Price | Price Change |
Sold Properties
|
|---|---|---|---|
| 2025 | £192,547 | -3% |
94 Properties |
| 2024 | £199,122 | -5% |
111 Properties |
| 2023 | £208,304 | -10% |
109 Properties |
| 2022 | £229,962 | 2% |
261 Properties |
| 2021 | £226,499 | 7% |
362 Properties |
| 2020 | £209,709 | -2% |
212 Properties |
| 2019 | £213,696 | 3% |
257 Properties |
| 2018 | £208,170 | 4% |
220 Properties |
| 2017 | £199,231 | -5% |
270 Properties |
| 2016 | £209,001 | -5% |
244 Properties |
| 2015 | £219,331 | 2% |
397 Properties |
| 2014 | £215,126 | 1% |
358 Properties |
| 2013 | £212,626 | 7% |
319 Properties |
| 2012 | £197,250 | - |
244 Properties |
| 2011 | £197,337 | -4% |
200 Properties |
| 2010 | £205,753 | 11% |
243 Properties |
| 2009 | £182,888 | -3% |
291 Properties |
| 2008 | £187,701 | -3% |
281 Properties |
| 2007 | £193,308 | 18% |
292 Properties |
| 2006 | £159,410 | 24% |
352 Properties |
| 2005 | £120,871 | 4% |
385 Properties |
| 2004 | £115,542 | 14% |
414 Properties |
| 2003 | £99,099 | 11% |
444 Properties |
| 2002 | £88,319 | 13% |
429 Properties |
| 2001 | £76,982 | - |
28 Properties |