
Houses for sale & to rent in Turriff and District, Ellon
House Prices in Turriff and District
Properties in Turriff and District have an average house price of £237k and had 16 Property Transactions within the last 3 years¹.
Turriff and District is an area in Ellon, Aberdeenshire with 582 households², where the most expensive property was sold for £353k.
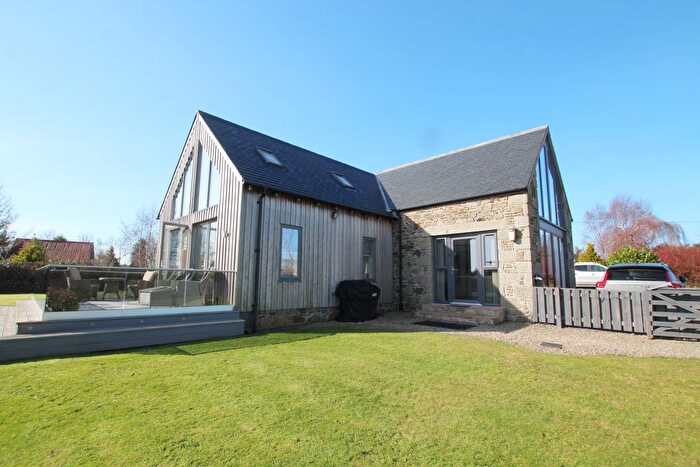
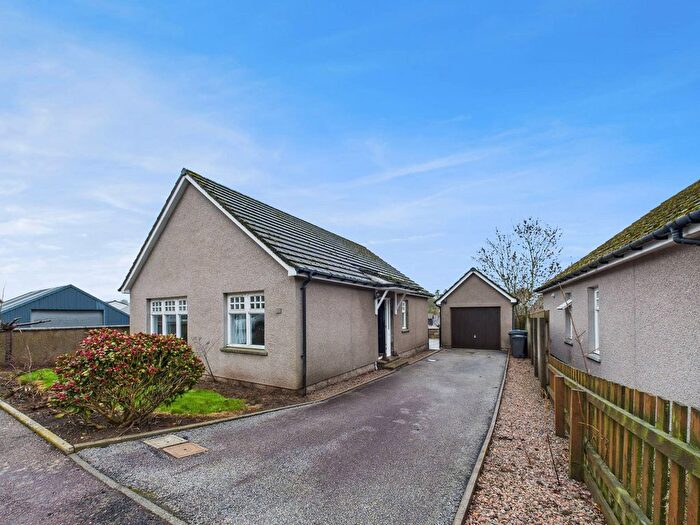
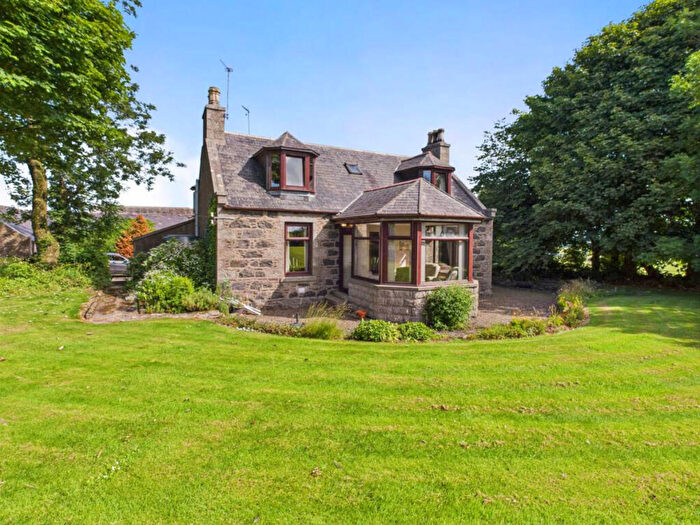
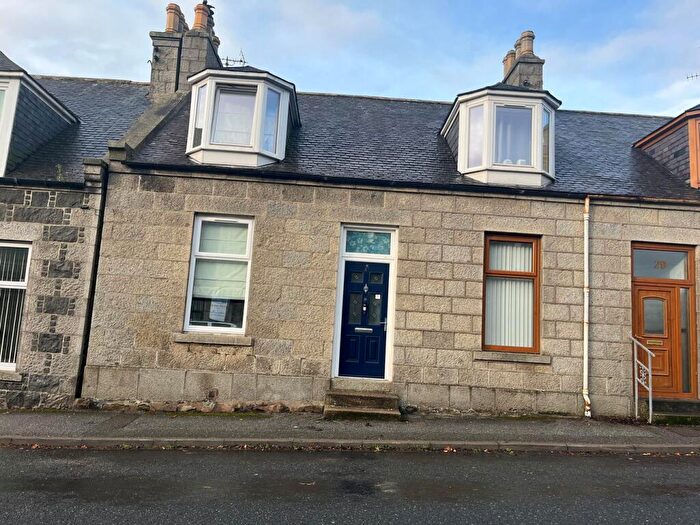
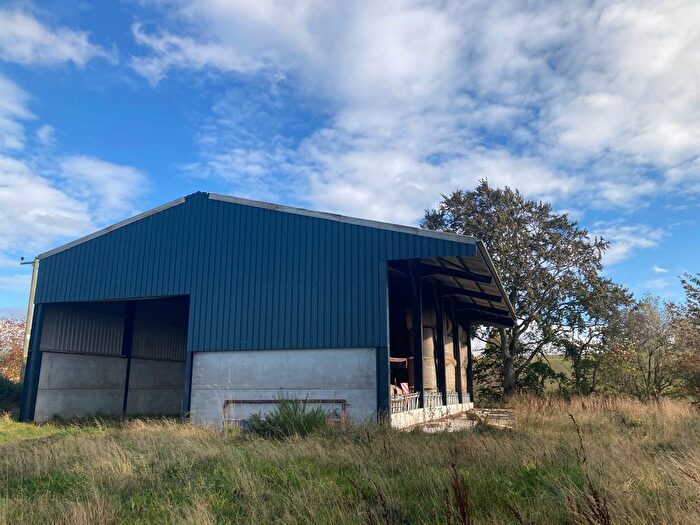
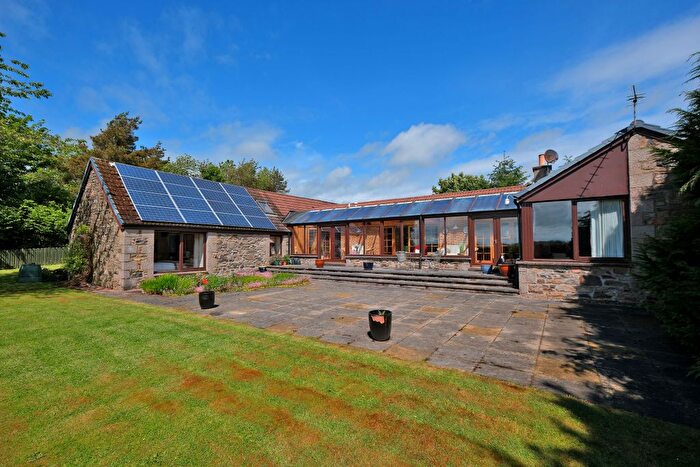
Properties for sale in Turriff and District

![]()
If you are looking to sell your house, let it out, or receive a property valuation, an expert can help you.
Click the button below to get started.
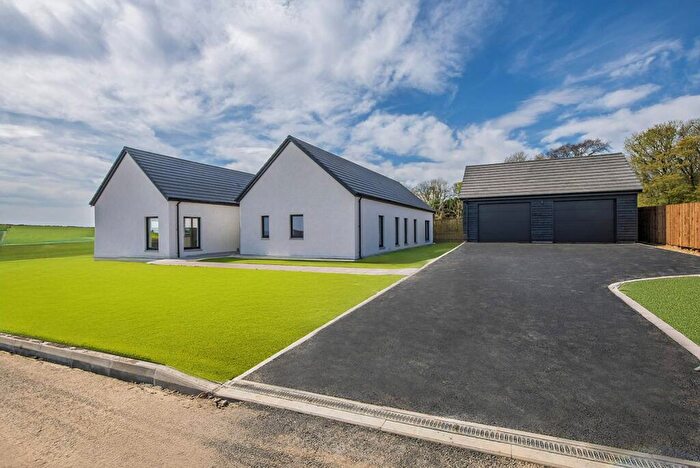
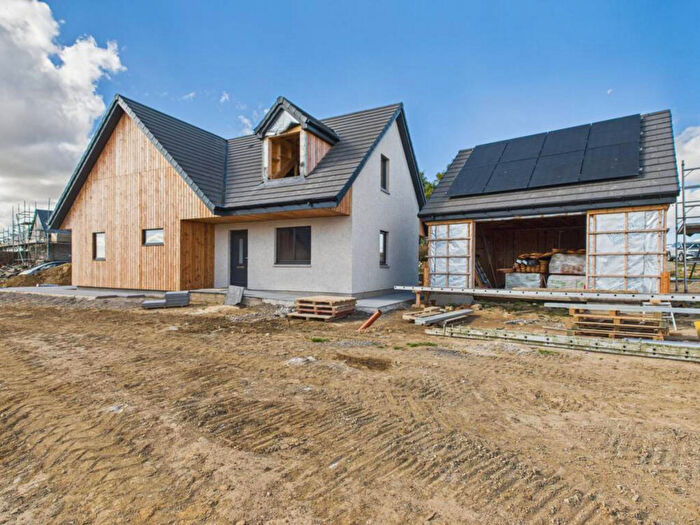
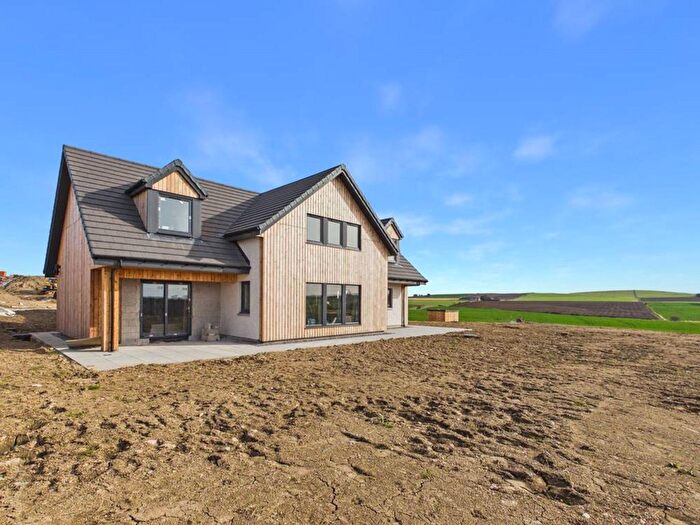
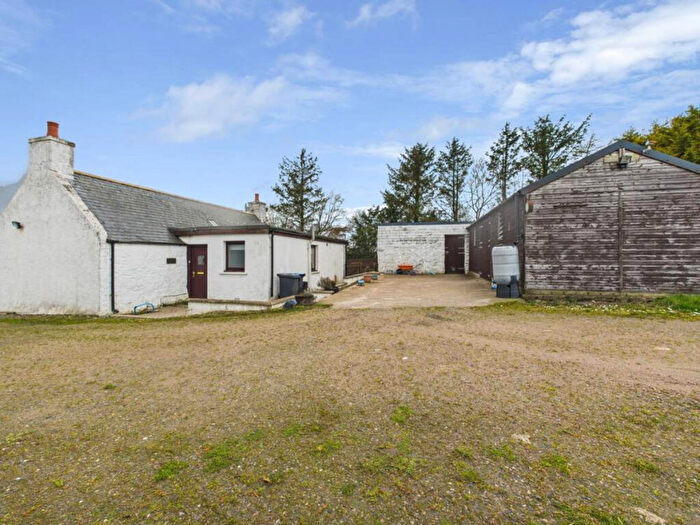
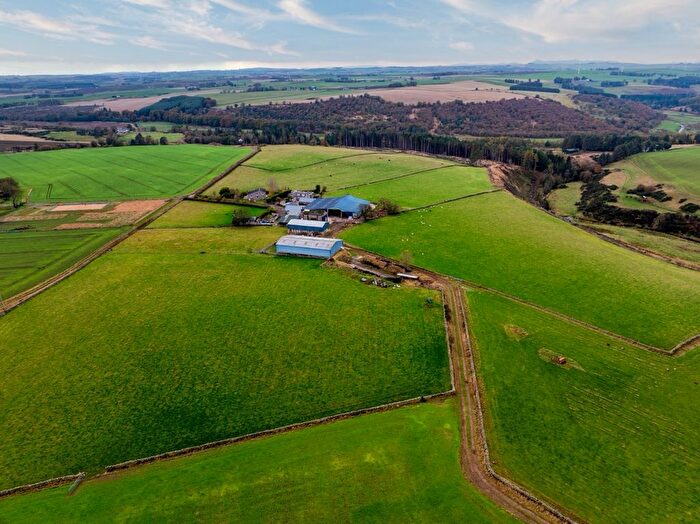
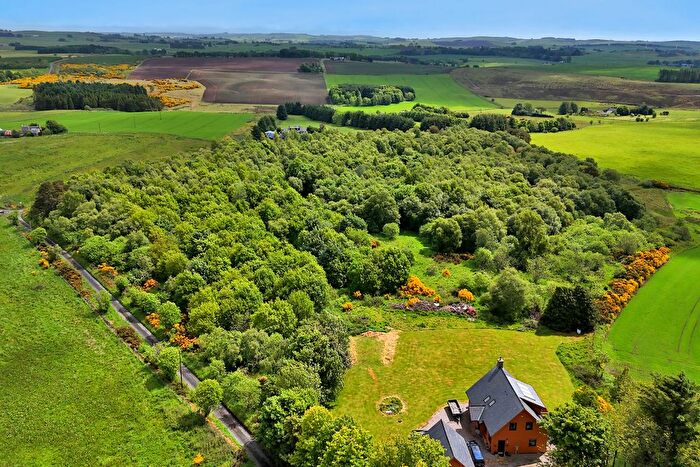
Previously listed properties in Turriff and District


![]()
If you are looking to sell your house, let it out, or receive a property valuation, an expert can help you.
Click the button below to get started.


Roads and Postcodes in Turriff and District
Navigate through our locations to find the location of your next house in Turriff and District, Ellon for sale or to rent.
| Streets | Postcodes |
|---|---|
| Admirals Park | AB41 7BA |
| Cottonhillock | AB41 7EG |
| Gordon Crescent | AB41 7DH |
| Kirklands | AB41 7DZ |
| Manse Road | AB41 7DG |
| Mansefield | AB41 7DF |
| Methlick Wood | AB41 7EF |
| Monteach Park | AB41 7HZ |
| Monteach Road | AB41 7JG AB41 7JS AB41 7JT |
| Smiddy Field | AB41 7BZ |
| AB41 7BP AB41 7BQ AB41 7BR AB41 7BS AB41 7BT AB41 7BU AB41 7BX AB41 7BY AB41 7DA AB41 7DB AB41 7DD AB41 7DE AB41 7DJ AB41 7DL AB41 7DN AB41 7DP AB41 7DQ AB41 7DR AB41 7DS AB41 7DT AB41 7DU AB41 7DX AB41 7DY AB41 7EA AB41 7EB AB41 7ED AB41 7EH AB41 7EJ AB41 7EL AB41 7EN AB41 7EP AB41 7EQ AB41 7EU AB41 7EX AB41 7EY AB41 7HA AB41 7HB AB41 7HD AB41 7HE AB41 7HN AB41 7HP AB41 7HQ AB41 7HR AB41 7HS AB41 7HT AB41 7HU AB41 7HX AB41 7HY AB41 7JA AB41 7JB AB41 7JD AB41 7JE AB41 7JH AB41 7JJ AB41 7JL AB41 7JN AB41 7JP AB41 7JQ AB41 7JR AB41 7ND AB41 7TJ AB41 7TL AB41 7TN AB41 7TP AB41 7TQ AB41 7UA AB41 8TN AB41 8TQ AB41 8YJ |
Transport near Turriff and District

- FAQ
- Price Paid By Year
Frequently asked questions about Turriff and District
What is the average price for a property for sale in Turriff and District?
The average price for a property for sale in Turriff and District is £237,359. This amount is 11% higher than the average price in Ellon. There are 130 property listings for sale in Turriff and District.
What streets have the most expensive properties for sale in Turriff and District?
The street with the most expensive properties for sale in Turriff and District is Methlick Wood at an average of £255,124.
What streets have the most affordable properties for sale in Turriff and District?
The street with the most affordable properties for sale in Turriff and District is Smiddy Field at an average of £221,000.
Which train stations are available in or near Turriff and District?
Some of the train stations available in or near Turriff and District are Inverurie, Insch and Dyce.
Property Price Paid in Turriff and District by Year
The average sold property price by year was:
| Year | Average Sold Price | Price Change |
Sold Properties
|
|---|---|---|---|
| 2025 | £235,000 | -4% |
2 Properties |
| 2024 | £243,749 | 3% |
4 Properties |
| 2023 | £235,275 | -21% |
10 Properties |
| 2022 | £284,032 | 10% |
18 Properties |
| 2021 | £255,632 | 9% |
34 Properties |
| 2020 | £232,196 | -17% |
20 Properties |
| 2019 | £271,100 | 4% |
20 Properties |
| 2018 | £259,744 | 5% |
27 Properties |
| 2017 | £246,103 | - |
22 Properties |
| 2016 | £246,208 | -19% |
18 Properties |
| 2015 | £293,121 | 10% |
29 Properties |
| 2014 | £263,604 | 0,4% |
43 Properties |
| 2013 | £262,456 | 23% |
22 Properties |
| 2012 | £202,745 | 18% |
27 Properties |
| 2011 | £166,979 | -71% |
12 Properties |
| 2010 | £284,951 | 14% |
16 Properties |
| 2009 | £244,433 | 19% |
15 Properties |
| 2008 | £198,422 | -15% |
20 Properties |
| 2007 | £227,831 | 25% |
24 Properties |
| 2006 | £170,061 | 37% |
26 Properties |
| 2005 | £106,505 | -32% |
15 Properties |
| 2004 | £140,293 | 42% |
22 Properties |
| 2003 | £80,967 | 4% |
13 Properties |
| 2002 | £77,367 | 10% |
28 Properties |
| 2001 | £70,000 | - |
1 Property |