
Houses for sale & to rent in AB43 7BA, Central Buchan, Fraserburgh
House Prices in AB43 7BA, Central Buchan
Properties in AB43 7BA have no sales history available within the last 3 years. AB43 7BA is a postcode in Central Buchan, an area in Fraserburgh, Aberdeenshire, with 12 households².
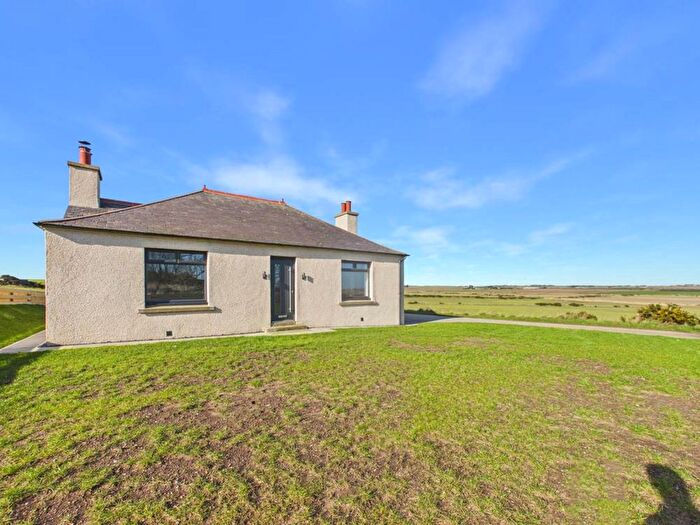
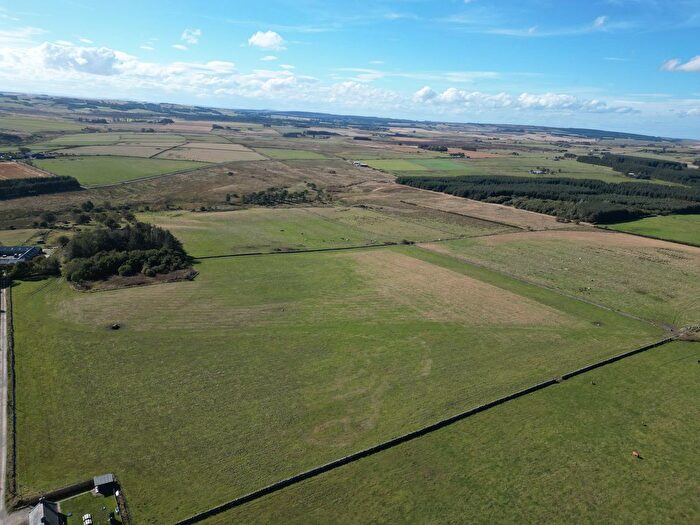
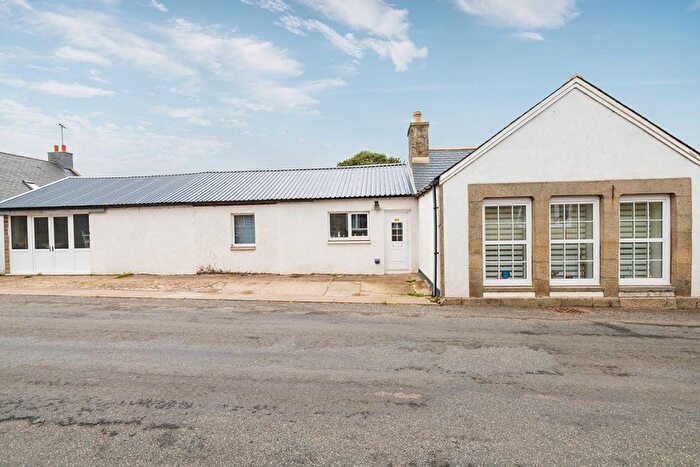
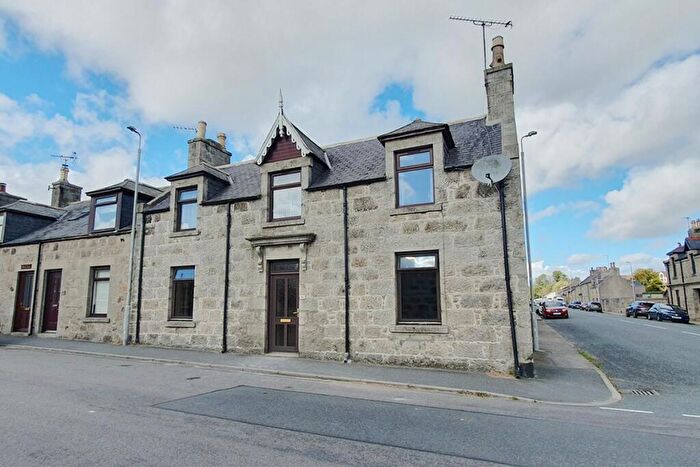
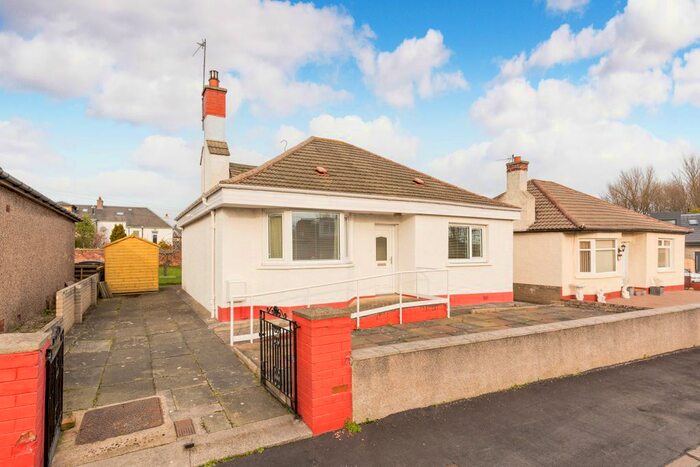
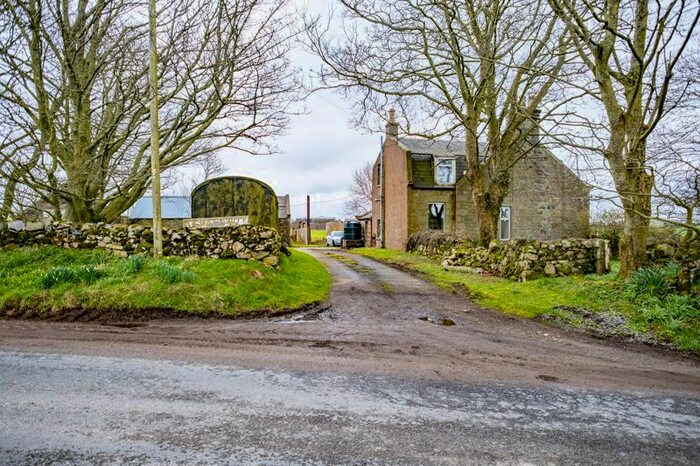
Properties for sale near AB43 7BA
Previously listed properties near AB43 7BA


![]()
If you are looking to sell your house, let it out, or receive a property valuation, an expert can help you.
Click the button below to get started.


Price Paid in AB43 7BA, Central Buchan
3 Hatton Cottages Fraserburgh AB43 7BA, Central Buchan Fraserburgh
Property 3 Hatton Cottages Fraserburgh has been sold 1 time. The last time it was sold was in 21/10/2020 and the sold price was £143,000.00.
This is a Property which was sold as an Established Building in 21/10/2020
| Date | Price | Classification |
|---|---|---|
| 21/10/2020 | £143,000.00 | Established Building |
Hillfoot Fraserburgh AB43 7BA, Central Buchan Fraserburgh
Property Hillfoot Fraserburgh has been sold 4 times. The last time it was sold was in 08/12/2016 and the sold price was £180,000.00.
This is a Property which was sold as an Established Building in 08/12/2016
| Date | Price | Classification |
|---|---|---|
| 08/12/2016 | £180,000.00 | Established Building |
| 20/07/2011 | £187,500.00 | Established Building |
| 22/01/2008 | £175,000.00 | Established Building |
| 03/10/2006 | £170,000.00 | Established Building |
Sandhole Cottage Fraserburgh AB43 7BA, Central Buchan Fraserburgh
Property Sandhole Cottage Fraserburgh has been sold 3 times. The last time it was sold was in 05/03/2014 and the sold price was £125,000.00.
This is a Property which was sold as an Established Building in 05/03/2014
| Date | Price | Classification |
|---|---|---|
| 05/03/2014 | £125,000.00 | Established Building |
| 05/03/2014 | £125,000.00 | Established Building |
| 05/07/2002 | £40,000.00 | Established Building |
Transport near AB43 7BA

House price paid reports for AB43 7BA
Click on the buttons below to see price paid reports by year or property price:
- Price Paid By Year
Property Price Paid in AB43 7BA by Year
The average sold property price by year was:
| Year | Average Sold Price | Price Change |
Sold Properties
|
|---|---|---|---|
| 2020 | £143,000 | -26% |
1 Property |
| 2016 | £180,000 | 31% |
1 Property |
| 2014 | £125,000 | -50% |
2 Properties |
| 2011 | £187,500 | 7% |
1 Property |
| 2008 | £175,000 | 3% |
1 Property |
| 2006 | £170,000 | 76% |
1 Property |
| 2002 | £40,000 | - |
1 Property |