
Houses for sale & to rent in Inverurie, Aberdeenshire
House Prices in Inverurie
Properties in Inverurie have an average house price of £218k and had 761 Property Transactions within the last 3 years.¹
Inverurie is an area in Aberdeenshire with 14,150 households², where the most expensive property was sold for £1.15M.
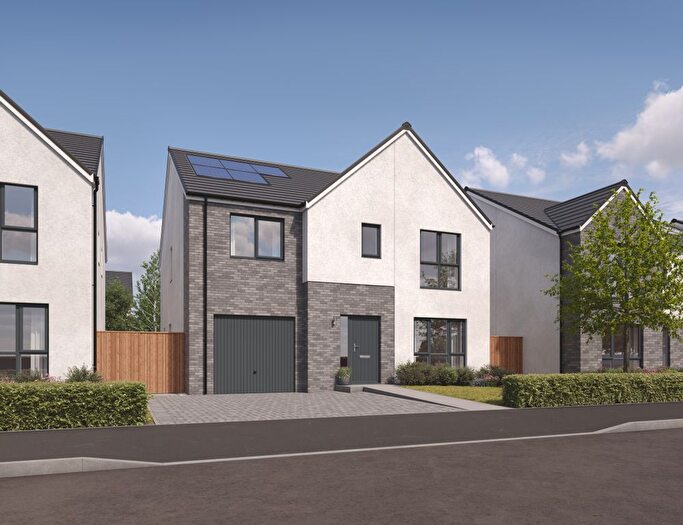
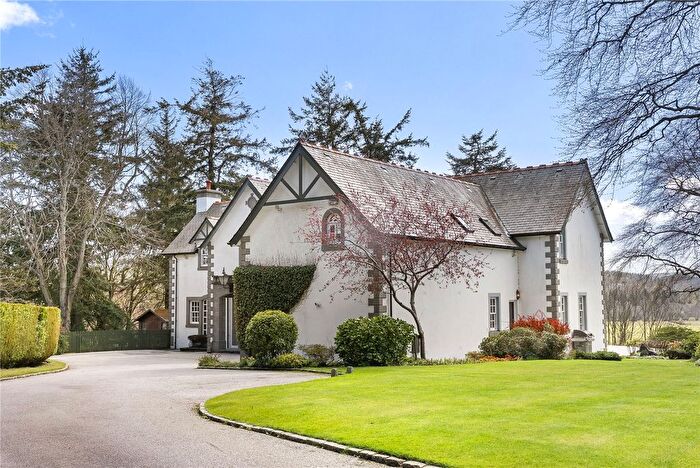
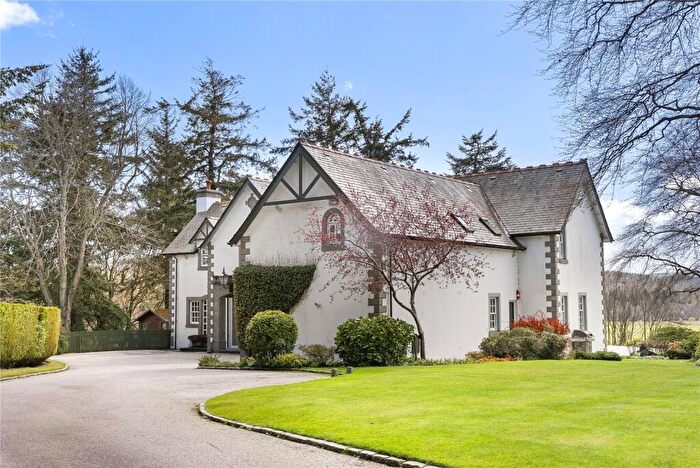
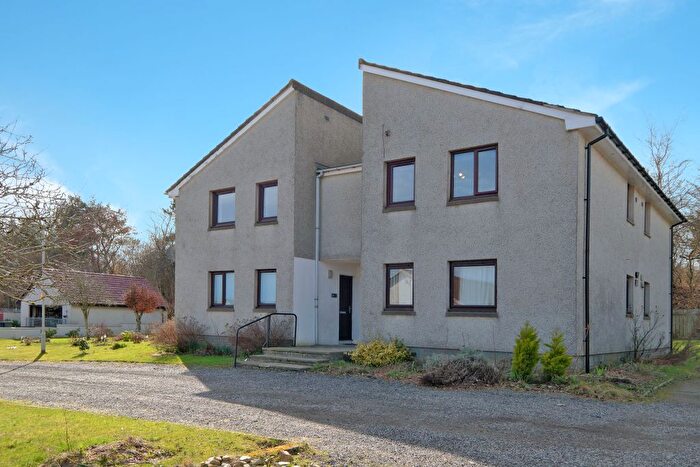
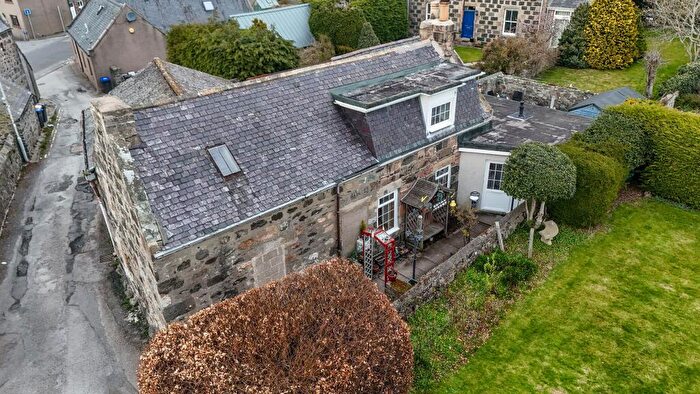
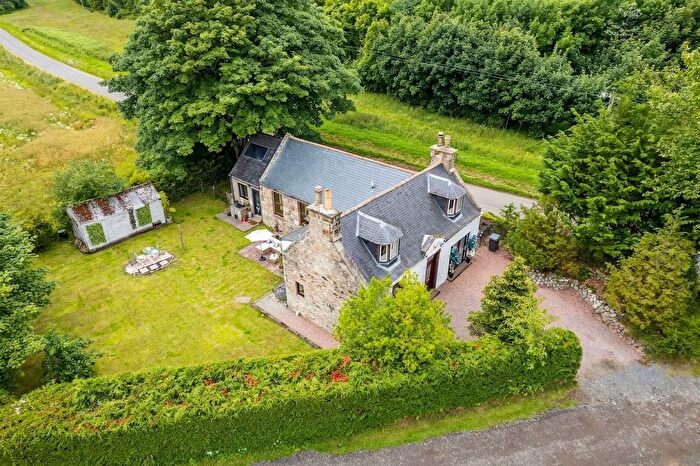
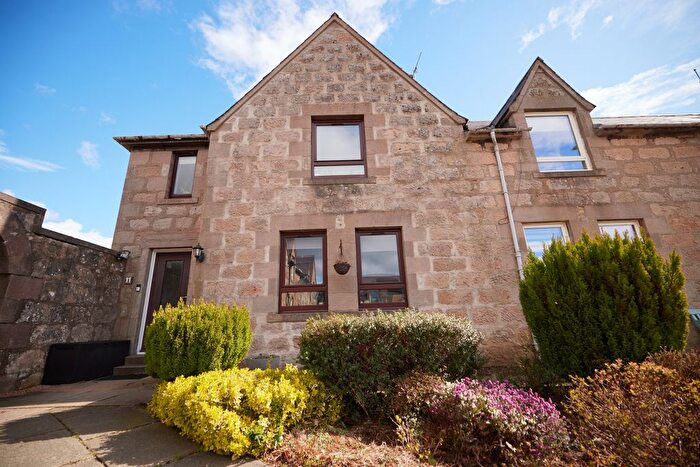
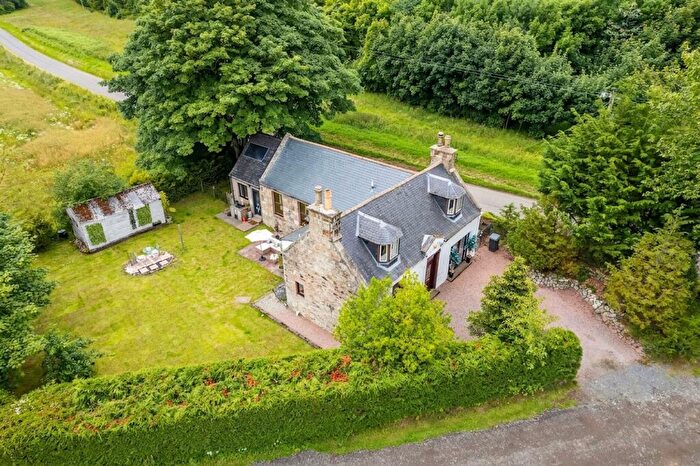
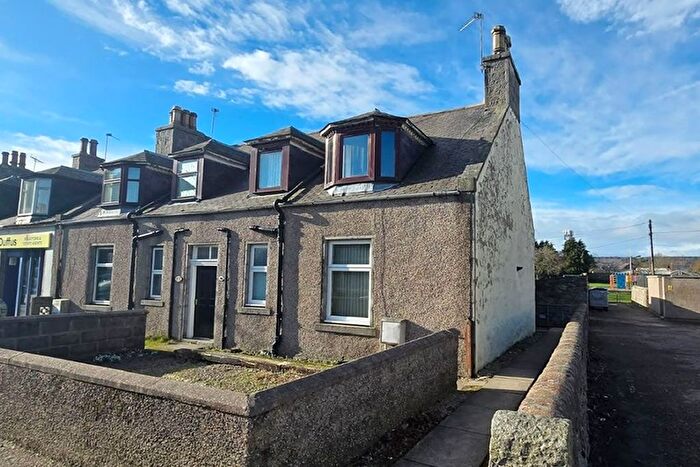
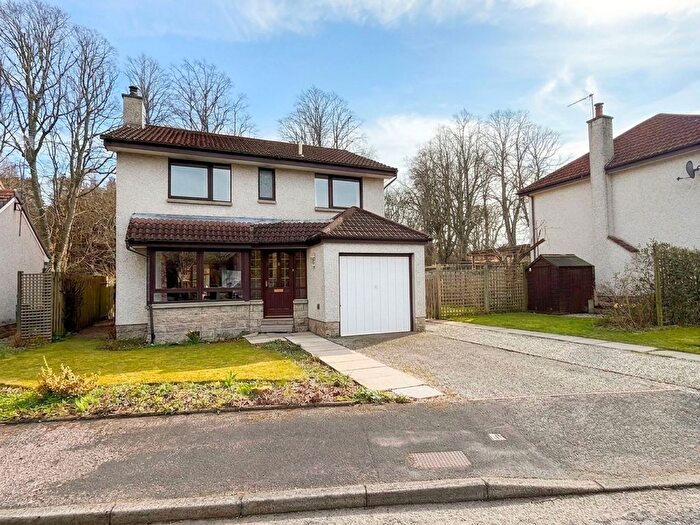
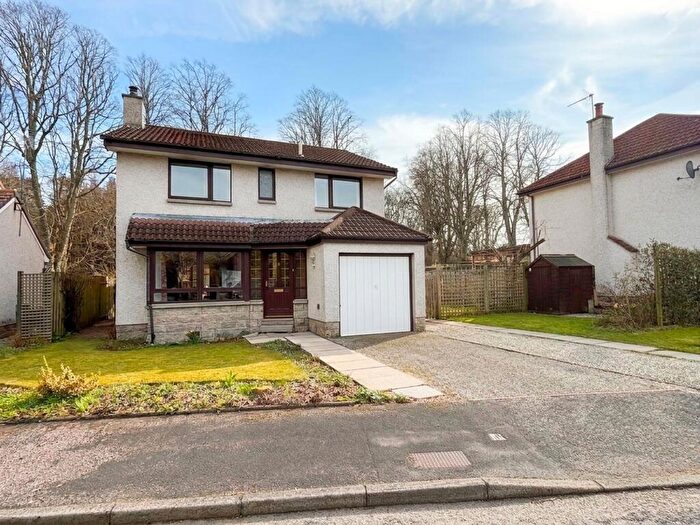
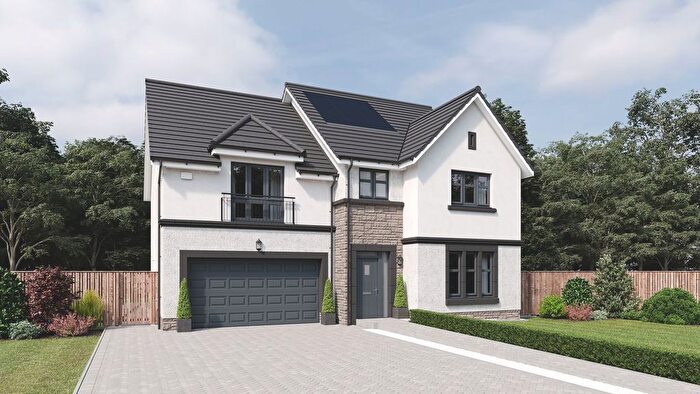
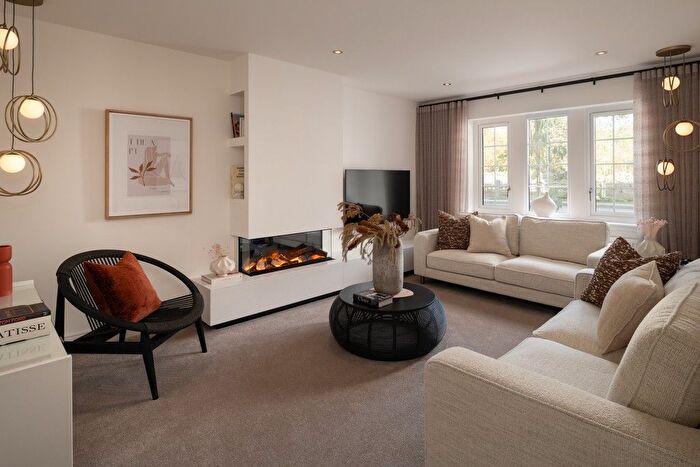
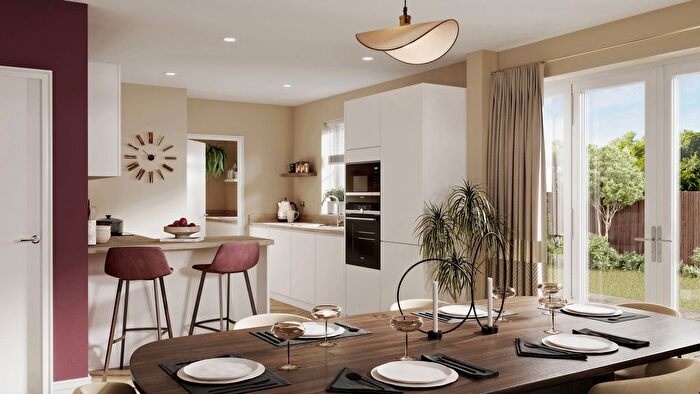
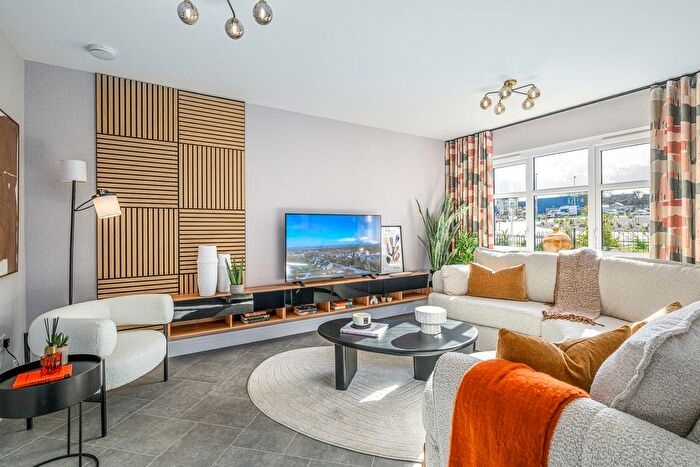
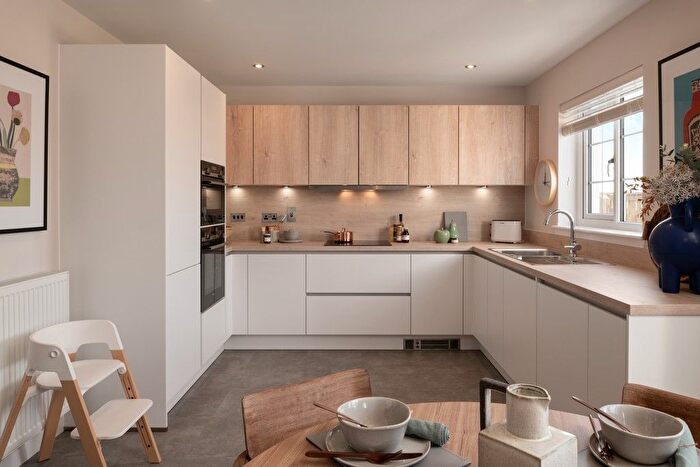
Properties for sale in Inverurie
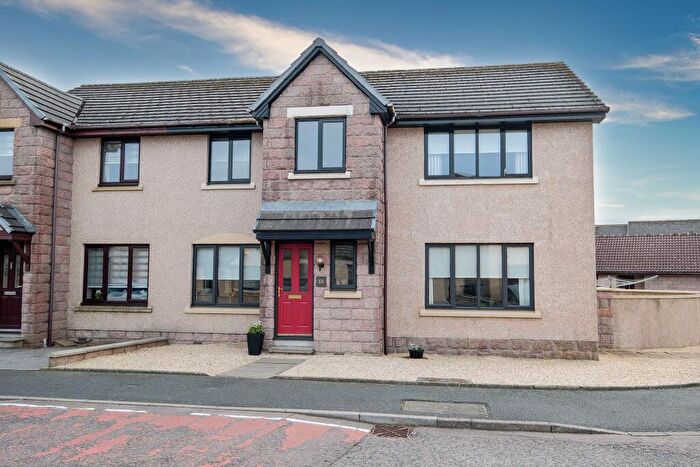
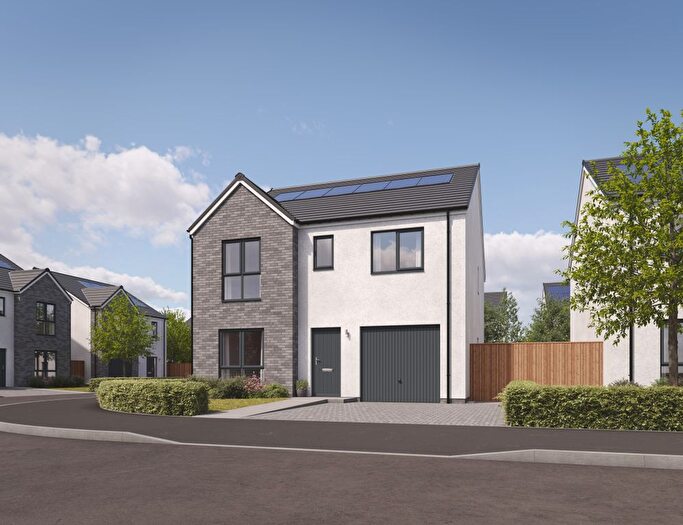
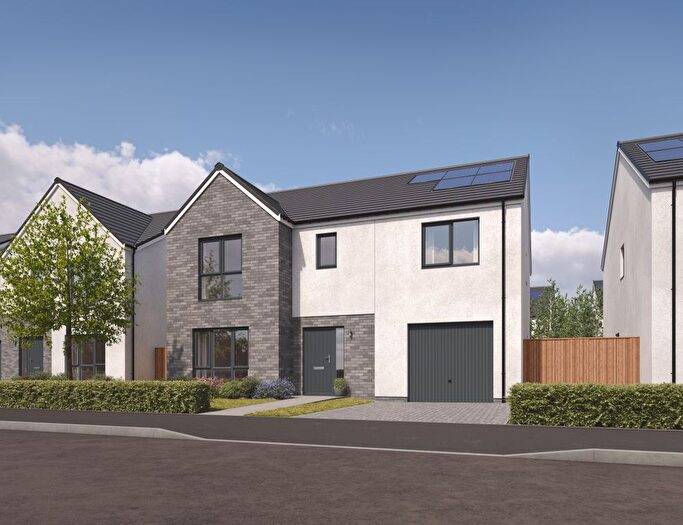
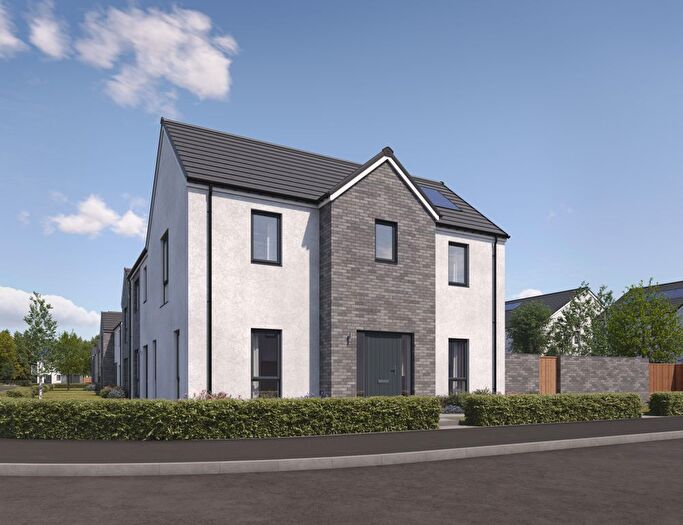
![]()
If you are looking to sell your house, let it out, or receive a property valuation, an expert can help you.
Click the button below to get started.
Neighbourhoods in Inverurie
Navigate through our locations to find the location of your next house in Inverurie, Aberdeenshire for sale or to rent.
Transport in Inverurie
Please see below transportation links in this area:

- FAQ
- Price Paid By Year
Frequently asked questions about Inverurie
What is the average price for a property for sale in Inverurie?
The average price for a property for sale in Inverurie is £218,453. This amount is 9% higher than the average price in Aberdeenshire. There are 2,442 property listings for sale in Inverurie.
What locations have the most expensive properties for sale in Inverurie?
The locations with the most expensive properties for sale in Inverurie are Westhill and District at an average of £323,610, East Garioch at an average of £244,237 and Huntly, Strathbogie and Howe of Alford at an average of £240,833.
What locations have the most affordable properties for sale in Inverurie?
The locations with the most affordable properties for sale in Inverurie are Turriff and District at an average of £191,907, Inverurie and District at an average of £203,544 and West Garioch at an average of £221,624.
Which train stations are available in or near Inverurie?
Some of the train stations available in or near Inverurie are Inverurie, Insch and Dyce.
Property Price Paid in Inverurie by Year
The average sold property price by year was:
| Year | Average Sold Price | Price Change |
Sold Properties
|
|---|---|---|---|
| 2025 | £209,753 | -4% |
271 Properties |
| 2024 | £217,153 | -6% |
240 Properties |
| 2023 | £229,133 | -6% |
250 Properties |
| 2022 | £242,748 | -3% |
703 Properties |
| 2021 | £250,434 | 3% |
784 Properties |
| 2020 | £241,767 | 4% |
514 Properties |
| 2019 | £233,012 | -2% |
700 Properties |
| 2018 | £237,910 | -1% |
656 Properties |
| 2017 | £240,494 | -0,2% |
598 Properties |
| 2016 | £240,960 | -10% |
641 Properties |
| 2015 | £266,259 | 4% |
827 Properties |
| 2014 | £256,161 | 6% |
883 Properties |
| 2013 | £240,842 | 3% |
785 Properties |
| 2012 | £233,172 | 1% |
743 Properties |
| 2011 | £230,650 | 4% |
606 Properties |
| 2010 | £221,920 | 9% |
669 Properties |
| 2009 | £201,863 | -33% |
660 Properties |
| 2008 | £268,483 | 17% |
558 Properties |
| 2007 | £223,556 | 26% |
717 Properties |
| 2006 | £164,913 | 14% |
770 Properties |
| 2005 | £142,258 | -0,1% |
826 Properties |
| 2004 | £142,399 | 27% |
775 Properties |
| 2003 | £104,116 | -6% |
751 Properties |
| 2002 | £110,559 | 16% |
901 Properties |
| 2001 | £92,884 | - |
47 Properties |