
Houses for sale in Aberdeen, Aberdeenshire
House Prices in Aberdeen
Properties in Aberdeen have an average house price of £216k and had 542 Property Transactions within the last 3 years.¹
Aberdeen is an area in Aberdeenshire with 8,858 households², where the most expensive property was sold for £730k.
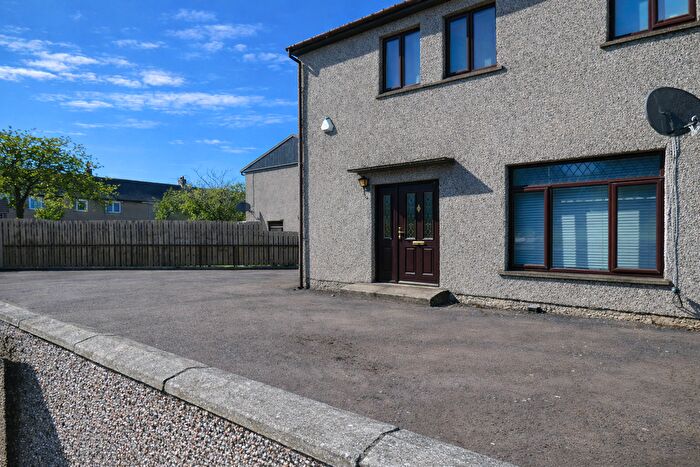
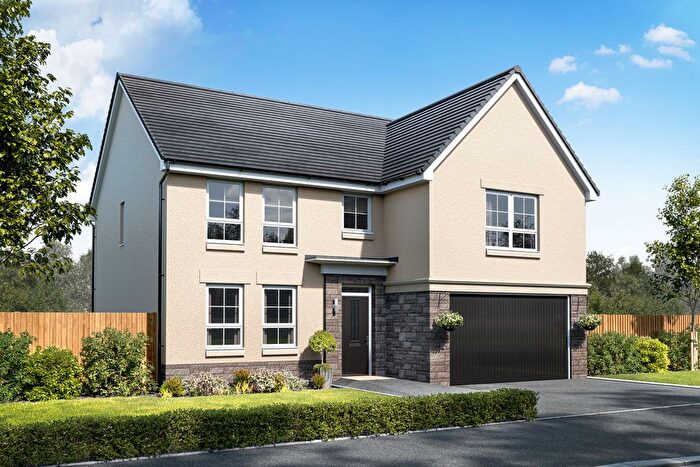
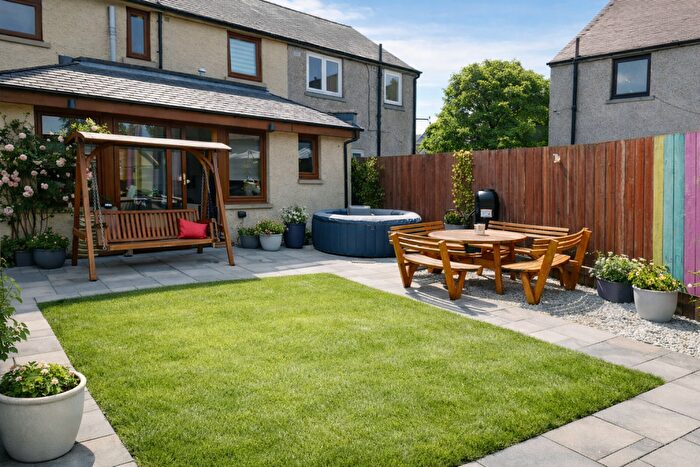
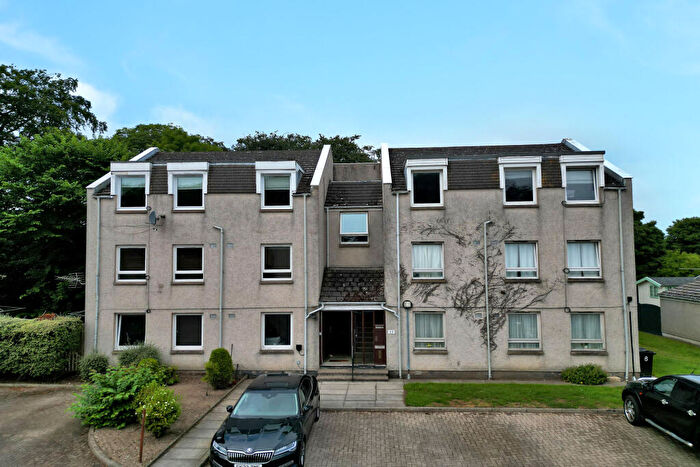
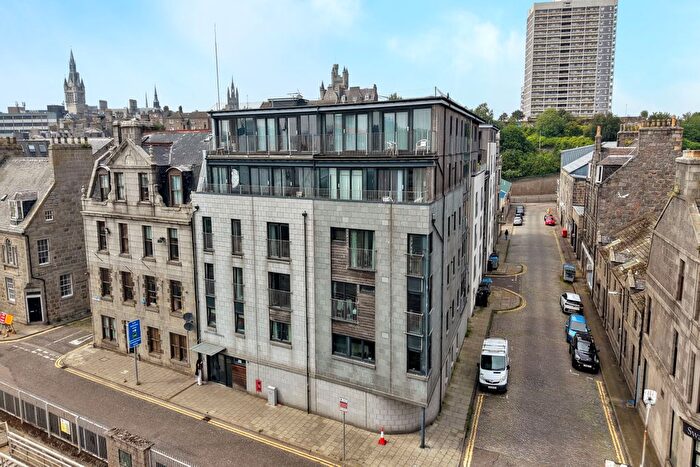
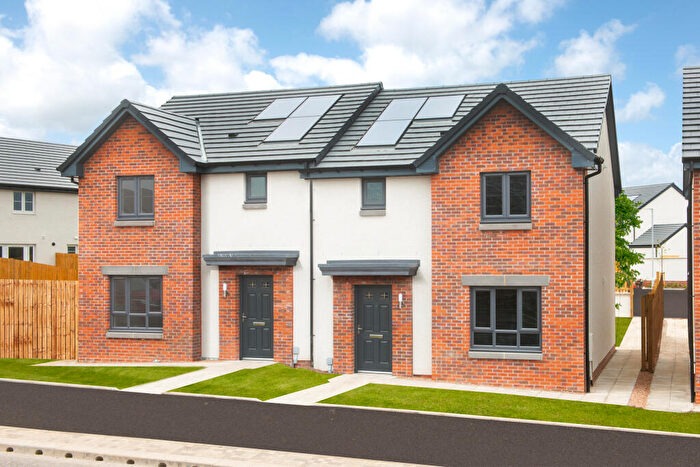
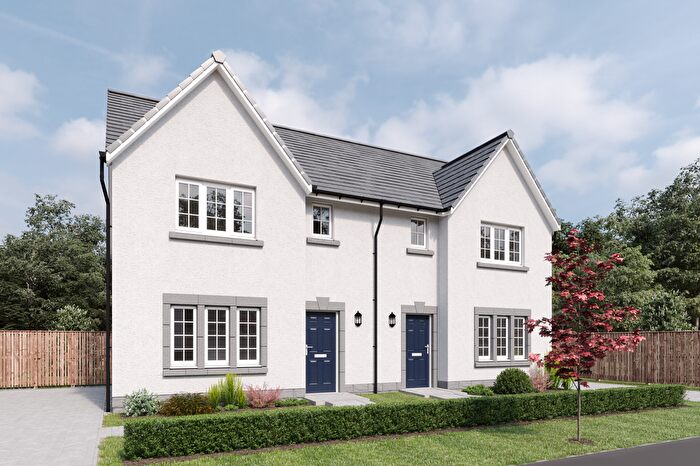
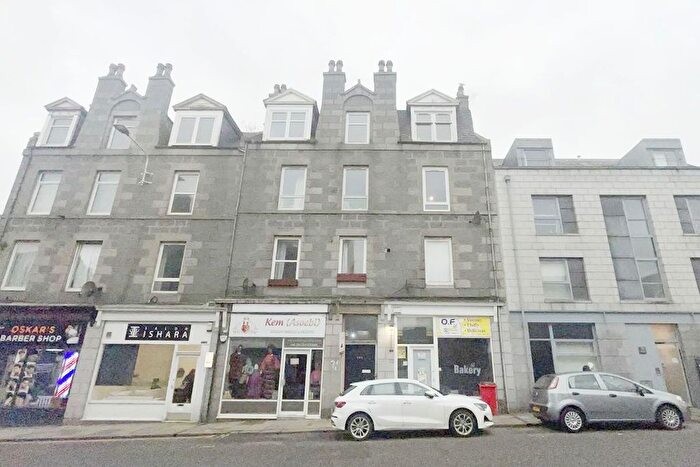
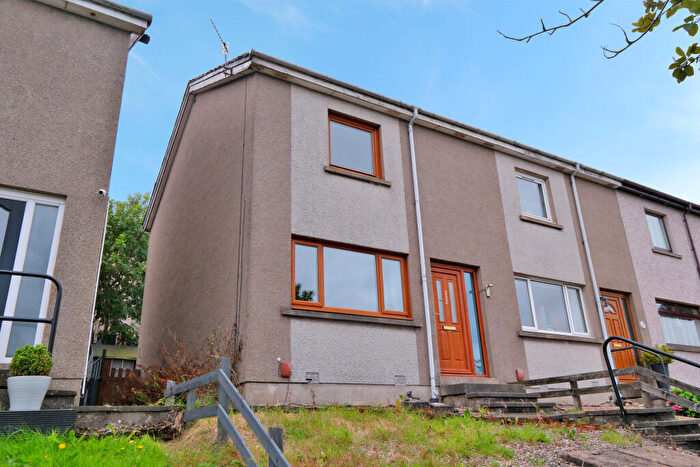
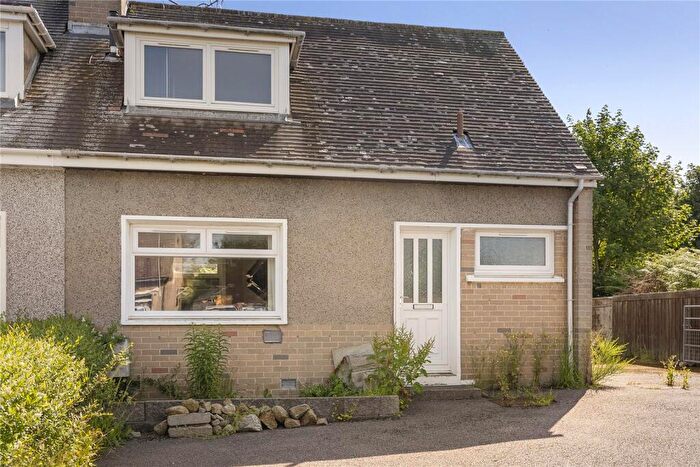
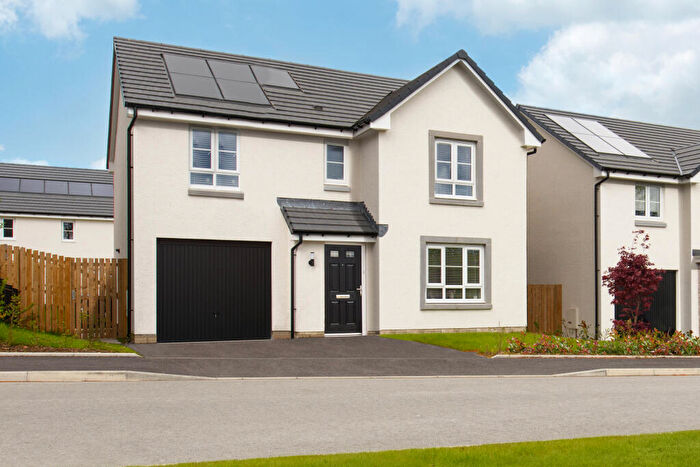
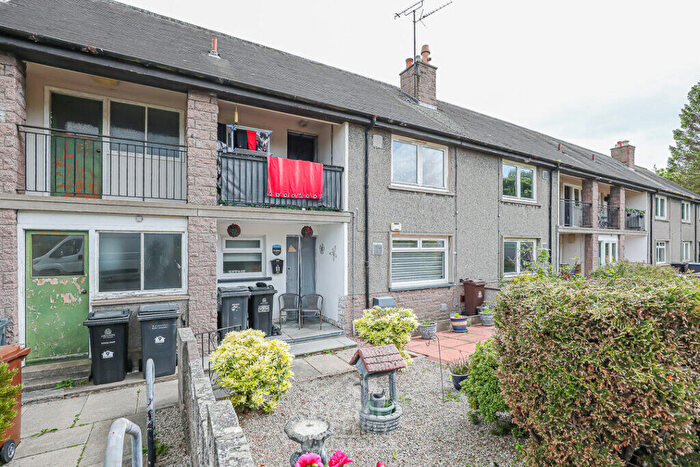
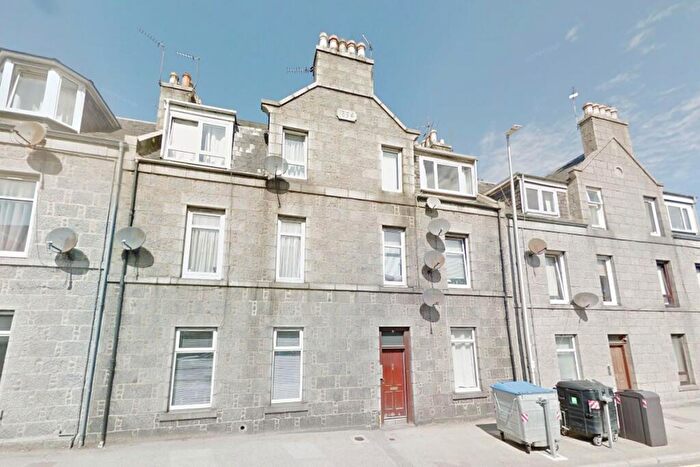
Properties for sale in Aberdeen

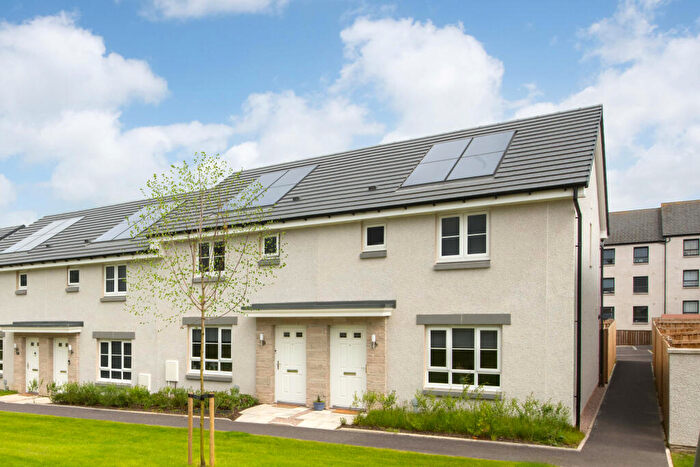
![]()
If you are looking to sell your house, let it out, or receive a property valuation, an expert can help you.
Click the button below to get started.

Neighbourhoods in Aberdeen
Navigate through our locations to find the location of your next house in Aberdeen, Aberdeenshire for sale or to rent.
Property price trends in Aberdeen
According to the latest Registers of Scotland data, the average home in Aberdeen sold for £213,632 in 2025. That figure comes from a substantial record of 11,190 sales logged over the past 24 years.
Prices have fallen back over the last three years. Compared with 2022, when the typical sale came in around £238,176, that's a fall of roughly 10.3%.
Looking back five years, average prices are down about 6.3% since 2020, a drop of around £14,315 in cash terms.
Zoom out to the past decade for the fuller picture. Back in 2015, homes here averaged £271,223, so the typical sold price has fallen about 21.2% since then, around 2.4% a year lower. Stretch the view to fifteen years and that annual pace holds at about -2.4%.
Frequently asked questions about Aberdeen
What is the average price for a property for sale in Aberdeen?
The average price for a property for sale in Aberdeen is £215,938. This amount is 8% higher than the average price in Aberdeenshire. There are 5,281 property listings for sale in Aberdeen.
What locations have the most expensive properties for sale in Aberdeen?
The locations with the most expensive properties for sale in Aberdeen are East Garioch at an average of £234,229 and Mid Formartine at an average of £231,250.
What locations have the most affordable properties for sale in Aberdeen?
The location with the most affordable properties for sale in Aberdeen is North Kincardine at an average of £197,088.
Which train stations are available in or near Aberdeen?
Some of the train stations available in or near Aberdeen are Dyce, Aberdeen and Portlethen.
Property Price Paid in Aberdeen by Year
The average sold property price by year was:
| Year | Average Sold Price | Price Change |
Sold Properties
|
|---|---|---|---|
| 2025 | £213,632 | 1% |
203 Properties |
| 2024 | £212,276 | -5% |
173 Properties |
| 2023 | £222,574 | -7% |
166 Properties |
| 2022 | £238,176 | -1% |
395 Properties |
| 2021 | £239,660 | 5% |
496 Properties |
| 2020 | £227,947 | -2% |
323 Properties |
| 2019 | £232,464 | -5% |
385 Properties |
| 2018 | £244,076 | 5% |
394 Properties |
| 2017 | £231,304 | -7% |
397 Properties |
| 2016 | £248,570 | -9% |
357 Properties |
Transport in Aberdeen
Please see below transportation links in this area:
