
Houses for sale & to rent in DD10 0HJ, West Brae, Mearns, Montrose
House Prices in DD10 0HJ, West Brae, Mearns
Properties in DD10 0HJ have an average house price of £600,000.00 and had 1 Property Transaction within the last 3 years.¹ DD10 0HJ is a postcode in West Brae located in Mearns, an area in Montrose, Aberdeenshire, with 5 households², where the most expensive property was sold for £600,000.00.
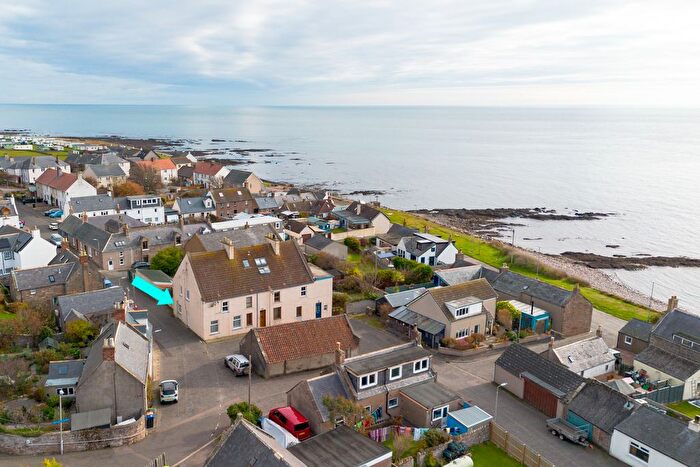
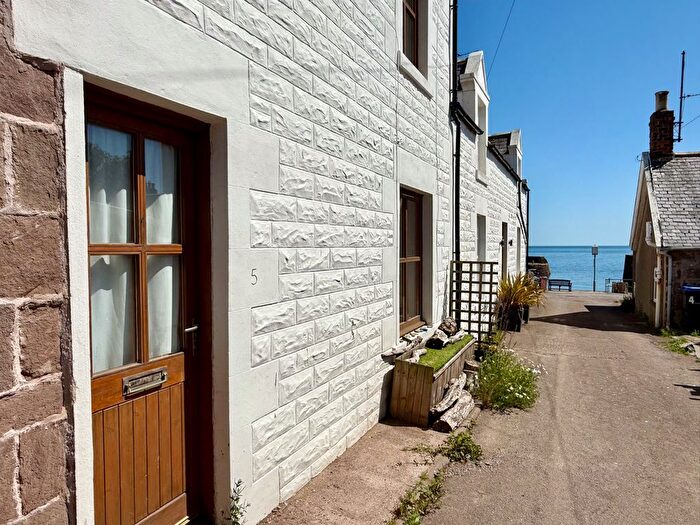
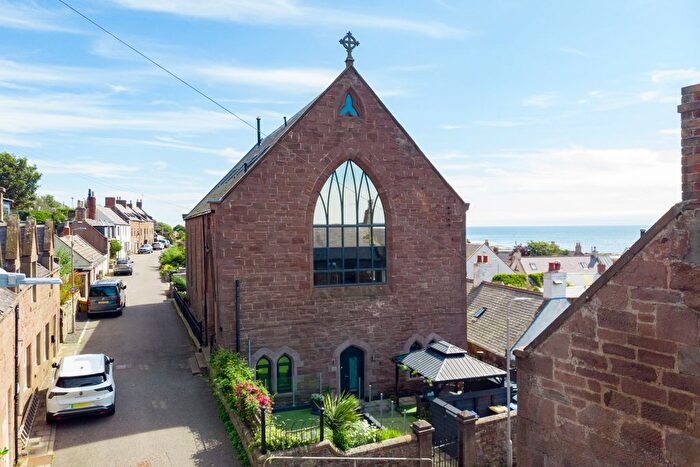
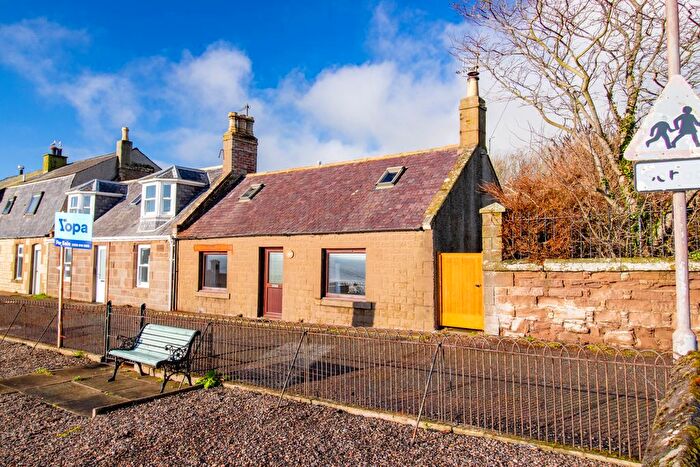
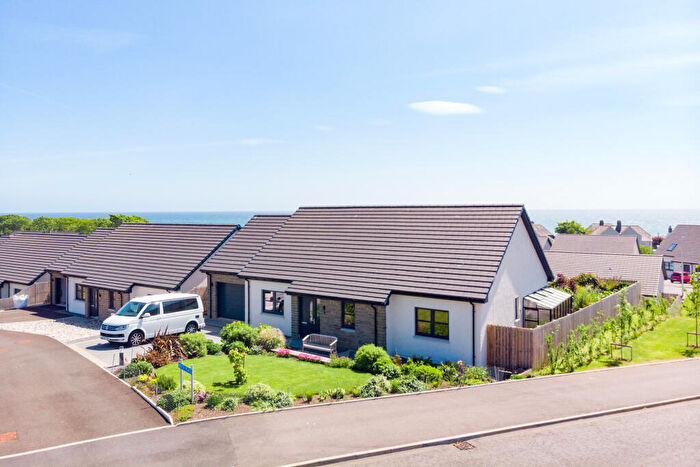
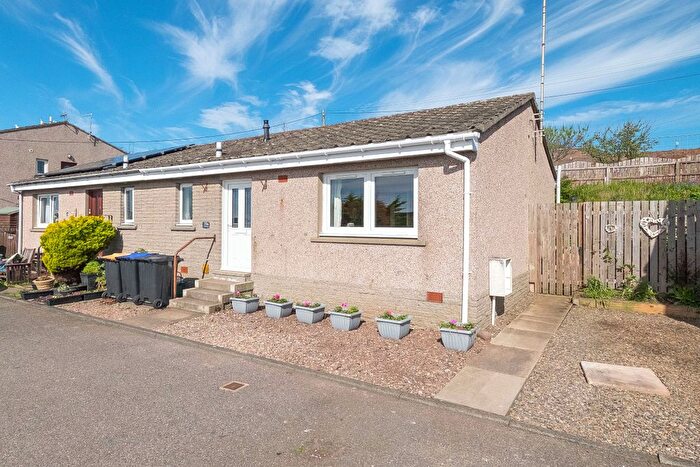
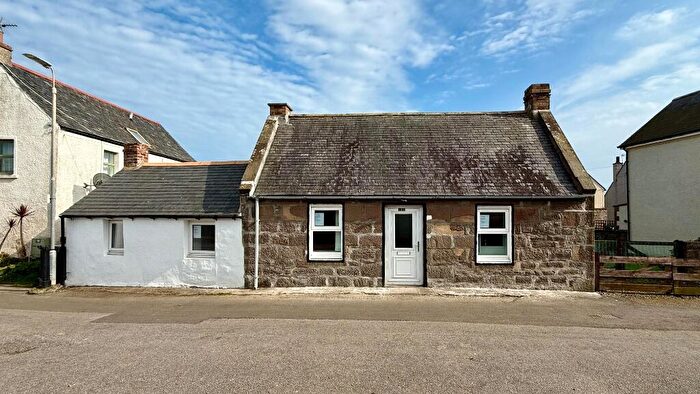
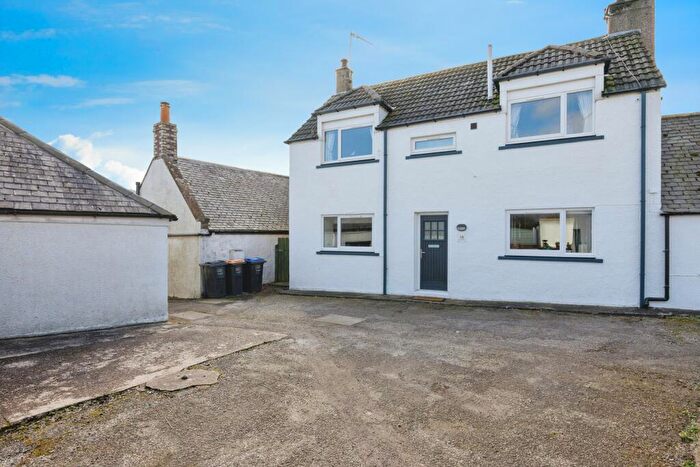
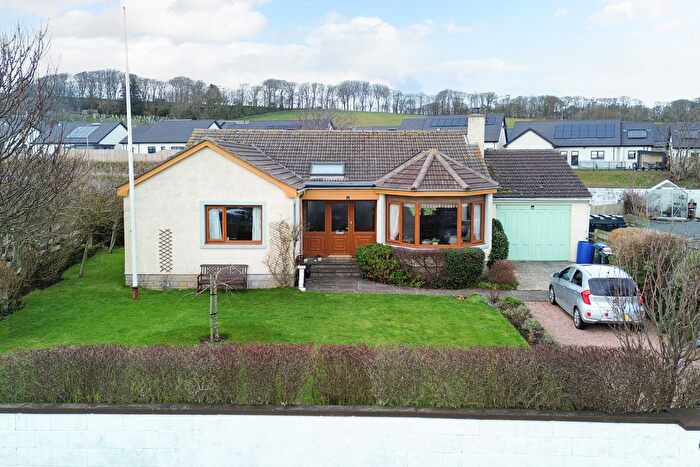
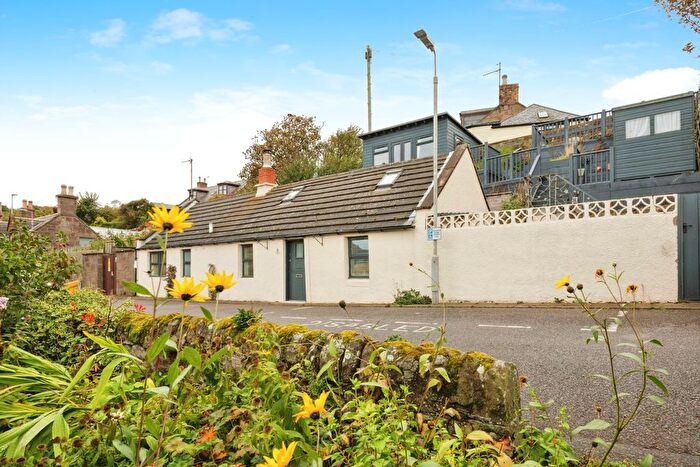
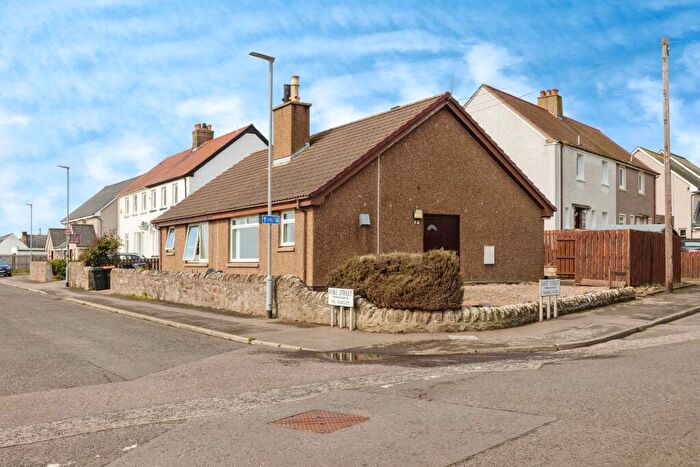
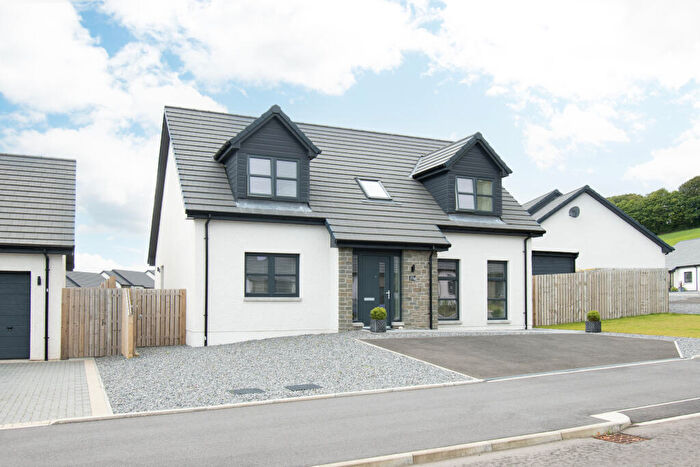
Previously listed properties near DD10 0HJ, West Brae

![]()
If you are looking to sell your house, let it out, or receive a property valuation, an expert can help you.
Click the button below to get started.


Price Paid in West Brae, DD10 0HJ, Mearns
Springfield West Brae, DD10 0HJ, Mearns Montrose
Property Springfield has been sold 5 times. The last time it was sold was in 21/10/2022 and the sold price was £600,000.00.
This is a Property which was sold as an Established Building in 21/10/2022
| Date | Price | Classification |
|---|---|---|
| 21/10/2022 | £600,000.00 | Established Building |
| 05/07/2019 | £470,000.00 | Established Building |
| 10/08/2010 | £445,000.00 | Established Building |
| 05/11/2007 | £415,000.00 | Established Building |
| 28/11/2003 | £125,000.00 | Established Building |
West Brae Johnshaven West Brae, DD10 0HJ, Mearns Montrose
Property West Brae Johnshaven has been sold 2 times. The last time it was sold was in 10/08/2011 and the sold price was £390,000.00.
This is a Property which was sold as an Established Building in 10/08/2011
| Date | Price | Classification |
|---|---|---|
| 10/08/2011 | £390,000.00 | Established Building |
| 24/07/2002 | £131,500.00 | Established Building |
3 West Brae, DD10 0HJ, Mearns Montrose
Property 3 has been sold 1 time. The last time it was sold was in 24/12/2002 and the sold price was £85,000.00.
This is a Property which was sold as an Established Building in 24/12/2002
| Date | Price | Classification |
|---|---|---|
| 24/12/2002 | £85,000.00 | Established Building |
Transport near DD10 0HJ, West Brae

House price paid reports for DD10 0HJ, West Brae
Click on the buttons below to see price paid reports by year or property price:
- Price Paid By Year
Property Price Paid in DD10 0HJ, West Brae by Year
The average sold property price by year was:
| Year | Average Sold Price | Price Change |
Sold Properties
|
|---|---|---|---|
| 2022 | £600,000 | 22% |
1 Property |
| 2019 | £470,000 | 17% |
1 Property |
| 2011 | £390,000 | -14% |
1 Property |
| 2010 | £445,000 | 7% |
1 Property |
| 2007 | £415,000 | 70% |
1 Property |
| 2003 | £125,000 | 13% |
1 Property |
| 2002 | £108,250 | - |
2 Properties |