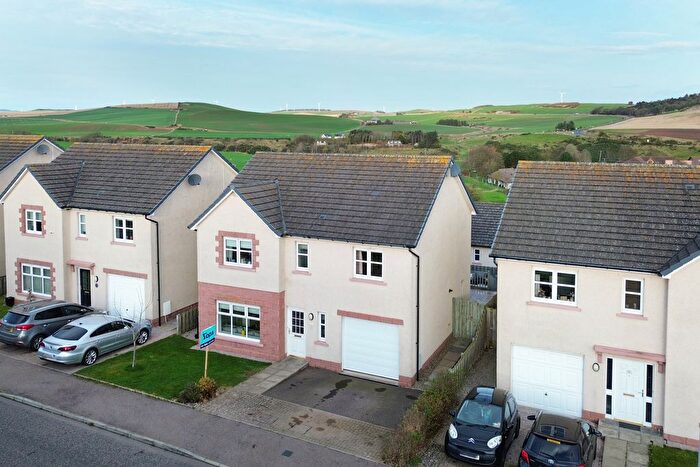
Houses for sale & to rent in Mearns, Stonehaven
House Prices in Mearns
Properties in Mearns have an average house price of £188,014.00 and had 7 Property Transactions within the last 3 years¹.
Mearns is an area in Stonehaven, Aberdeenshire with 409 households², where the most expensive property was sold for £252,500.00.
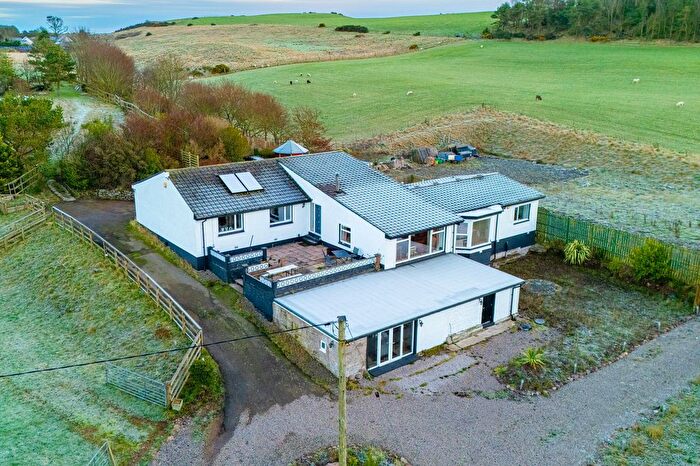
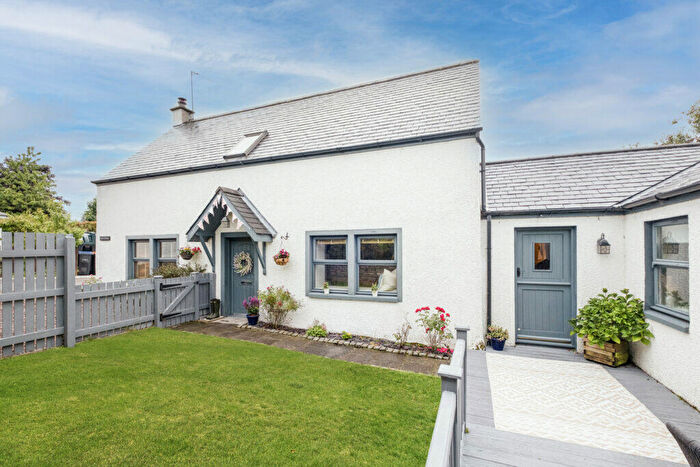
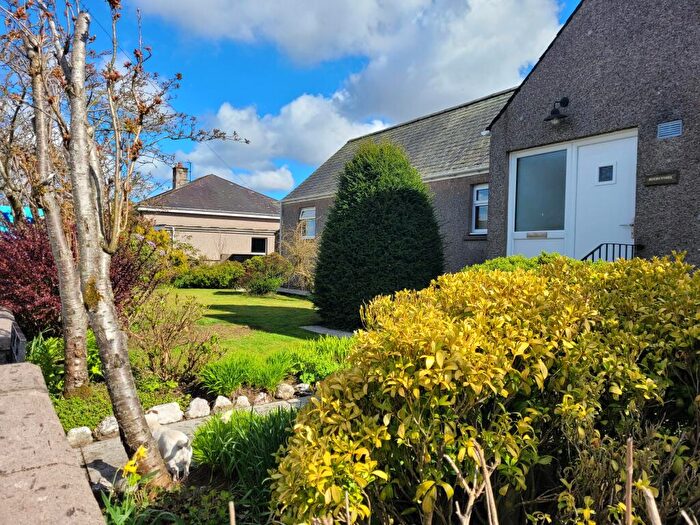
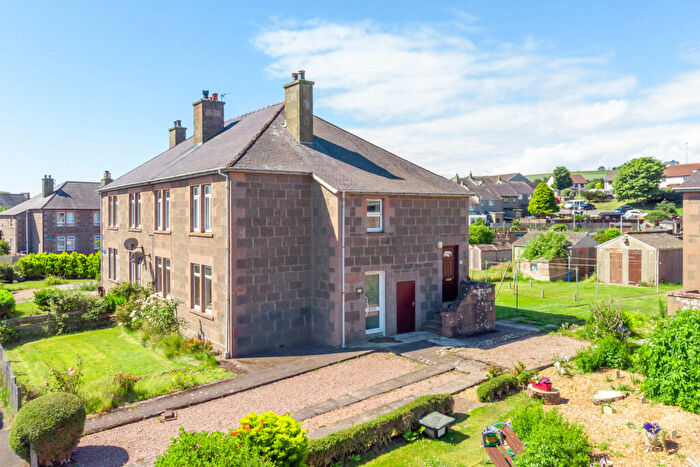
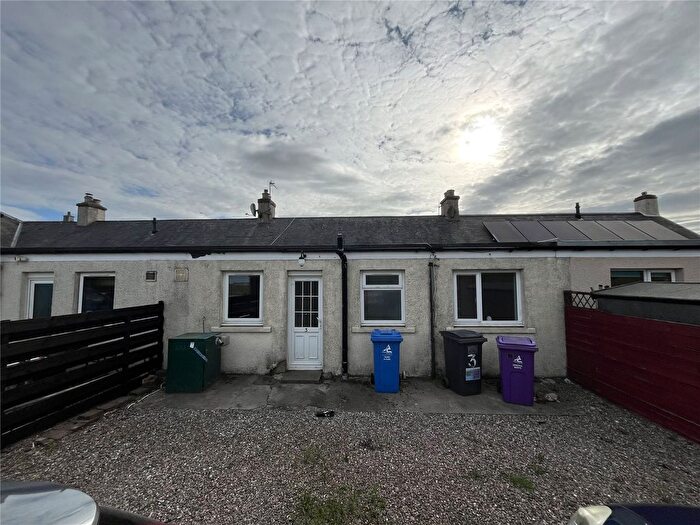
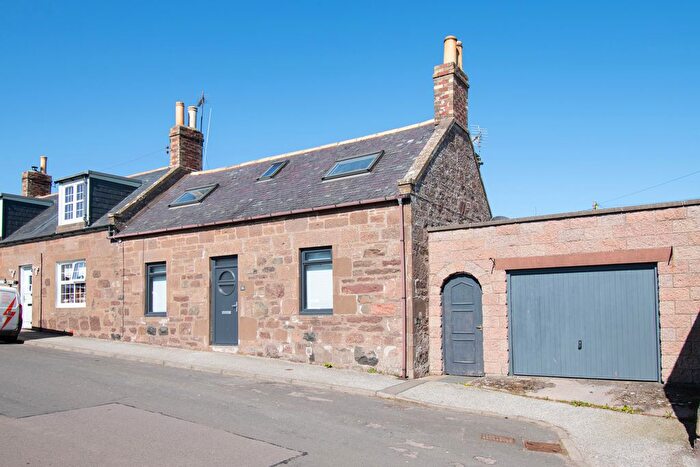
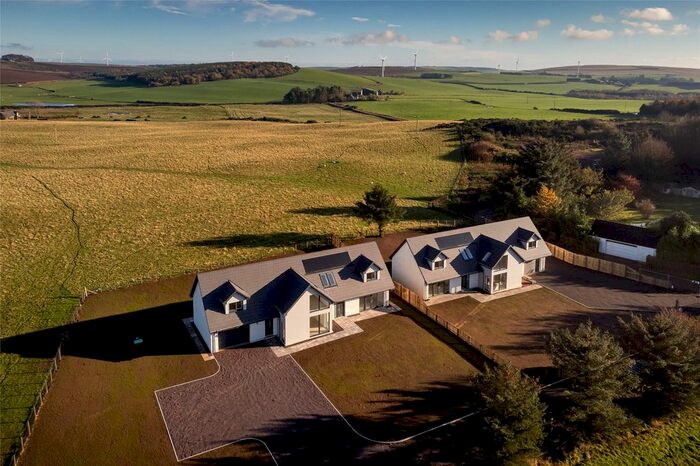
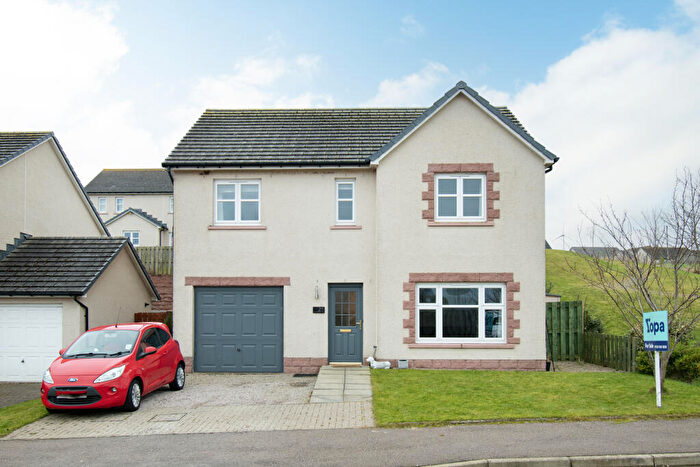
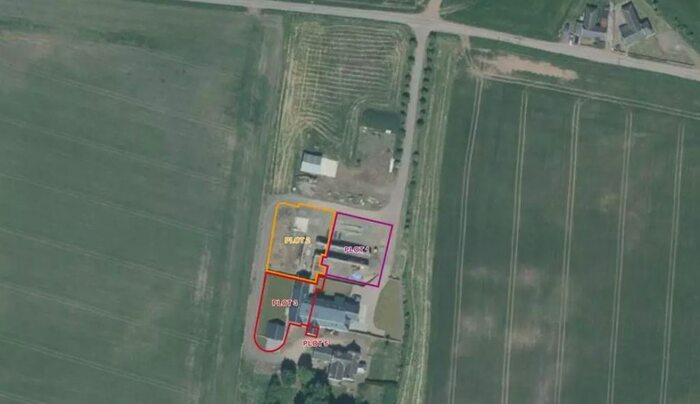
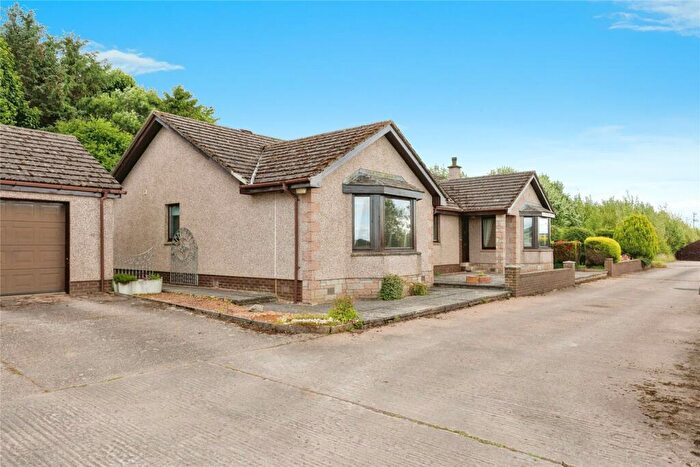
Properties for sale in Mearns
Previously listed properties in Mearns
Roads and Postcodes in Mearns
Navigate through our locations to find the location of your next house in Mearns, Stonehaven for sale or to rent.
| Streets | Postcodes |
|---|---|
| Burnside Croft | AB39 3UH |
| Glenbervie Road | AB39 3YU |
| High Street | AB39 3YZ |
| Kinmonth Road | AB39 3YF |
| Rolland Court | AB39 3YY |
| Rolland Place | AB39 3YX |
| Rolland Road | AB39 3YW |
| Station Road | AB39 3YT |
| Trelong Row | AB39 2UF |
| AB39 2TX AB39 2TY AB39 2UA AB39 2UB AB39 2UD AB39 2UE AB39 2UH AB39 2UJ AB39 2UL AB39 2UN AB39 2XT AB39 2XU AB39 2XX AB39 3UX AB39 3UY AB39 3XA AB39 3YA AB39 3YB AB39 3YD AB39 3YE AB39 3YG AB39 3YH AB39 3YJ AB39 3YL AB39 3YN AB39 3YP AB39 3YQ AB39 3YR AB39 3YS AB39 3ZF |
Transport near Mearns
- FAQ
- Price Paid By Year
Frequently asked questions about Mearns
What is the average price for a property for sale in Mearns?
The average price for a property for sale in Mearns is £188,014. This amount is 15% lower than the average price in Stonehaven. There are 47 property listings for sale in Mearns.
What streets have the most expensive properties for sale in Mearns?
The streets with the most expensive properties for sale in Mearns are Rolland Court at an average of £250,000 and Station Road at an average of £229,250.
What streets have the most affordable properties for sale in Mearns?
The street with the most affordable properties for sale in Mearns is High Street at an average of £105,050.
Which train stations are available in or near Mearns?
Some of the train stations available in or near Mearns are Stonehaven, Laurencekirk and Portlethen.
Property Price Paid in Mearns by Year
The average sold property price by year was:
| Year | Average Sold Price | Price Change |
Sold Properties
|
|---|---|---|---|
| 2025 | £204,800 | 2% |
2 Properties |
| 2024 | £200,333 | 24% |
3 Properties |
| 2023 | £152,750 | -123% |
2 Properties |
| 2022 | £340,794 | 15% |
17 Properties |
| 2021 | £289,602 | 6% |
16 Properties |
| 2020 | £272,471 | 4% |
14 Properties |
| 2019 | £261,166 | -5% |
12 Properties |
| 2018 | £274,147 | 2% |
17 Properties |
| 2017 | £268,892 | 24% |
13 Properties |
| 2016 | £203,172 | -140% |
16 Properties |
| 2015 | £487,651 | 35% |
16 Properties |
| 2014 | £318,403 | 12% |
13 Properties |
| 2013 | £278,847 | 9% |
23 Properties |
| 2012 | £254,384 | -5% |
13 Properties |
| 2011 | £266,147 | -9% |
17 Properties |
| 2010 | £290,111 | 9% |
11 Properties |
| 2009 | £263,929 | 14% |
7 Properties |
| 2008 | £225,901 | -5% |
9 Properties |
| 2007 | £236,851 | 30% |
15 Properties |
| 2006 | £166,370 | -27% |
15 Properties |
| 2005 | £210,902 | 51% |
23 Properties |
| 2004 | £104,007 | -4% |
13 Properties |
| 2003 | £107,764 | -7% |
24 Properties |
| 2002 | £114,795 | 97% |
25 Properties |
| 2001 | £3,500 | - |
1 Property |


