
Houses for sale in Stonehaven, Aberdeenshire
House Prices in Stonehaven
Properties in Stonehaven have an average house price of £219k and had 402 Property Transactions within the last 3 years.¹
Stonehaven is an area in Aberdeenshire with 7,237 households², where the most expensive property was sold for £633k.
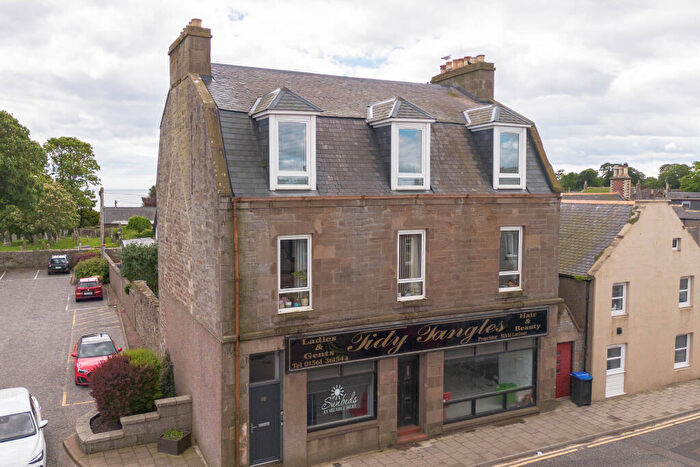
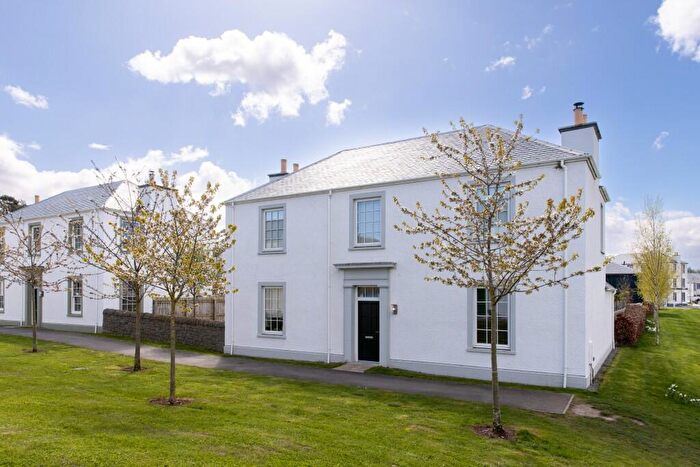
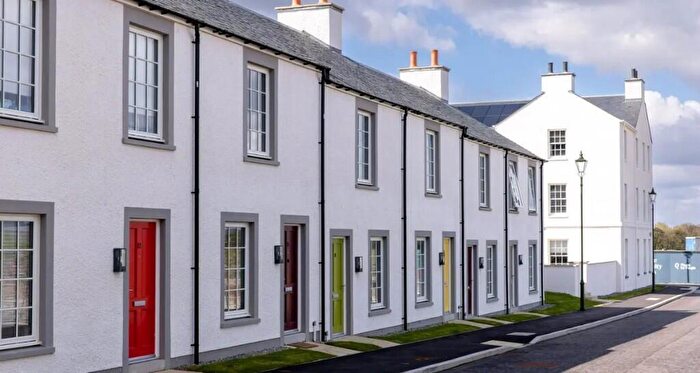
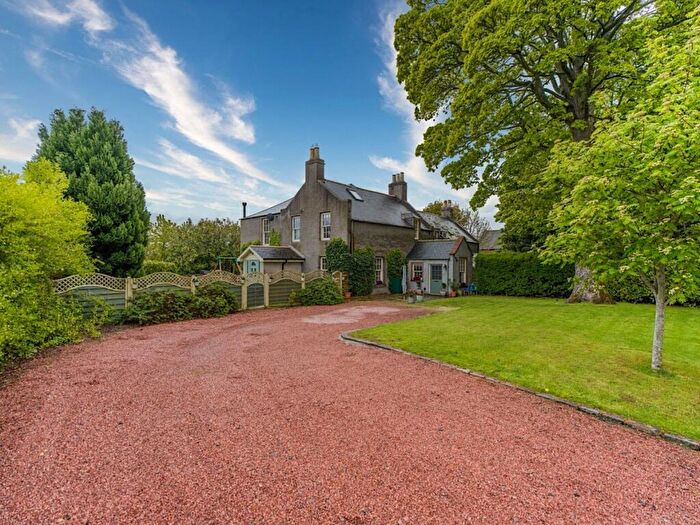
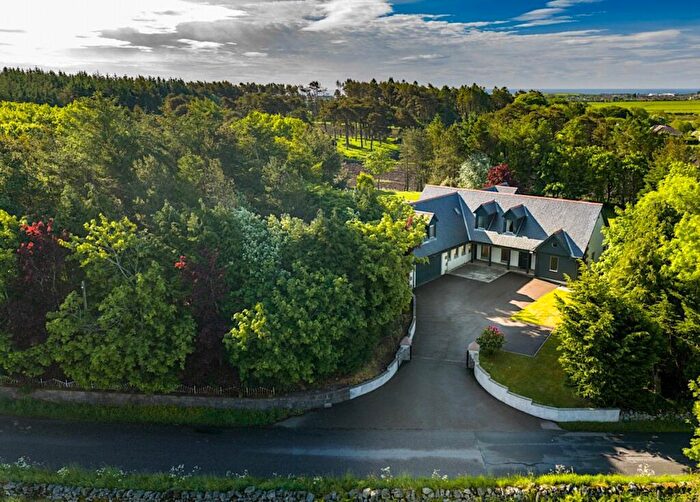
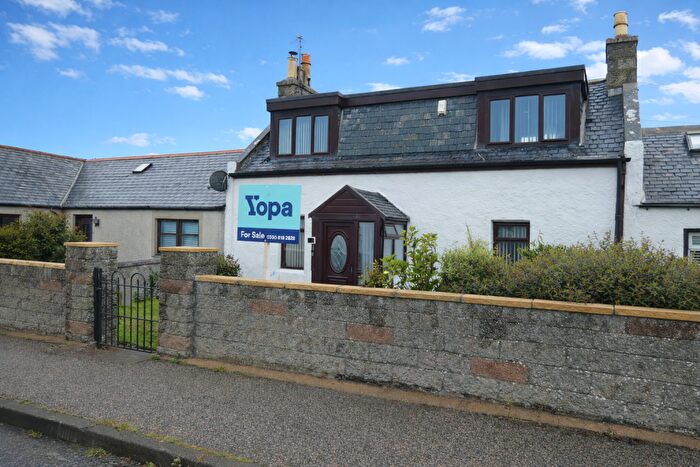
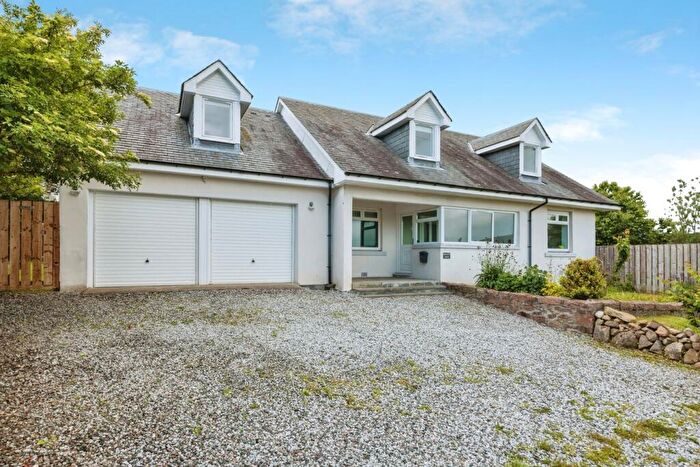
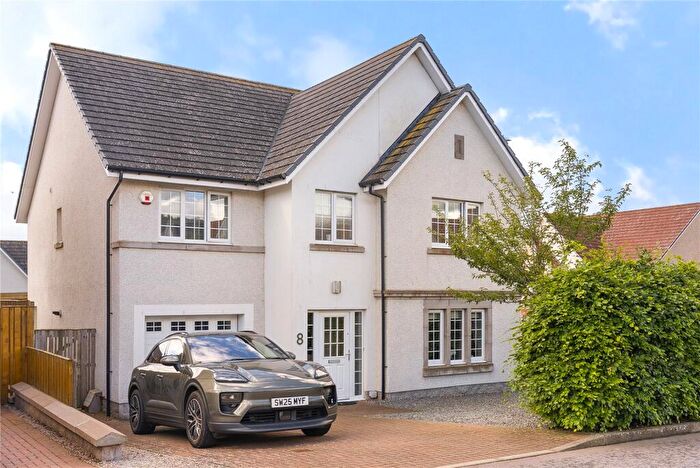
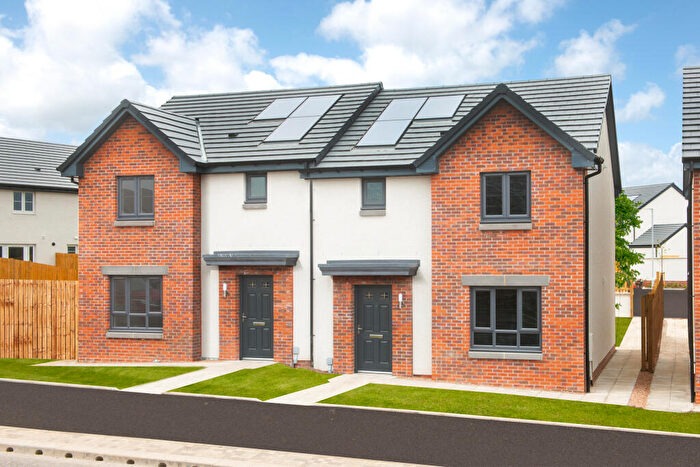
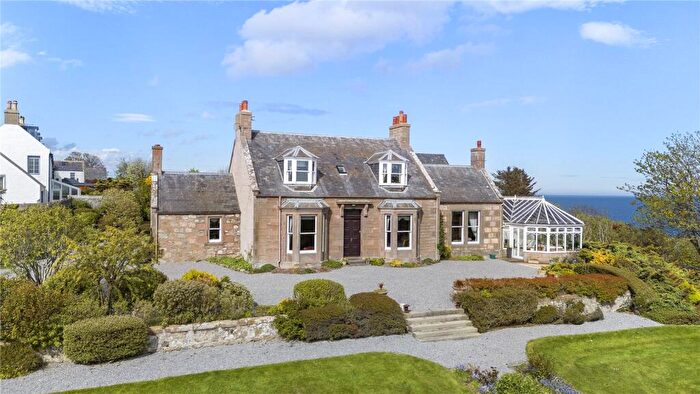
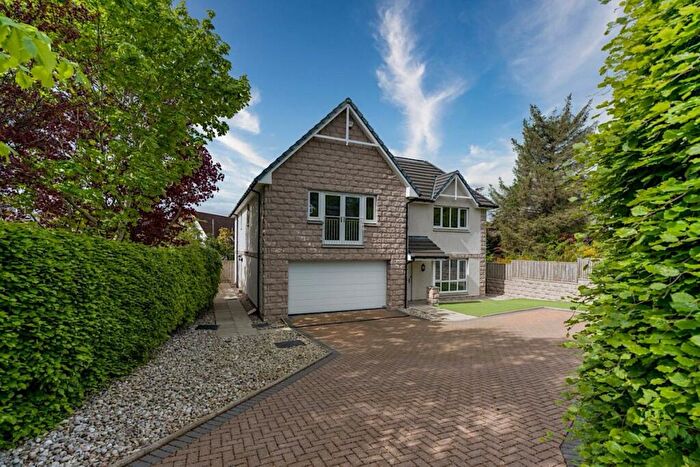
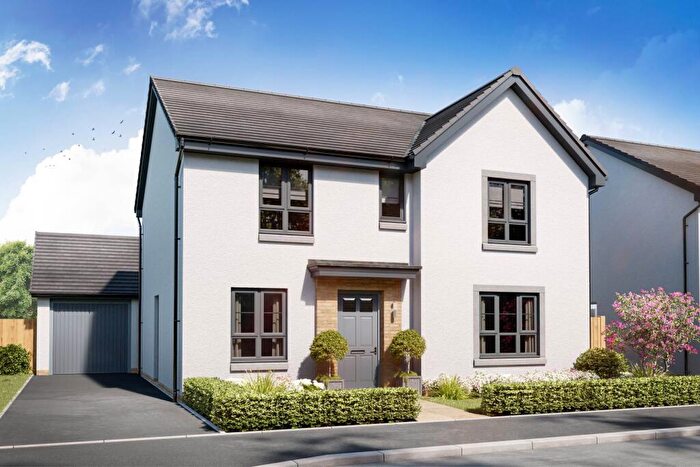
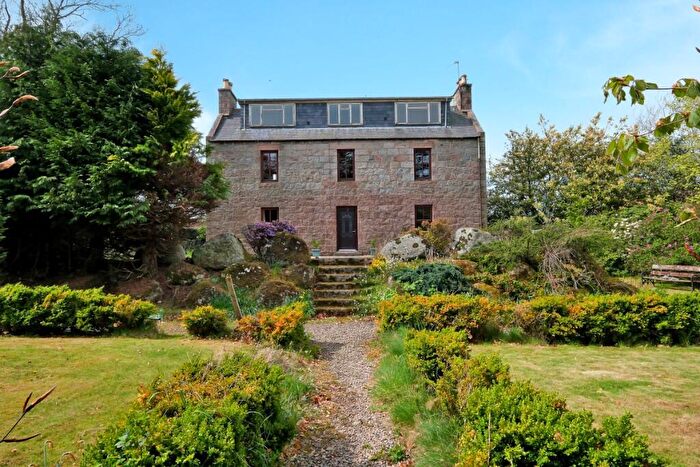
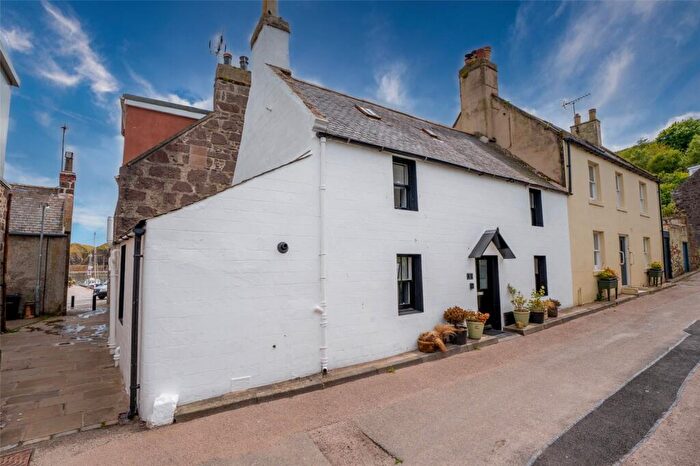
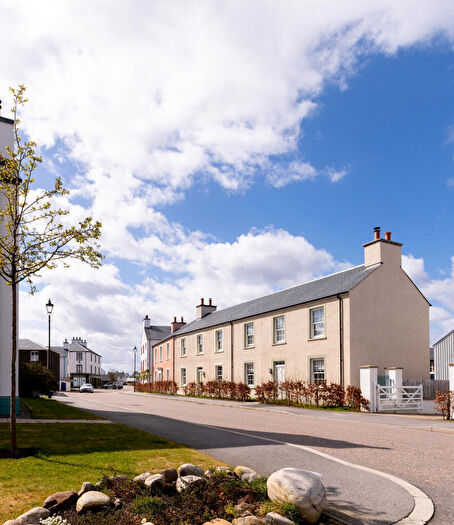
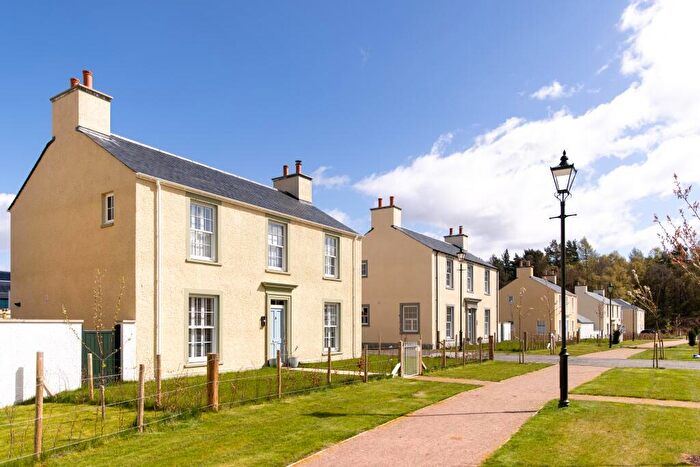
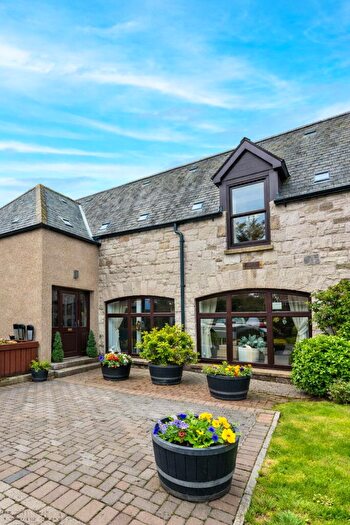
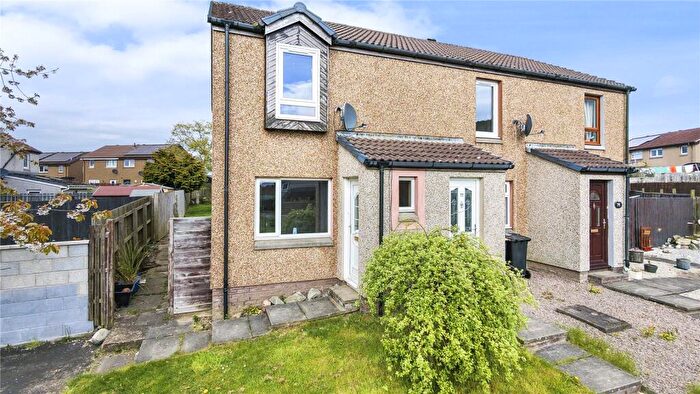
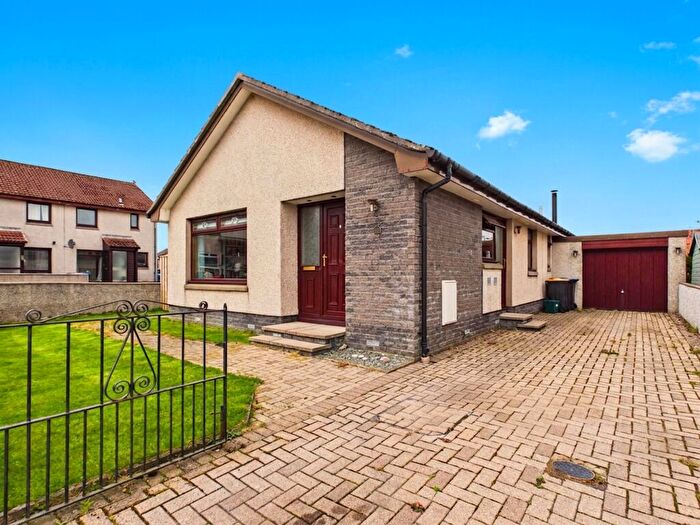
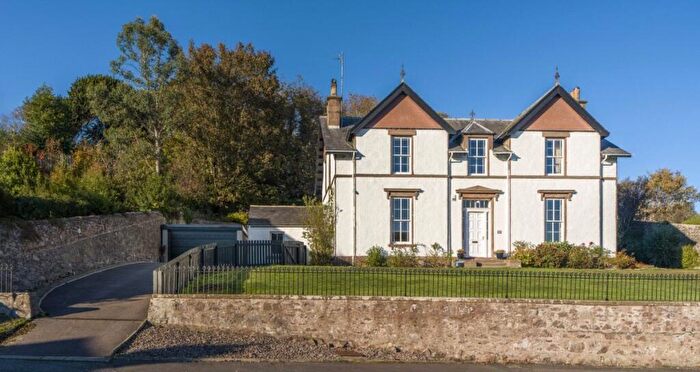
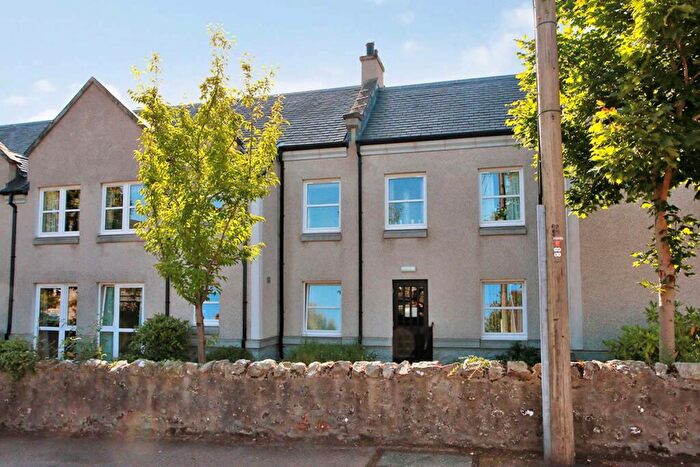
Properties for sale in Stonehaven
![]()
If you are looking to sell your house, let it out, or receive a property valuation, an expert can help you.
Click the button below to get started.

Neighbourhoods in Stonehaven
Navigate through our locations to find the location of your next house in Stonehaven, Aberdeenshire for sale or to rent.
Property price trends in Stonehaven
According to the latest Registers of Scotland data, the average home in Stonehaven sold for £213,535 in 2025. That figure comes from a substantial record of 7,984 sales logged over the past 24 years.
Prices have fallen back over the last three years. Compared with 2022, when the typical sale came in around £261,724, that's a fall of roughly 18.4%.
Looking back five years, average prices are down about 16.1% since 2020, a drop of around £40,892 in cash terms.
Zoom out to the past decade for the fuller picture. Back in 2015, homes here averaged £285,537, so the typical sold price has fallen about 25.2% since then, around 2.9% a year lower. Stretch the view to fifteen years and that annual pace edges up closer to -0.4%.
Frequently asked questions about Stonehaven
What is the average price for a property for sale in Stonehaven?
The average price for a property for sale in Stonehaven is £218,954. This amount is 9% higher than the average price in Aberdeenshire. There are 1,056 property listings for sale in Stonehaven.
What locations have the most expensive properties for sale in Stonehaven?
The locations with the most expensive properties for sale in Stonehaven are North Kincardine at an average of £238,642 and Stonehaven and Lower Deeside at an average of £213,357.
What locations have the most affordable properties for sale in Stonehaven?
The location with the most affordable properties for sale in Stonehaven is Mearns at an average of £188,014.
Which train stations are available in or near Stonehaven?
Some of the train stations available in or near Stonehaven are Stonehaven, Portlethen and Aberdeen.
Property Price Paid in Stonehaven by Year
The average sold property price by year was:
| Year | Average Sold Price | Price Change |
Sold Properties
|
|---|---|---|---|
| 2025 | £213,535 | -10% |
130 Properties |
| 2024 | £235,869 | 11% |
121 Properties |
| 2023 | £210,066 | -25% |
151 Properties |
| 2022 | £261,724 | 1% |
373 Properties |
| 2021 | £259,725 | 2% |
376 Properties |
| 2020 | £254,427 | 3% |
263 Properties |
| 2019 | £245,771 | -1% |
305 Properties |
| 2018 | £247,919 | -8% |
302 Properties |
| 2017 | £268,009 | -3% |
273 Properties |
| 2016 | £276,805 | -3% |
297 Properties |
Transport in Stonehaven
Please see below transportation links in this area:
