
Houses for sale & to rent in Arbroath West, Letham and Friockheim, Forfar
House Prices in Arbroath West, Letham and Friockheim
Properties in Arbroath West, Letham and Friockheim have an average house price of £236,890.00 and had 54 Property Transactions within the last 3 years¹.
Arbroath West, Letham and Friockheim is an area in Forfar, Angus with 1,129 households², where the most expensive property was sold for £510,000.00.
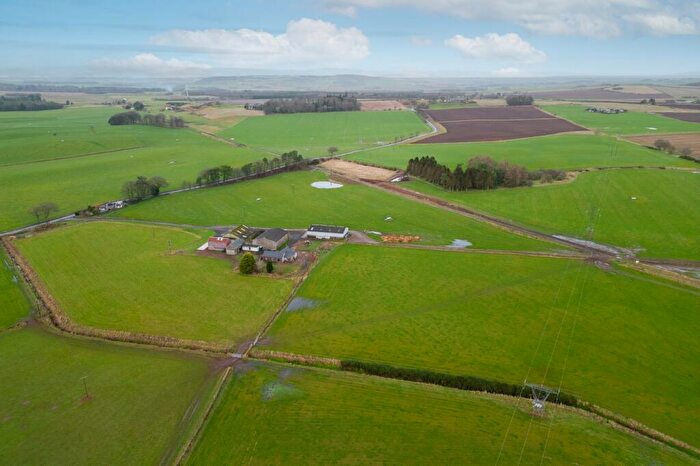
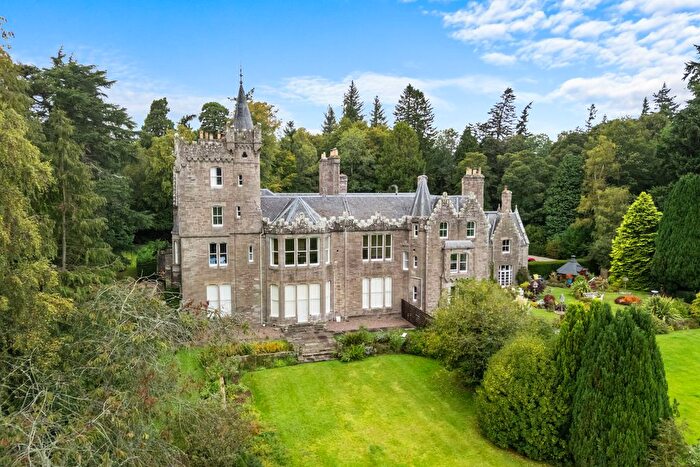
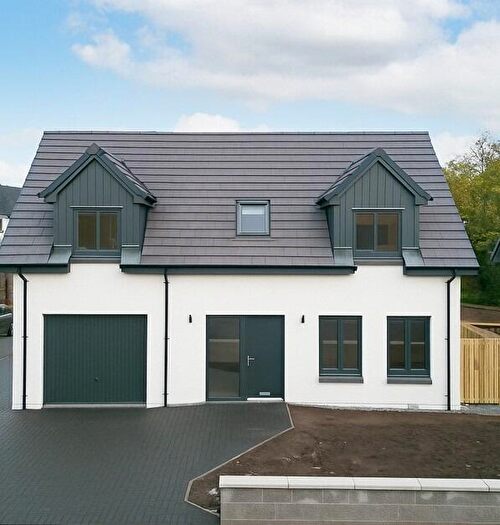
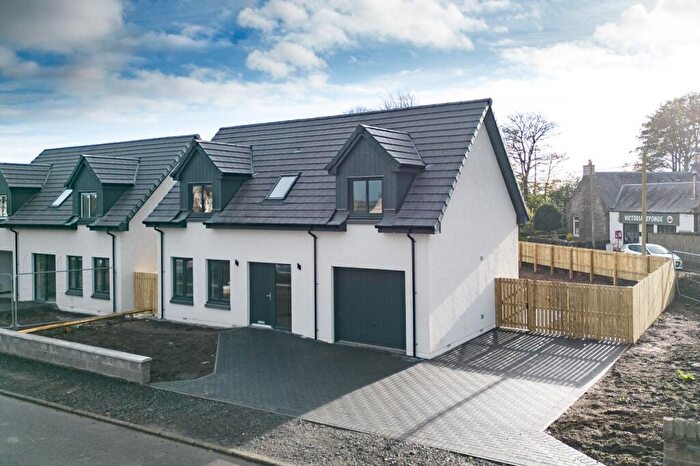
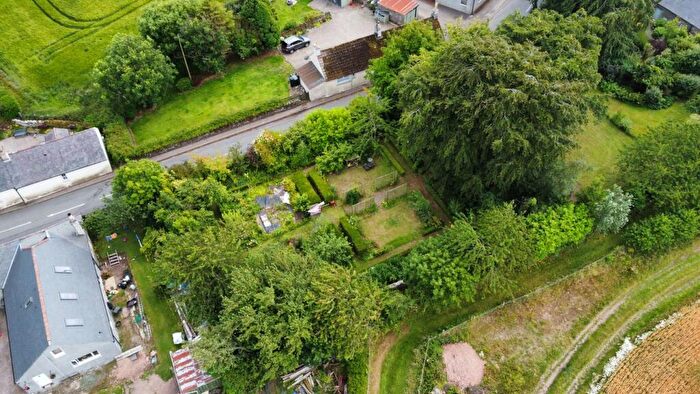
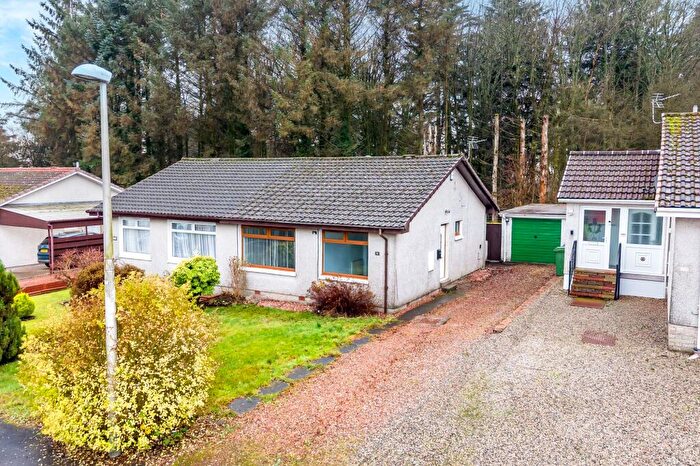
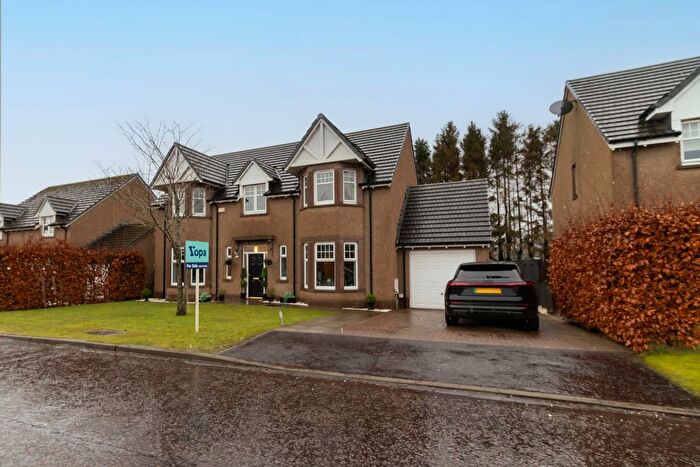
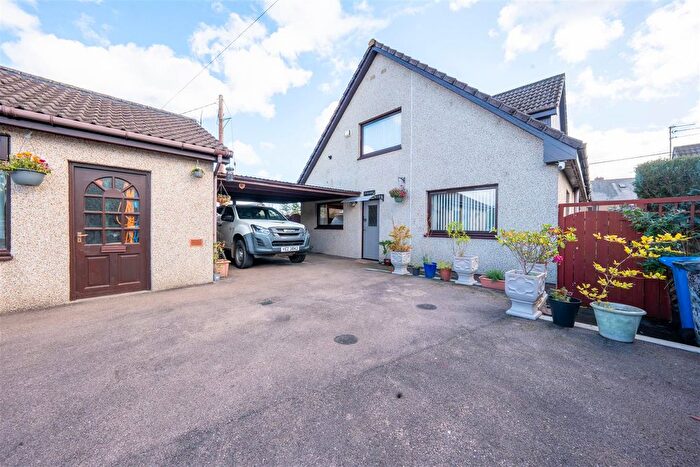
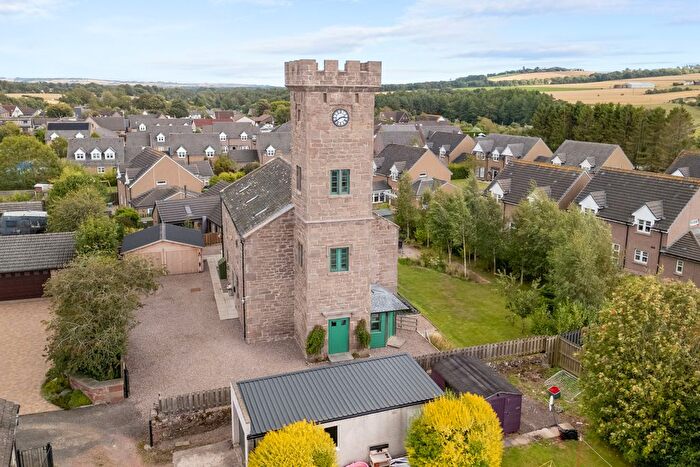
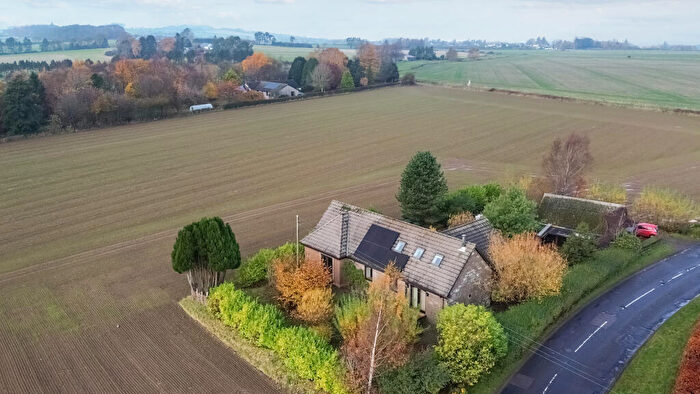
Properties for sale in Arbroath West, Letham and Friockheim

![]()
If you are looking to sell your house, let it out, or receive a property valuation, an expert can help you.
Click the button below to get started.
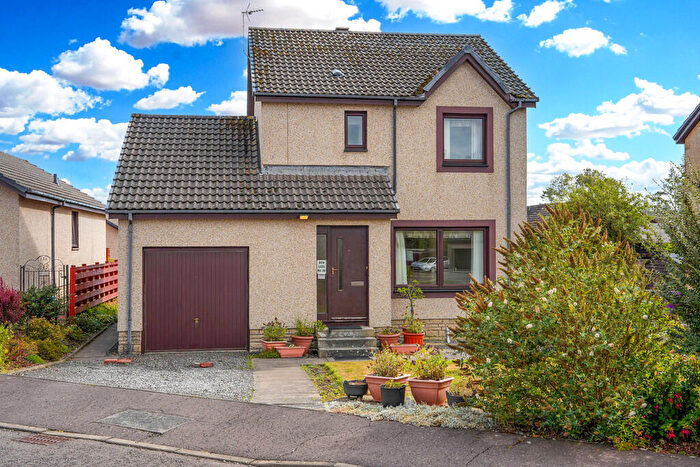
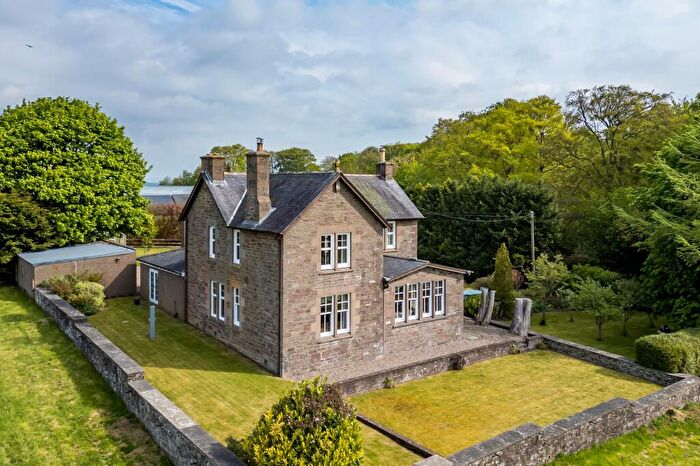
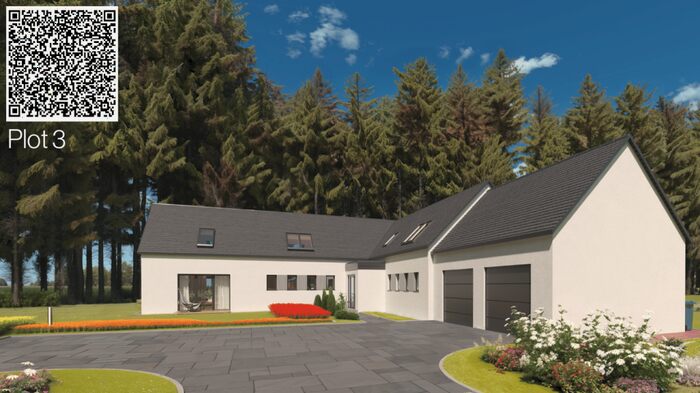
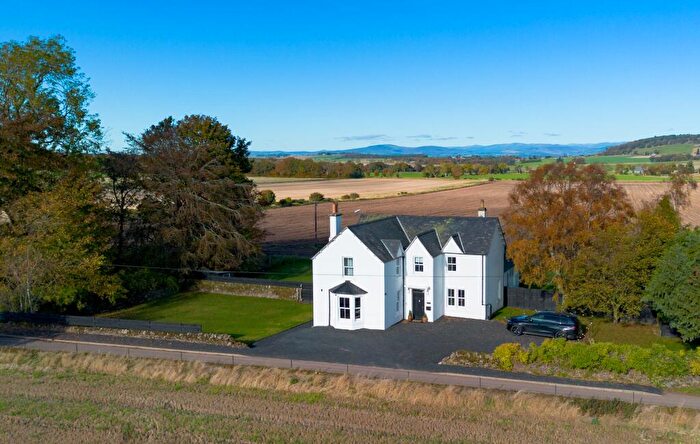
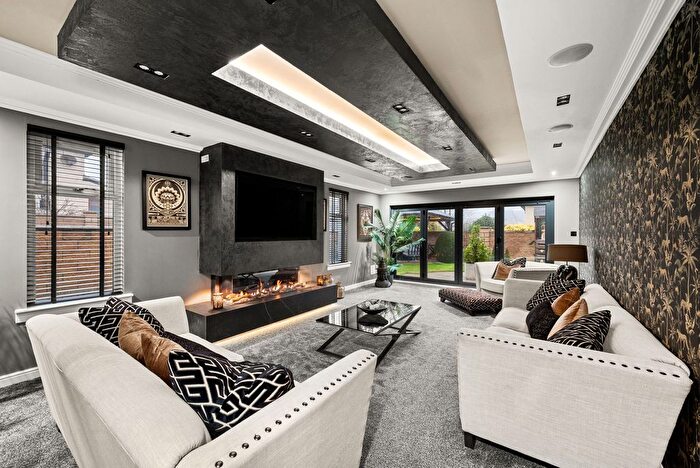
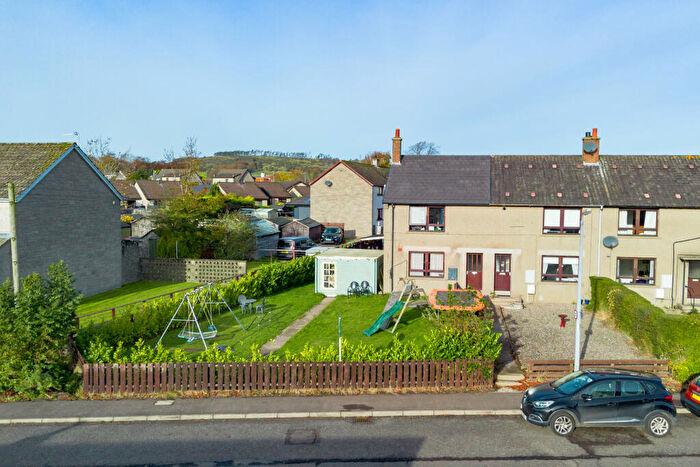
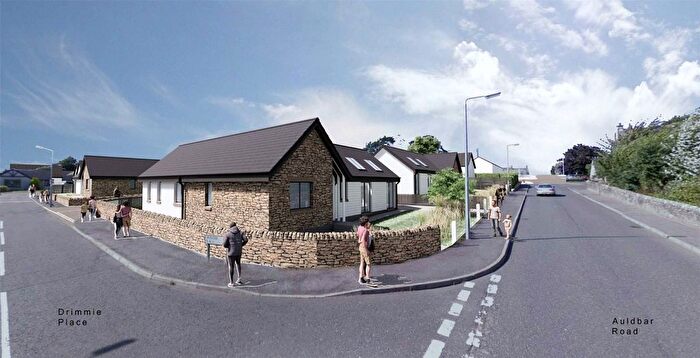
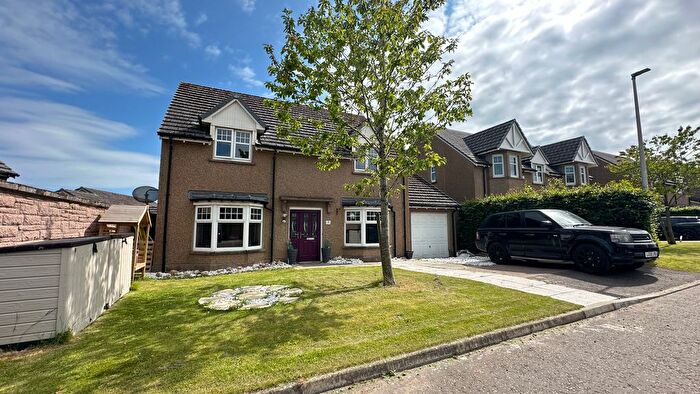
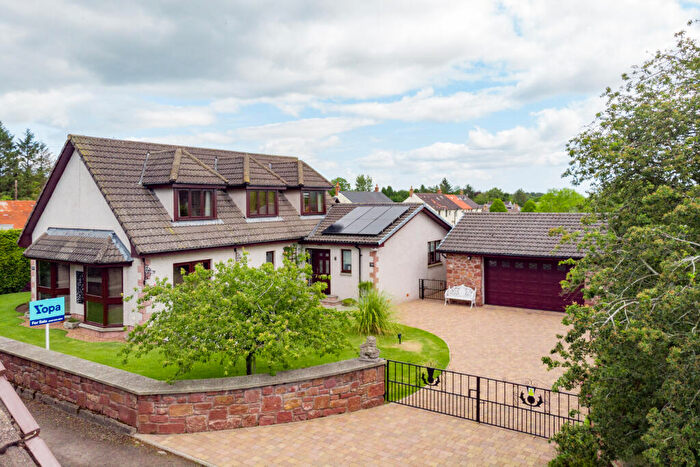
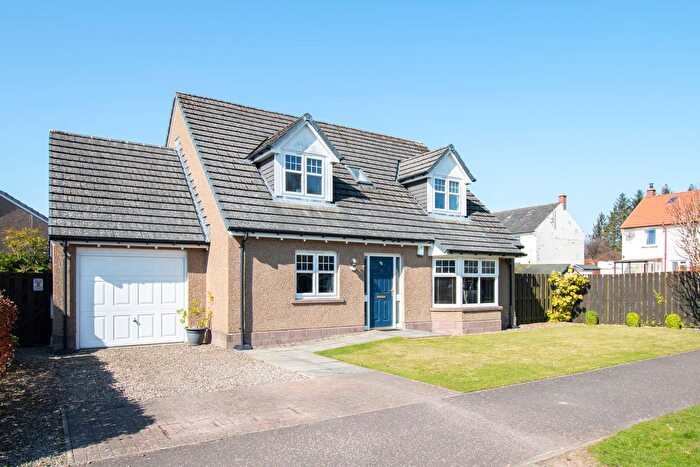
Previously listed properties in Arbroath West, Letham and Friockheim
![]()
If you are looking to sell your house, let it out, or receive a property valuation, an expert can help you.
Click the button below to get started.
Roads and Postcodes in Arbroath West, Letham and Friockheim
Navigate through our locations to find the location of your next house in Arbroath West, Letham and Friockheim, Forfar for sale or to rent.
Transport near Arbroath West, Letham and Friockheim

- FAQ
- Price Paid By Year
Frequently asked questions about Arbroath West, Letham and Friockheim
What is the average price for a property for sale in Arbroath West, Letham and Friockheim?
The average price for a property for sale in Arbroath West, Letham and Friockheim is £236,890. This amount is 30% higher than the average price in Forfar. There are 206 property listings for sale in Arbroath West, Letham and Friockheim.
Which train stations are available in or near Arbroath West, Letham and Friockheim?
Some of the train stations available in or near Arbroath West, Letham and Friockheim are Arbroath, Carnoustie and Golf Street.
Property Price Paid in Arbroath West, Letham and Friockheim by Year
The average sold property price by year was:
| Year | Average Sold Price | Price Change |
Sold Properties
|
|---|---|---|---|
| 2023 | £279,666 | 17% |
6 Properties |
| 2022 | £231,543 | -6% |
48 Properties |
| 2021 | £246,149 | 16% |
71 Properties |
| 2020 | £205,550 | -4% |
43 Properties |
| 2019 | £214,332 | 3% |
41 Properties |
| 2018 | £208,477 | 11% |
37 Properties |
| 2017 | £185,055 | -1% |
37 Properties |
| 2016 | £186,242 | 6% |
62 Properties |
| 2015 | £174,331 | 8% |
50 Properties |
| 2014 | £160,683 | -8% |
40 Properties |
| 2013 | £174,202 | 11% |
29 Properties |
| 2012 | £155,227 | -10% |
41 Properties |
| 2011 | £171,318 | -19% |
29 Properties |
| 2010 | £204,679 | 14% |
42 Properties |
| 2009 | £176,777 | -8% |
44 Properties |
| 2008 | £191,737 | 13% |
41 Properties |
| 2007 | £165,860 | 13% |
44 Properties |
| 2006 | £143,787 | 13% |
37 Properties |
| 2005 | £125,342 | 13% |
43 Properties |
| 2004 | £108,584 | -6% |
63 Properties |
| 2003 | £115,249 | 33% |
66 Properties |
| 2002 | £77,739 | 18% |
84 Properties |
| 2001 | £63,516 | - |
3 Properties |